SaaS in the AI Era: A Five-Year Private Equity Playbook
An evidence-based framework for navigating the $2 trillion SaaS repricing — segmenting winners from losers across nine analytical chapters
Executive Summary: SaaS in the AI Era — A Five-Year Private Equity Playbook
Generative AI is not killing SaaS. It is bifurcating it. The February 2026 "Software-mageddon" — which saw the S&P 500 Software Index plummet by 13% in just five trading sessions, erasing more than $800 billion in market value — was the market's dramatic, indiscriminate response to a nuanced, segmented transformation. Vista Equity Partners CEO Robert Smith noted the narrative around software has shifted "quickly and sharply," but cautioned: "Investors are asking a reasonable question: what role does enterprise software play in a world where AI can do so much? We believe the narrative is wrong, but it's not irrational." This report provides the segmented, evidence-based framework that replaces blanket narratives with precision — showing PE investors exactly where SaaS is structurally at risk, where it remains defensible, and where it is actively strengthened by AI.
The sell-off conflated three distinct phenomena — cyclical multiple normalization from the 2021 bubble, structural growth deceleration in mature SaaS, and genuine AI-driven disruption risk — into a single blunt narrative. The iShares Expanded Tech-Software Sector ETF (IGV) is down 24.6% year-to-date, yet as Jefferies traders acknowledged, "the pendulum has swung so far to the sell-everything side" that "super-attractive opportunities" will emerge. Our analysis across nine chapters demonstrates that the dispersion between SaaS winners and losers will be the largest in the industry's history — and PE firms positioned to exploit this dispersion face a generational buying opportunity.
Key findings from this report:
Valuations have entered a structurally lower regime with historically wide dispersion (Chapter 1). The median public SaaS EV/Revenue multiple has compressed to an estimated 3.5–3.8x post-sell-off — the lowest since the pre-pandemic era. But the gap between infrastructure software (6.2x revenue, 36.5x EBITDA) and commoditized horizontal tools (1.1–1.9x revenue) has never been wider. Industry experts distinguish between "systems of record" — deeply embedded platforms that manage critical business data — and more commoditized "point solutions" that address narrow use cases. The latter category is most vulnerable to AI disruption.
AI reshapes SaaS cost structures in both directions (Chapter 2). Development costs are compressing dramatically as AI coding tools proliferate, while AI inference costs introduce new variable COGS that drag gross margins from the traditional 75–90% range toward 55–70% for AI-intensive products. The net effect varies enormously by category — AI-enhanced systems of record can achieve 18–30% EBITDA margins while AI-native feature tools may remain unprofitable.
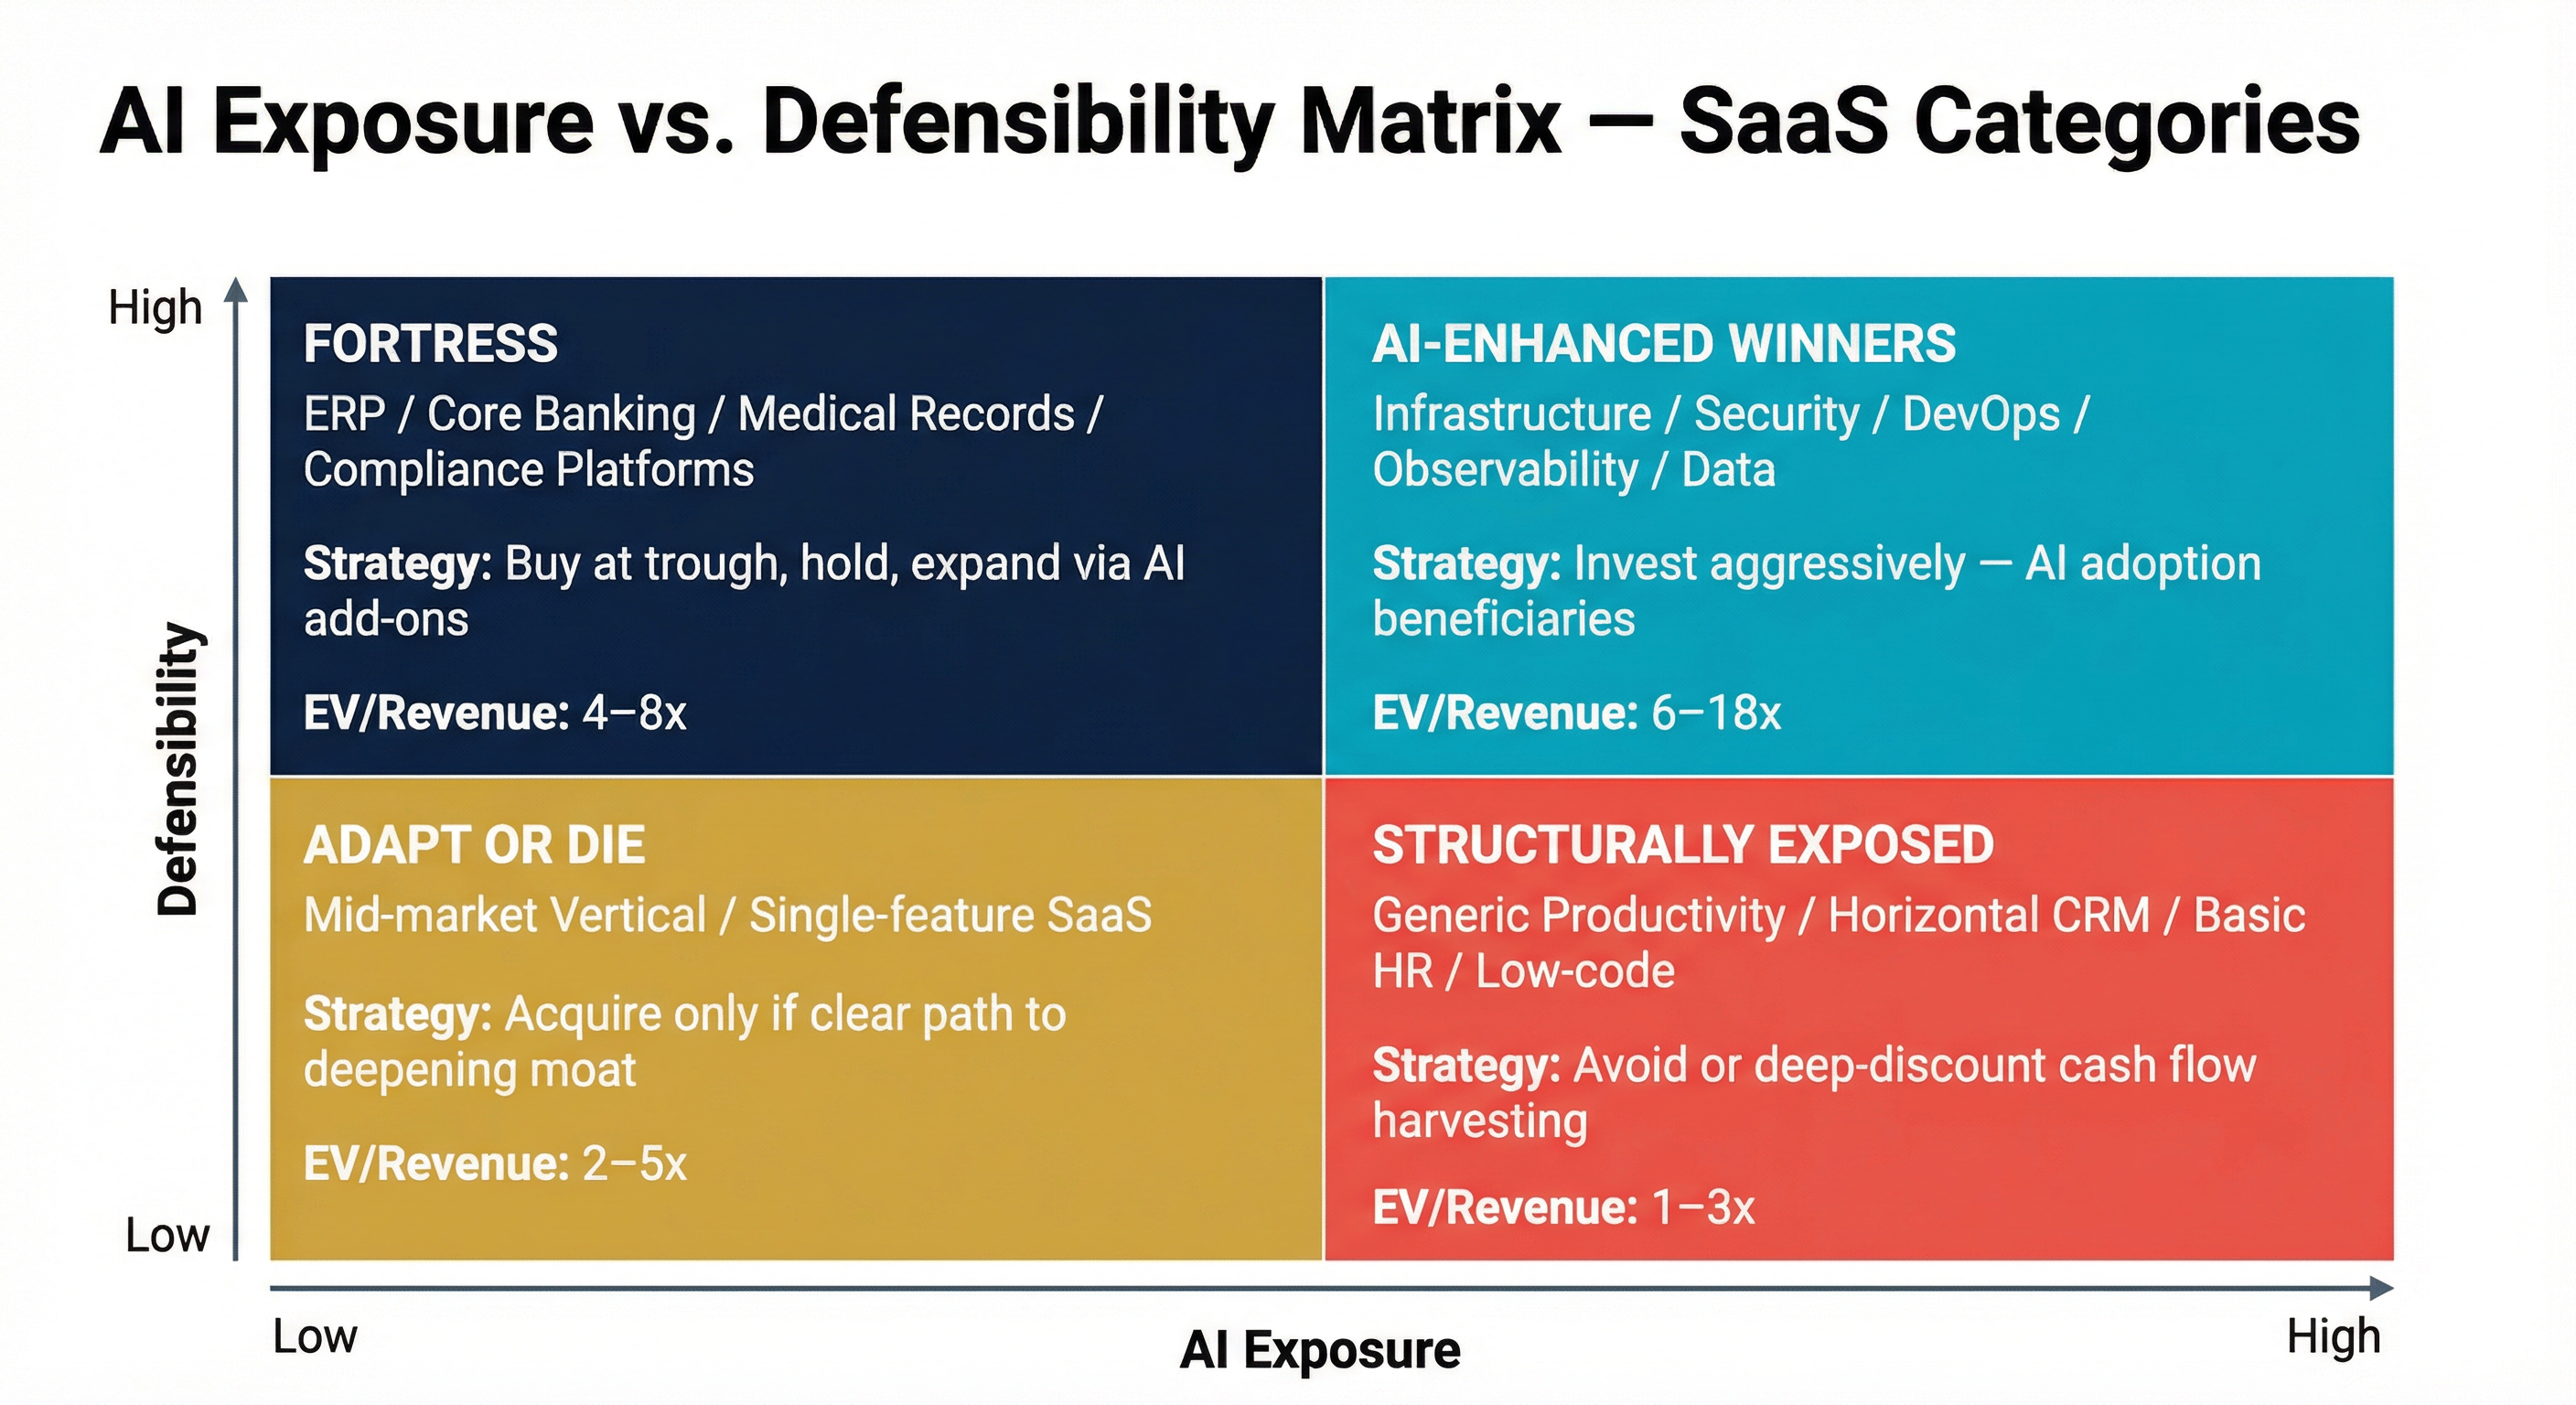
Five SaaS categories face radically different AI exposure (Chapter 3). Our risk spectrum segments the landscape from "Fortress" (mission-critical systems, infrastructure/security software) to "Structurally Exposed" (generic horizontal tools, surface-level vertical apps). The decisive test: "Can a $20/month AI agent do this task?" If the answer is yes and switching costs are low, the asset is exposed. Deeply embedded vertical platforms and infrastructure software are net beneficiaries of AI adoption.
Five defensibility mechanisms determine durable moats (Chapter 4). Proprietary customer-generated data, deep process integration, regulatory lock-in, security/trust requirements, and ecosystem switching costs — these are the mechanisms that survive AI disruption. Products that fail the "wrapper test" (remove AI features — is it still valuable?) have no intrinsic defensibility and should be avoided or acquired only at deep discounts.
The base-case valuation scenario is polarization, not uniform compression (Chapter 5). Under our most probable scenario (45–55% probability-weighted), top-quartile SaaS trades at 12–18x revenue by 2031 while bottom-quartile compresses to 0.8–2.0x — a 10–16x spread that dwarfs any previous cycle. Category selection will drive 80% of PE returns.
PE Recommendations — What Changes Immediately:
Every SaaS deal must now include an AI moat assessment using our decision tree framework, NRR decomposition to detect early disruption signals, and seat-reduction stress tests modeling 15–50% declines over the hold period. As Thoma Bravo's Spaht stated: "To think that all software is the same, we think they are missing the mark a bit... we think this could be a really exceptional buying opportunity."
What Changes Over the Five-Year Hold: PE-owned SaaS companies must execute AI product transformation within 100 days of close, migrate pricing from pure per-seat to hybrid models (base subscription plus usage/outcome components), and target 500–1,000 basis points of AI-driven EBITDA expansion — while reinvesting 30–50% of savings into revenue-expanding AI capabilities. A new class of software winners will emerge — those that can successfully orchestrate autonomous agents rather than just providing tools for humans.
Three winning archetypes identified in this report offer the strongest risk-adjusted returns: (1) Systems of record that become AI agent hubs — exemplified by Salesforce's Agentforce reaching $1.4B ARR; (2) Vertical platforms that deepen moats through proprietary AI engines and regulatory tailwinds; and (3) AI-enhanced companies that expand TAM from software budgets into the far larger labor budget. Post-sell-off entry multiples of 3.0–5.5x for these archetypes represent the deepest discount to intrinsic value since the pre-pandemic era.
The bottom line: "Replacing a core SaaS platform is effectively open-heart surgery for an enterprise," and more likely, established providers will incorporate AI into their products. The biggest risk for PE in SaaS is not AI disruption — it is failing to distinguish between the SaaS that AI will destroy and the SaaS that AI will make indispensable. This report provides the frameworks, scenarios, and operational playbooks to make that distinction with the precision the current market demands. The SaaS era is not ending. It is being rewritten. The investors who hold the pen will define the next cycle's returns.
Chapter 1: The AI Shock to SaaS Valuations
The SaaS valuation landscape has undergone a dramatic transformation. From the euphoric peaks of late 2021, when median public SaaS multiples exceeded 15x revenue, through the interest-rate-driven normalization of 2022–2024, to the AI-panic sell-off of February 2026 — the trajectory below captures one of the most significant repricing events in enterprise software history. Understanding this trajectory is essential for any PE investor evaluating SaaS opportunities in the current market.
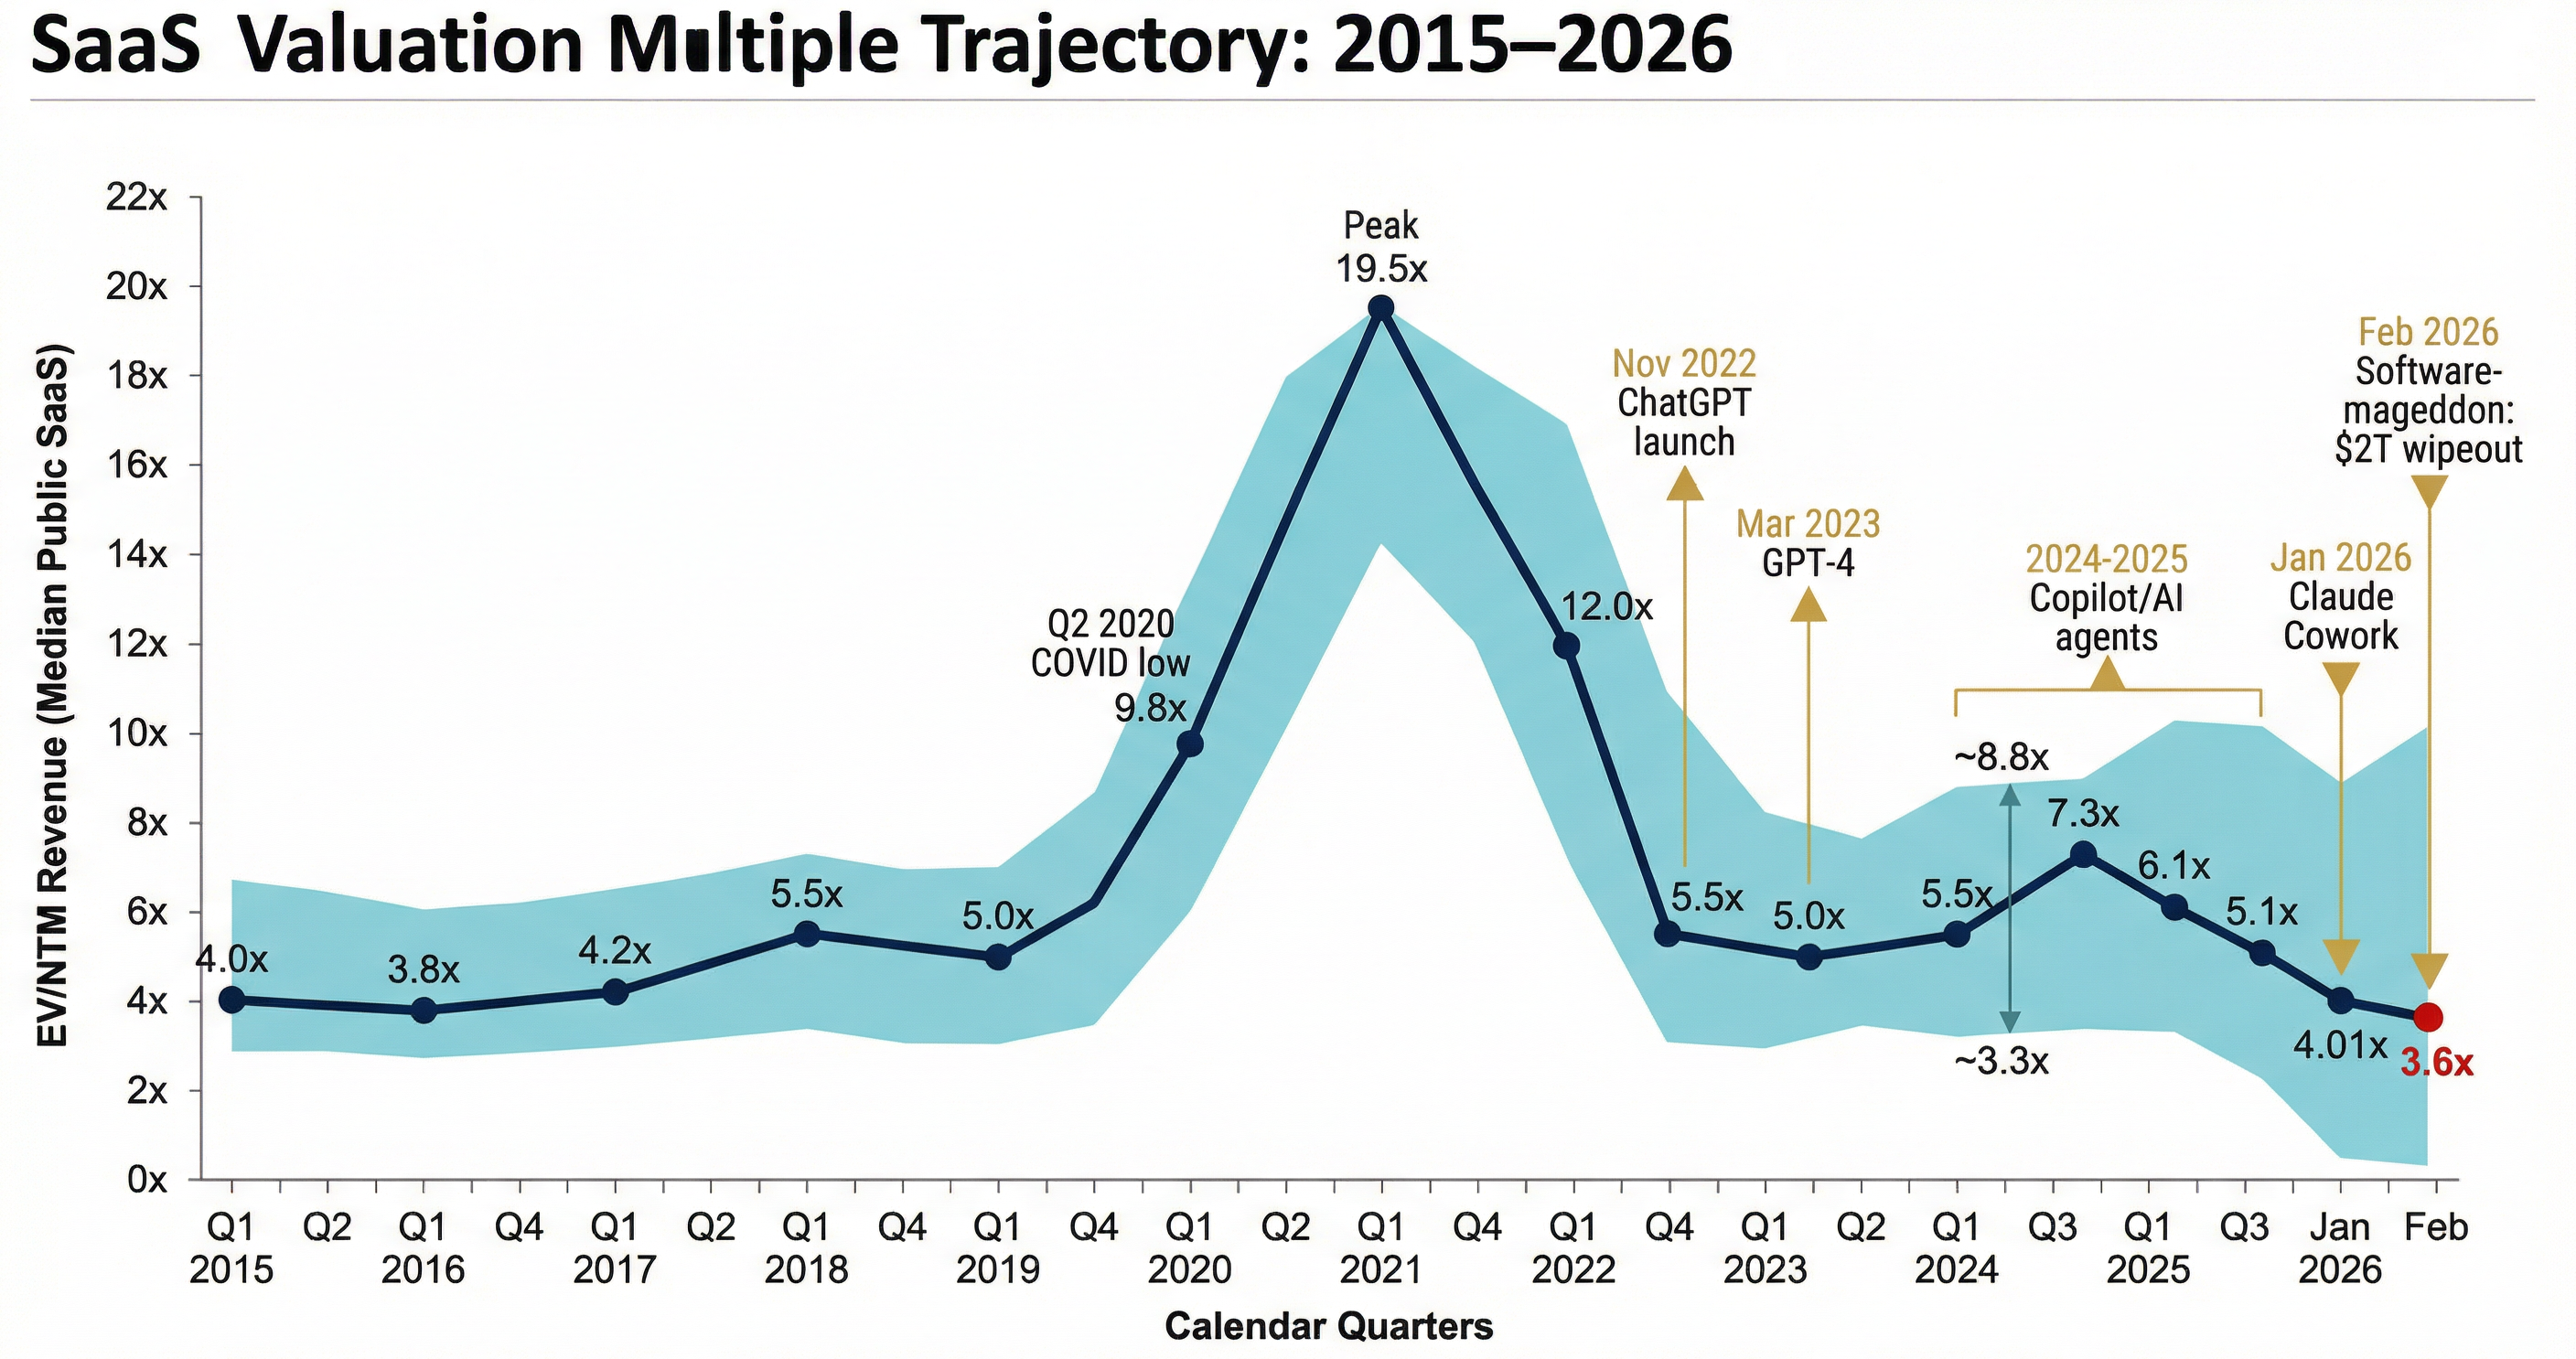
The most critical feature of this chart is not the decline itself — it is the acceleration and dispersion that emerged in late 2025 and early 2026. While the 2022–2024 compression was broadly driven by interest rate normalization, the 2025–2026 phase introduced a qualitatively new dynamic: AI-specific fear pricing, applied unevenly across subsectors. The SEG SaaS Index underscores the gap between outperformers and laggards. The upper quartile traded at 8.8x EV/TTM Revenue in Q4 2024, a 57% premium to the full Index median, while the lower quartile finished at a 41% discount to the median. By mid-February 2026, this spread has only widened further.
1.2 The February 2026 Sell-Off: Anatomy of a Paradigm Shift
The descent began in late January 2026, but the true catalyst arrived on Tuesday, February 3, a day now referred to by traders as "Black Tuesday for Software." Anthropic released a transformative suite of tools known as "Claude Cowork," introducing "agentic" capabilities — autonomous plug-ins that could navigate complex enterprise software, execute legal contract reviews, and manage financial triage without human oversight.
The market reaction was instantaneous and brutal. On February 3 alone, the S&P 500 Software Index dropped 5.7%, its worst single-day performance in years. The crisis reached its zenith between February 3 and February 5, 2026, when approximately $300 billion in market value evaporated from the software sector in a 48-hour window. The iShares Expanded Tech-Software Sector ETF (IGV) plummeted into a technical bear market, falling more than 20% from its late-2025 peaks.
The carnage was widespread but not uniform. Salesforce saw its stock plunge 14% during the week of the sell-off. By mid-February, the company was down nearly 29% year-to-date. HubSpot fell 39% year-to-date, Figma plunged 40%, Atlassian dropped 35%, and Shopify fell 29%. Selling pressure was evident across the sector, with London Stock Exchange Group falling 13%, Thomson Reuters plunging 16%, CS Disco sinking 12%, and Legalzoom plummeting 20%. Firms specializing in legal software were especially hard hit — a direct response to Claude Cowork's legal automation demonstrations.
The February sell-off's impact by subcategory reveals the unevenness of the repricing. Per-seat CRM and sales/marketing automation names bore the brunt: Salesforce's stock, the archetype of per-seat SaaS, was down close to 30% year-to-date, and the company quietly cut nearly 1,000 roles in a fresh round of layoffs. The WisdomTree Cloud Computing Fund plummeted about 20% so far in 2026, as new legal and marketing features from Anthropic's Claude Cowork made software investors more skittish about disruption. By contrast, usage-based infrastructure vendors showed relative resilience. Usage-based vendors effectively collect a tax on AI prosperity. MongoDB is a textbook example: AI apps still need to read/write real-time data, manage state, and support interactive workloads. Those needs intensify as AI usage explodes.
The sell-off's mechanics amplified the fundamental repricing. Volatility-targeting strategies, gamma exposure from options markets, and algorithmic trading systems all contributed. It took a wave of disappointing earnings reports, some improvements in AI models, and the release of a seemingly innocuous add-on from Anthropic to suddenly wake investors en masse to the threat. The result was the biggest stock selloff driven by the fear of AI displacement that markets have seen, with SaaS companies hurting more than any other category.
Yet beneath the market mechanics, a genuine structural fear was crystallizing: for over a decade, the per-seat subscription model was the gold standard of the software industry, providing predictable, recurring revenue. However, the events of early February suggest that the market is no longer convinced of the long-term viability of this model.
1.3 The Emerging Valuation Dispersion
Perhaps the most analytically significant development is not the compression itself but the widening dispersion across SaaS subcategories. The market is not applying a uniform discount to all software — it is differentiating with increasing precision.
Data Infrastructure software trades at a median EBITDA multiple of 24.4x, while DevOps commands an even higher multiple at 36.5x as of October 2025. Meanwhile, sales/marketing automation trades at just 1.9x NTM revenue, as generative AI threatens to replace traditional CRM workflows. AdTech (1.1x) and video streaming (1.8x) trade below market, reflecting fundamental business model issues.
Vertical SaaS companies command a higher EV/Revenue (7.0x vs. 4.8x) and higher EV/EBITDA (23.9x vs. 18.2x) than their horizontal counterparts, per AGC Partners' mid-2025 analysis. Investors place a strategic premium on vertical focus due to higher barriers to entry from deep industry integration, stickier customers due to workflow lock-in, and lower churn. Both segments show near-identical Rule of 40 scores and growth rates, underscoring that business model quality and defensibility — not just performance — are driving valuation premiums.
Public-to-Private Multiple Translation: A PE-Specific Lens
For private equity investors, the public market dispersion has a direct corollary in private transaction multiples. In M&A transactions during Q3 2025, the median private SaaS deal closed at 4.1x revenue, with an average of 5.4x, consistent with the range seen over the past year. The gap between median and average multiples continues to highlight a market that differentiates sharply between average performers and standout platforms. Private M&A deals see a median multiple of 4.8x revenue, with the top quartile achieving over 8.3x. Public SaaS multiples in 2025 were in the 6–7x range, with private deals at a 15–35% discount, but rising for high performers. Private equity firms value profitable SaaS businesses between 15x and 25x EBITDA, favoring predictable cash flows over high-burn models.
The critical insight for PE is that this public-private gap is not static — it widens during sell-offs as public markets reprice faster than private markets, creating a temporal arbitrage window. However, the February 2026 sell-off's severity means private market expectations are likely to compress with a 3–6 month lag, making entry timing critical.
1.4 EBITDA Multiples: A Complementary Lens
Revenue multiples capture growth expectations; EBITDA multiples capture the market's assessment of sustainable profitability. Both are essential.
EBITDA multiples for SaaS and software companies have largely normalized in 2025–2026, with private SaaS businesses trading around 22.4x median EBITDA and public software companies closer to ~12.7x. Higher multiples are concentrated among companies with strong operating leverage, predictable recurring revenue, high retention, and AI-driven efficiencies, while smaller or founder-dependent firms trade at discounts.
Companies leveraging AI effectively see valuation boosts, especially in sectors like Data Infrastructure (24.4x EBITDA) and DevOps (36.5x). The EBITDA dispersion reinforces the revenue multiple dispersion: AI-leveraging infrastructure software commands premiums 2–3x above the SaaS median, while commoditizing horizontal categories trade at significant discounts.
1.5 SaaS Revenue Growth Deceleration
The valuation compression must be understood in the context of decelerating revenue growth — a trend that predates AI disruption but is now accelerating alongside it.
The decline accelerated in 2025. By Q4 2025, median revenue growth fell to 12.2%, with forecasts pointing to a further slowdown through at least Q2 2026. This represents a decline from 17% in 2023 to 14% in 2024, continuing a multi-year trajectory.
This creates a double headwind: compressed multiples AND decelerating growth. A SaaS company that once traded at 15x revenue while growing 30% annually now trades at 4x while growing 12%. The enterprise value impact is severe — and it is this double headwind that makes the current environment the most challenging for SaaS investors since the sector's emergence.
Corporate CIOs started signaling a "budget exhaustion" phase in late 2025. While 2024–2025 was marked by frantic AI experimentation, early 2026 reflects "rationalization." A January CIO survey revealed IT budget growth expected to decelerate to 3.4% in 2026, with a more troubling internal shift: funds being diverted from application software to pay for the massive compute costs associated with the AI infrastructure boom.
1.6 The IPO Market: A Reality Check
The SaaS IPO market provides additional evidence of investor caution — and increasingly, of a structural investor preference shift away from traditional SaaS toward AI-infrastructure plays.
In 2025, IPO appetite improved only slightly amid tariff uncertainty, with tech IPOs raising $3.55 billion by midyear, just above H1 2024. SailPoint, the only enterprise software IPO in H1 2025, traded 25% below issue within four months, while Klarna was down 22.6% by late November 2025, reinforcing investor caution on growth names.
The contrasting fortunes of the 2025 IPO class are instructive. The standout success was CoreWeave, the AI hyperscaler. Listing in March at $40 per share, CoreWeave raised $1.5 billion and saw its valuation swell by 85% by year-end. This success validated the "AI utility" thesis. In contrast, the late-summer debut of Klarna served as a sobering reminder of the "valuation hangover" facing former unicorn darlings. The broader significance lies in the structural shift: the market has moved away from the SaaS obsession of the early 2020s toward "hard" tech and infrastructure. Investors now value platforms with high switching costs and essential utility, as demonstrated by the steady performance of Figma, which listed following its blocked merger with Adobe.
Looking to 2026: Renaissance Capital estimates that between 200 and 230 companies will go public in 2026, potentially raising upwards of $60 billion. The "crown jewel" of this cohort is undoubtedly Databricks, whose late-2025 funding round at $134 billion has set the stage for one of the most anticipated software IPOs in history. Goldman Sachs predicts the US issue volume could quadruple to a record $160 billion in 2026. However, the February sell-off has likely chilled the near-term IPO window for traditional SaaS names. In this market, "a profitable company — particularly one that either is an AI play or has a good story of how AI will be a tailwind — are good candidates for a 2026 IPO." The implication is clear: the IPO window is open for AI-native and infrastructure names; it remains largely shut for conventional SaaS.
| SaaS Subcategory | EV/NTM Revenue (Oct 2025) | Est. Post-Sell-off EV/NTM Revenue (Feb 2026)¹ | EV/EBITDA (Oct 2025) | Median Growth Rate | NRR Benchmark | AI Exposure |
|---|---|---|---|---|---|---|
| Data Infrastructure | 6.2x | ~5.0–5.5x | 24.4x | 20–30% | 115–130% | Beneficiary |
| DevOps / Developer Tools | 5.4–5.5x | ~4.5–5.0x | 36.5x | 18–25% | 110–125% | Beneficiary |
| Cybersecurity / Identity | 4.5–6.0x | ~4.0–5.0x | 20–28x | 20–33% | 110–120% | Beneficiary |
| Vertical SaaS (median) | 3.3x | ~2.8–3.2x | 15–22x | 12–18% | 100–115% | Mixed |
| Horizontal SaaS (median) | 3.0x | ~2.2–2.8x | 12–18x | 10–15% | 95–110% | High |
| Design / Engineering Software | 5.4–5.5x | ~3.5–4.5x² | 22–30x | 15–22% | 108–120% | Moderate |
| Sales/Marketing Automation | 1.9x | ~1.2–1.5x³ | 8–14x | 8–14% | 90–105% | Very High |
| AdTech / Streaming | 1.1–1.8x | ~0.9–1.5x | 7–10x | 5–12% | 85–100% | Very High |
| Public SaaS Median (157 co.) | 4.01x (Jan '26) | ~3.5–3.8x (est.) | 12.7x | 12.2% | ~105% | — |
| Private SaaS Median | 4.7–4.8x | ~4.0–4.5x (est. lag) | 22.4x | 15–25% | ~104% | — |
¹ Post-sell-off estimates based on sector-specific drawdowns through week of Feb 10, 2026. Infrastructure beneficiaries experienced ~10–15% compression; per-seat CRM/horizontal names ~20–35%. These are author estimates as primary databases have not yet updated.
² Figma, a key name in design software, was down 40% YTD as of Feb 4, 2026 (CNBC).
³ HubSpot, a bellwether for sales/marketing automation, was down 39% YTD as of Feb 4, 2026 (CNBC).
Primary data sources: Multiples.vc Software Valuation Multiples Report (Oct 2025); Clearly Acquired EBITDA Multiples for SaaS (2025–2026); SaaS Capital Index (Jan 2025); SEG SaaS Index Q3 2025; publicsaascompanies.com (Jan 2026); CNBC, FinancialContent, Morningstar for Feb 2026 sell-off impacts; Aventis Advisors SaaS Valuation Multiples (2025). NRR benchmarks are approximate ranges based on category averages.
The table reveals a spread of approximately 5–6x between the highest-valued subcategory (DevOps at 36.5x EBITDA) and the lowest (AdTech at 7x). Post-sell-off, the dispersion has widened further: infrastructure beneficiaries compressed ~10–15%, while per-seat horizontal names lost 25–40%. This is the market's real-time assessment of AI-era defensibility, and it provides the empirical foundation for the risk spectrum developed in Chapter 3.
Section 2: Decoding Investor Fears
The February 2026 sell-off was driven by three distinct but interconnected investor fears. Each contains genuine signal — but also significant noise. Understanding where each fear applies and where it does not is essential for PE investors seeking to price AI risk accurately.
Fear 1: "Software Becomes Free" — The Vibe Coding Threat
The first fear is that AI-generated code has reduced the cost of building software to near zero, enabling an explosion of micro-SaaS competition and custom internal tools that undermine the value proposition of commercial software.
The evidence supporting this fear is real. Vibe coding — a term coined by Andrej Karpathy (co-founder of OpenAI) — describes using AI tools to generate and refine software through natural language rather than traditional programming. The implications are significant. By 2026, AI agents are generating roughly ten times more code than human developers, according to industry analyses. Tools like Bolt.new, Replit, Cursor, and Claude Code have made it possible for non-technical users to build functional applications in hours rather than months.
But the counter-evidence is equally compelling. SaaStr's Jason Lemkin noted he had built over ten apps with vibe coding in recent months — "things that would have taken a team six months, I did in hours. But none of them replace enterprise systems of record." He observed that "shipping a v1 is maybe 2% of the work." AI code has been compared to "sugar" — providing a rush of working code but lacking the substance needed for long-term health. While generating a tool is easy, keeping it running is not.
The security implications are severe, per multiple independent analyses. Veracode's 2025 GenAI Code Security Report, which analyzed code produced by over 100 LLMs across 80 real-world coding tasks, found that GenAI introduces security vulnerabilities in 45% of cases. While models got better at writing functional or syntactically correct code, they were no better at writing secure code. Security performance remained flat regardless of model size or training sophistication, challenging the idea that "smarter" AI models naturally lead to more secure outcomes. Additionally, the Cloud Security Alliance found that 62% of AI-generated solutions have security vulnerabilities or fundamental architectural flaws — a figure cited widely in the industry as reflecting design-level weaknesses beyond OWASP line-item bugs. Industry observers have dubbed 2026 the "Year of Technical Debt," warning that the surge of AI-generated code will require extensive cleanup.
The PE implication: The "software becomes free" fear is legitimate for simple, feature-thin SaaS tools — basic CRMs, project trackers, scheduling apps — where the functionality can be replicated in a weekend with AI. It is significantly overstated for enterprise-grade software where compliance, security, scalability, integration depth, and long-term maintenance matter. Vibe coding reduces the cost of creation, but it does not change the cost of being wrong. This distinction — between building code and building a trusted business — is central to the risk segmentation in Chapter 3.
Fear 2: "Customers Build Their Own" — The Build-vs-Buy Shift
The second fear extends the first: that enterprises will increasingly bypass commercial SaaS vendors and build bespoke internal tools using AI coding platforms, eliminating the need for standardized software subscriptions entirely.
The evidence: AI has fundamentally lowered the barrier to entry for software creation. The existential threat to B2B SaaS isn't a better competitor — it's the customer themselves. The practical examples are multiplying: a marketing team that builds a custom CRM in an afternoon rather than paying for HubSpot; a finance department that generates bespoke reporting dashboards rather than subscribing to Tableau; a legal team that creates contract analysis tools rather than purchasing specialized legal SaaS.
According to the 2026 SaaS Trends Report by Blacksmith, companies have streamlined their tech stacks, with the average number of apps per organization dropping to 106, a decline from the 2022 peak of 130 as businesses eliminate redundant tools. (Note: other sources report different averages depending on company size and methodology — Zylo's 2026 SaaS Management Index reports the average company manages 305 SaaS applications, reflecting that larger enterprises with discovery tools find substantially more apps than IT officially tracks. The Blacksmith figure likely reflects mid-market enterprises and a narrower counting methodology.) This consolidation, combined with AI-enabled internal development, represents genuine pressure on vendor count and per-vendor spending.
The counter-evidence: As SaaStr's Lemkin observed, "nobody is building a homegrown CRM in Replit to replace their Salesforce instance." SaaS tools rarely just "do the thing." They also handle the invisible complexity of large organizations. Crucially, customers aren't just buying code; they are buying a service. SaaS acts as a form of liability insurance. If a vendor like Salesforce has a data leak, it is their legal and public relations problem. If an internal, AI-generated tool leaks customer data, the blame falls entirely on the company.
Some software offerings remain core to operations across a wide swath of businesses, and this is not expected to be challenged in the near- to intermediate term, per Bailard's chief investment strategist. There is, as yet, very little evidence that corporate customers are abandoning established SaaS vendors in droves for in-house AI alternatives.
The PE implication: "Build your own" is a real threat at the edges — simple internal tools, lightweight workflows, departmental utilities. But for mission-critical enterprise functions requiring compliance, audit trails, security, scalability, and vendor accountability, the build-vs-buy calculus still favors buying. PE diligence must now explicitly assess where on this spectrum each target company sits. Chapter 4 provides the decision tree for this assessment.
Fear 3: "Seat Compression" — AI Agents Destroy the Per-Seat Revenue Model
The third fear is the most structurally significant: that AI agents will reduce the number of human workers performing tasks within enterprise software, directly undermining the per-seat pricing model that underpins most SaaS economics.
The evidence is compelling and growing. It's not that AI replaces the software. It's that AI reduces the headcount that uses the software. If 10 AI agents can do the work of 100 sales reps, you don't need 100 Salesforce seats anymore. You need 10. That's a 90% reduction in seat revenue for the same work output.
Salesforce's story perfectly captures the core tension: legacy software giants are both victims and would-be beneficiaries of AI. The market simply doesn't believe they can reinvent themselves faster than AI can erode their old business models.
As Rocket Software CEO Milan Shetti noted, "The SaaS companies with user-based pricing have taken a hit, because if AI improves productivity, the number of users goes down." The math creates a perverse innovation dilemma: the more effective a SaaS company's AI features become, the fewer human seats its customers need.
The counter-evidence and nuance: SaaS companies recognize this risk and are moving to address it. Salesforce has been pioneering its "Agentic Enterprise License Agreement" (AELA) offering fixed-price access to Agentforce. ServiceNow and Microsoft are moving to consumption-based pricing alongside per-user models.
This is the single most important lens for understanding the current selloff: business model shapes destiny. What we're witnessing is a brutal reshuffling of pricing power. Usage-based vendors are more likely to climb out of the hole first, because as agents proliferate, they generate more API calls, database queries, and compute cycles — not fewer. The pricing model transition will not be immediate or uniform. Enterprises have only gradually embraced new pricing models, and many remain most comfortable with simple, predictable pricing.
The PE implication: Seat compression is the most under-modeled risk in PE SaaS diligence today. Any portfolio company generating 100% of revenue from per-seat pricing needs a migration plan. But the transition is not binary — hybrid models (base subscription + usage/outcome AI components) are emerging as the likely equilibrium. PE firms must model the revenue bridge between old and new pricing models, not just the endpoint. Chapter 6 provides the detailed playbook for this transition.
Section 3: Signal vs. Noise — Distinguishing What Matters
The market in early 2026 is conflating three distinct phenomena into a single narrative. Separating them is essential for accurate investment analysis.
Three Phenomena Masquerading as One
Phenomenon 1: Cyclical Multiple Normalization (Not AI-Related)
From 2018–2019, private software multiples gradually expanded, reaching around 4–5x. A sharp expansion occurred between 2021 and early 2022, with the median multiple peaking at 6.7x in private markets, driven by abundant liquidity and ultra-low interest rates. By 2023, sentiment shifted abruptly as rates rose, with multiples falling to just above 3x. Throughout 2023 and 2024, multiples stabilized around 2.6x, and in H2 2025, the median ticked up to 3.1x. The compression from 20x to 6–7x in public markets was driven primarily by interest rate normalization, not AI disruption. This normalization would have occurred with or without generative AI.
Phenomenon 2: Structural Growth Deceleration (Partially AI-Related)
By Q4 2025, median revenue growth fell to 12.2%, with forecasts pointing to a further slowdown through at least Q2 2026. This reflects organic market maturation. For three years, investors gave SaaS companies credit for growth re-acceleration that never came. The market is now pricing in the growth rates we actually have, not the growth rates we hope for. AI may be accelerating this trend in some categories by enabling customer consolidation, but it is not the primary cause.
Phenomenon 3: Genuine AI-Driven Disruption Risk (Real but Segmented)
This is the new variable — and it is real. But it applies unevenly. A subset of software providers, especially those running mission-critical enterprise workloads such as Oracle and ServiceNow, still have a sustained "right to earn." The depth of their data and entrenched role in customer workflows make them more likely to coexist with AI rather than be replaced outright. The critical analytical error is treating Phenomenon 3 as though it applies uniformly. It does not.
The Bain Framework: Four Strategic Quadrants
Bain & Company's Technology Report 2025 provides one of the most useful frameworks for this segmentation, identifying four strategic scenarios: core strongholds in which AI enhances SaaS, open doors in which spending compresses, gold mines in which AI outshines SaaS, and battlegrounds in which AI cannibalizes SaaS.
In core strongholds, workflows still rely on human judgment, and rivals struggle to mimic the logic behind them. Think of Procore's project cost accounting or Medidata's clinical-trial randomization — both require deep domain knowledge, strict oversight, and regulated data flows.
In open doors, people still play a role, but third-party agents can hook into exposed APIs and siphon value. Examples include HubSpot's list building or Monday.com's task boards.
In battlegrounds, AI cannibalizes SaaS. Tasks such as Intercom's Tier 1 support, Tipalti's invoice processing, or ADP's time-entry approvals are easy to automate — and just as easy for others to copy.
Most companies must pick a lane: either become the neutral agent platform or supply the unique data that powers it. This framework aligns precisely with the valuation dispersion documented in Section 1: infrastructure and data-intensive software commands premium multiples, while horizontal productivity tools trade at significant discounts.
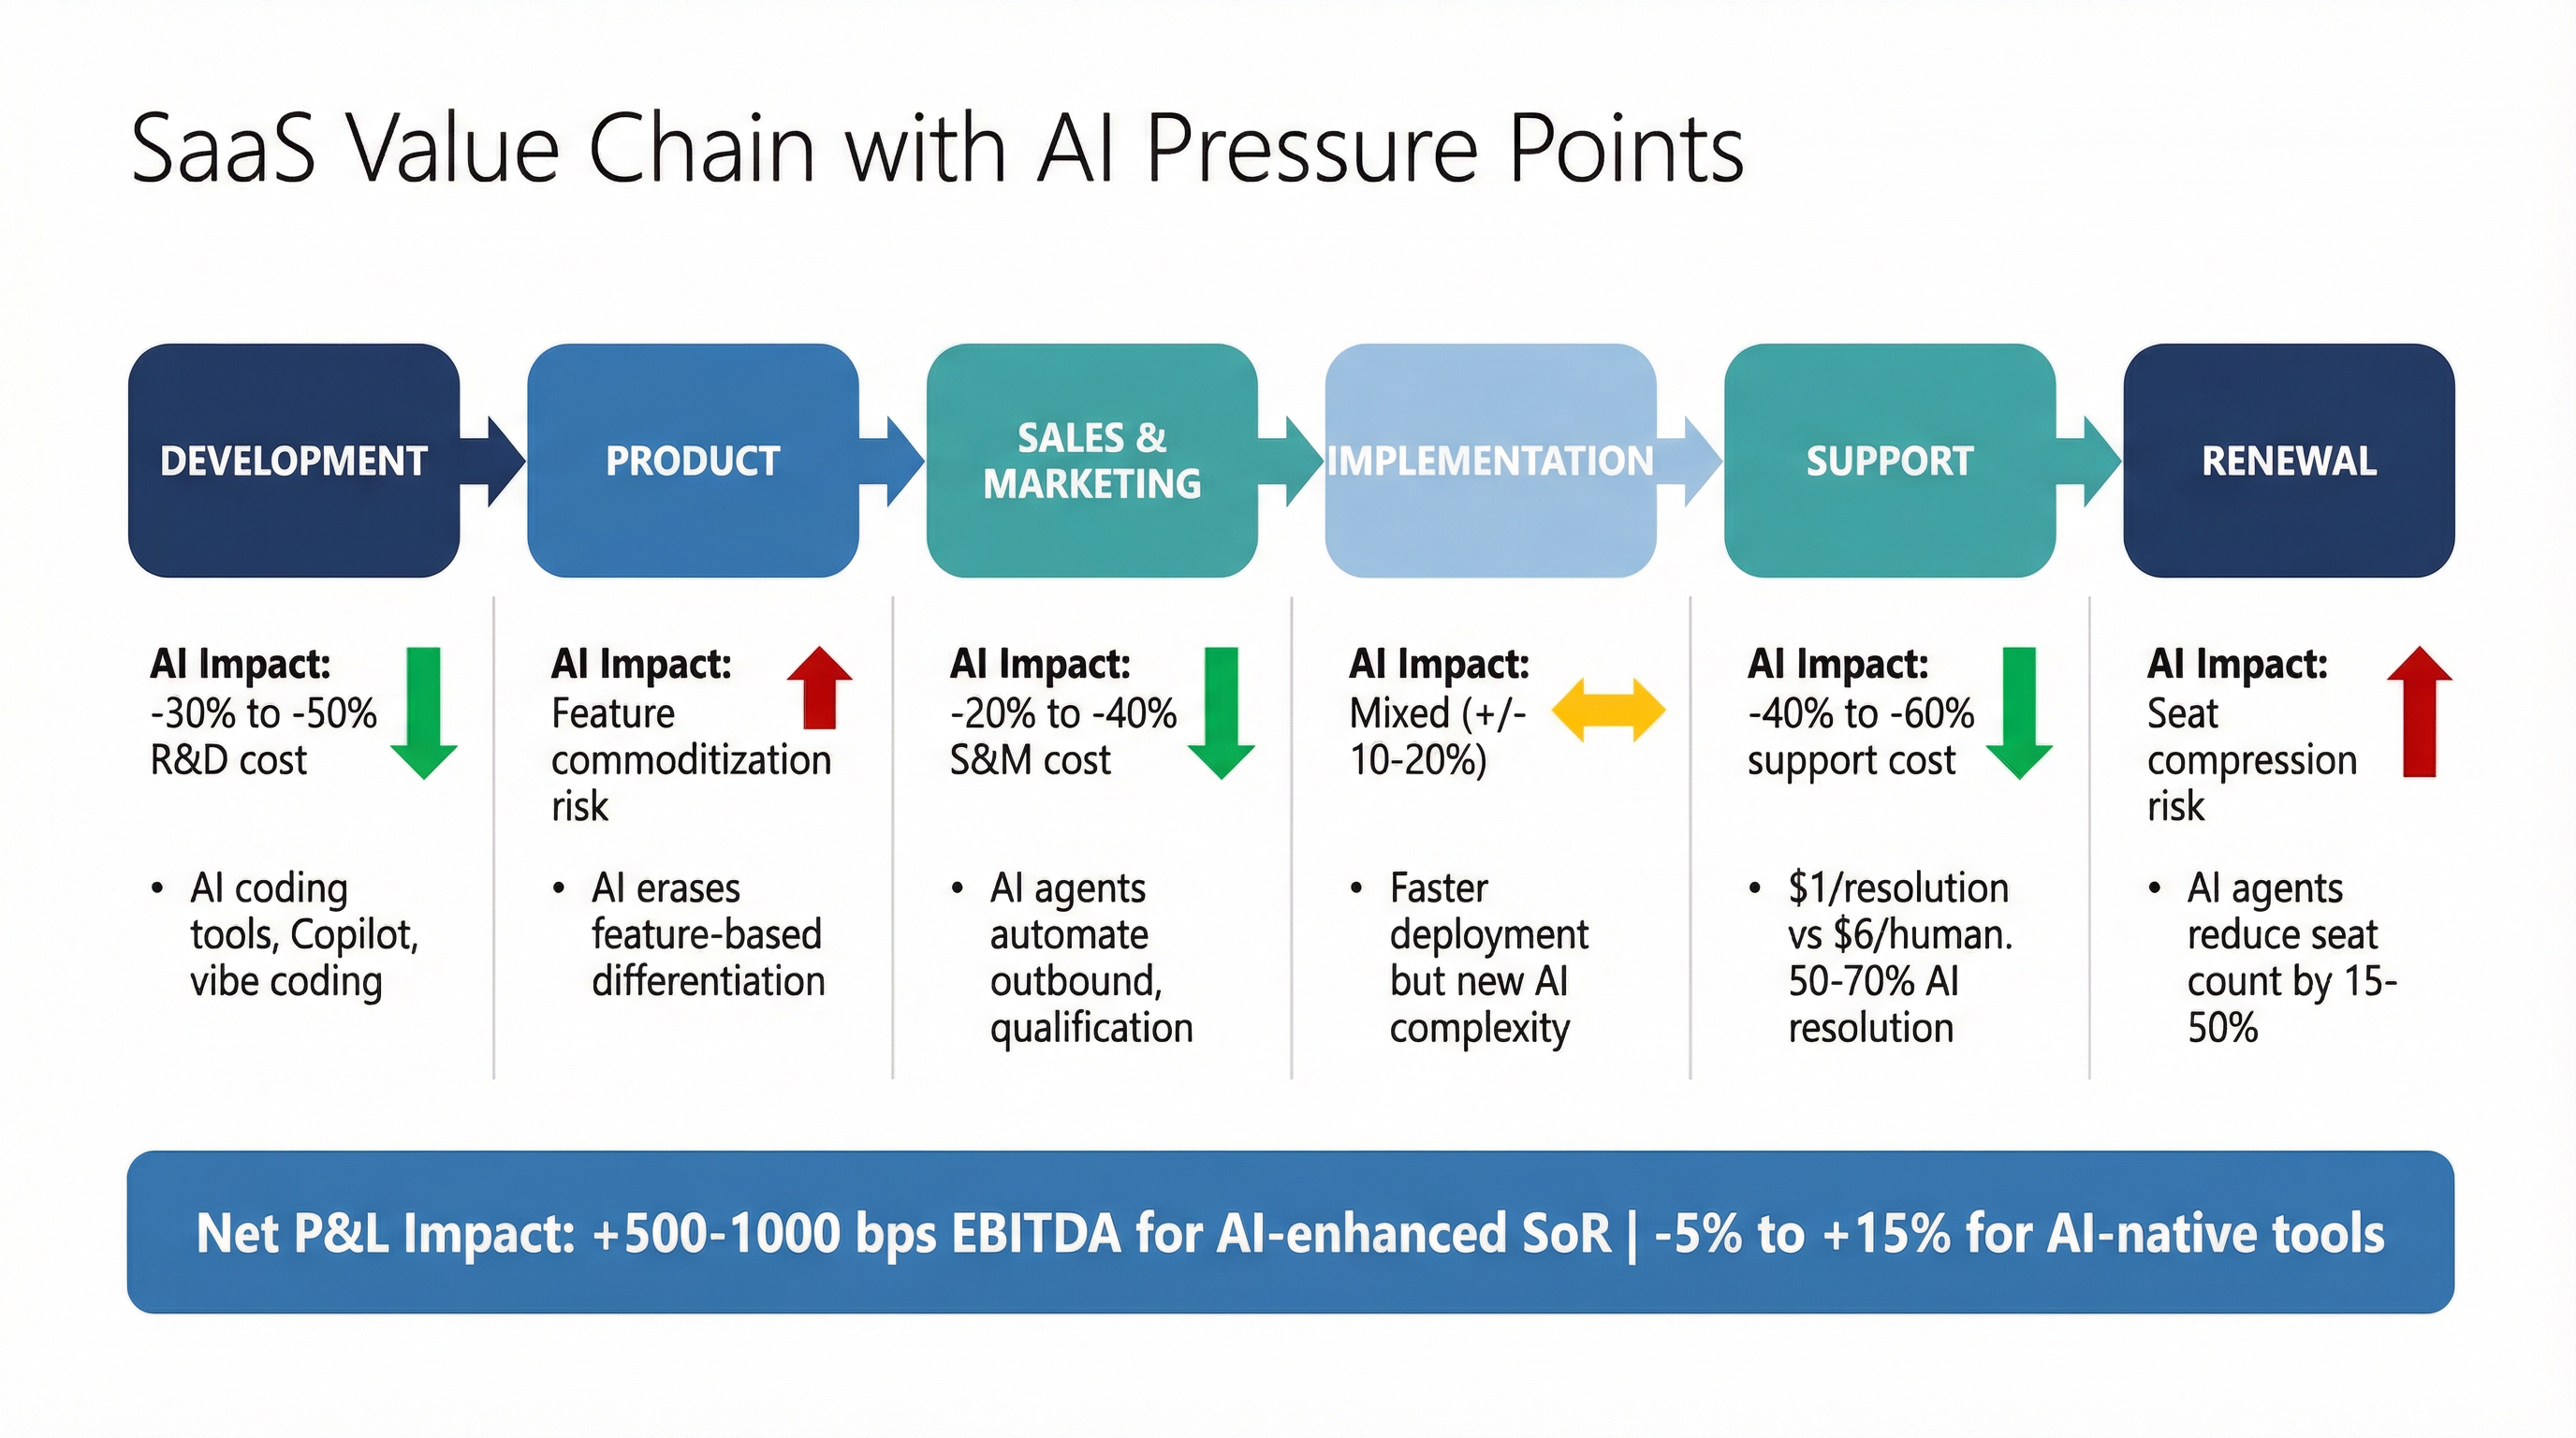
Note: The full "SaaS value chain with AI pressure points" figure mapping each Bain quadrant to specific subsector valuations is developed in Chapter 2, where it integrates with cost structure analysis. This chapter provides the valuation evidence; Chapter 2 provides the economic mechanics.
Switching Costs: The Immovable Object
One of the most important signal-vs-noise distinctions concerns switching costs. The sell-off narrative implies that enterprises will rapidly abandon established SaaS platforms. The empirical reality is far more complex.
As the Executive Summary noted, replacing a core SaaS platform like Salesforce or SAP is "open-heart surgery for an enterprise." Some software offerings remain core to operations across a wide swath of businesses — and this is not expected to be challenged in the near- to intermediate term. There is, as yet, very little evidence to suggest that AI disruption has already occurred in the sector. Revenue growth for firms definitely slowed in 2025, but slower sales tell us one thing only — that these firms are selling less, which they blamed on clients delaying purchases.
Yet switching costs are not uniformly high across all SaaS. A project management tool can be replaced in weeks. An ERP system cannot be replaced in years. This gradient is what creates the risk spectrum that this report's central framework is built upon.
The BofA Paradox: Internally Inconsistent Fears
Bank of America provided one of the sharpest analytical critiques of the sell-off's logic. BofA wrote that the SaaS selloff relies on two mutually exclusive scenarios: "AI capex deteriorating to the point of weak ROI and unsustainable growth, while simultaneously … AI adoption will be so pervasive and productivity-enhancing that long-standing software workflows and business models become obsolete."
BofA's Arya described it as an "indiscriminate selloff" that resembles the reaction to China's DeepSeek in January 2025, which proved an "overblown selloff." Both the failure of AI (threatening hyperscaler returns) and the success of AI (threatening SaaS incumbents) cannot be true at the same time.
Investors may have been overly optimistic about the benefits of AI for certain firms, but they may also be overly pessimistic about its detriments. Morningstar senior equity analyst Dan Romanoff says that software's fundamentals still look good: "We acknowledge the risks, but we believe the fears are overblown."
By mid-February, market professionals increasingly thought the punishment went too far. JPMorgan strategists saw potential for a rebound based on "overly bearish outlook on AI disruption and solid fundamentals." Goldman Sachs CEO David Solomon called the selloff "too broad."
The Speed Factor: Faster Than Expected
While the overall narrative may overshoot, the speed of AI capability advancement is the variable that most consistently exceeds market expectations. The cost curve trajectory of foundation models is accelerating downward even as accuracy improves. OpenAI's latest frontier reasoning model (o3) dropped 80% in cost in just two months. By late 2025 and early 2026, the reality on the ground was that the pace at which incumbents were adding AI lagged the pace at which native AI tools were beginning to replace them.
This speed factor means that investors planning on 3–5 year transition timelines may be calibrating too slowly. The window between "AI can theoretically do this" and "AI is actually doing this in production" is shrinking from years to months.
The Right Question
The conclusion of this signal-vs-noise analysis is the framing that will guide the remainder of this report: the right question is not "Is AI killing SaaS?" It is "Which SaaS, and how fast?"
The answer, as the valuation data demonstrates, is highly segmented:
-
Infrastructure and data platform SaaS benefits from AI adoption — more AI means more infrastructure, more security, more data management. These categories trade at premium multiples and face low substitution risk.
-
Deeply embedded vertical SaaS — systems of record with regulatory compliance, physical-world integration, and high switching costs — faces moderate pressure but retains strong defensibility. Vertical SaaS represented 54% of all SaaS M&A activity in Q3 2025, up from 43% a year earlier, as buyers increasingly targeted sector-specific platforms with embedded workflows, recurring spend, and exposure to critical end markets.
-
Generic horizontal SaaS — basic CRMs, project management, simple HR tools — faces genuine existential pressure from AI-native alternatives, vibe coding, and customer build-vs-buy decisions. These categories trade at compressed multiples and face significant pricing pressure.
-
Thin-feature SaaS and AI wrappers — products with minimal proprietary data, shallow integration, and no regulatory moat — face the highest risk. These categories trade at deep discounts and may face "fire sale" acquisition dynamics.
The VC Signal: Fewer, Larger, More Concentrated
SaaS VC value fell from $150.6 billion across 5,491 deals in 2021 to $80.6 billion in 2023, then edged up to $84.3 billion in 2024. Mid-2025 levels of $82.3 billion across just 1,569 deals underscore a regime of fewer, larger rounds concentrated in perceived category leaders. Capital is concentrating in the winners, not spreading across the sector.
Within the private market, the valuation gap between top-tier and mid-market software companies is expected to widen further. Profitable, recurring-revenue businesses operating in essential segments — such as cybersecurity, infrastructure software, and AI-enabling tools — are likely to see mild multiple expansion. In contrast, smaller or less differentiated vendors may face stagnant or even declining multiples.
Chapter Synthesis: What PE Must Take From This Data
The empirical record presented in this chapter establishes five conclusions that will inform the remainder of this report:
-
SaaS valuations have entered a structurally lower regime. The 2021 peak was an anomaly driven by zero-rate monetary policy. Pre-pandemic 4–5x revenue multiples have resumed as market norms, while high-growth SaaS businesses with low churn continue commanding valuations above 20x EBITDA. Any investment thesis predicated on a return to 15x+ revenue exit multiples is unrealistic.
-
The February 2026 sell-off was indiscriminate, but the underlying disruption risk is not. The market applied a blanket discount to all software, but AI disruption risk varies dramatically by category. Software companies offering one form of application may be at risk, while those offering full workflows powered by infrastructure could be buying opportunities. This gap between market pricing and segmented reality creates opportunity for sophisticated investors.
-
Valuation dispersion is at historically wide levels — and widening. The spread between top-quartile and bottom-quartile SaaS has never been larger. In 2025, results within the SEG SaaS Index reflected meaningful dispersion, with performance concentrated among the upper quartile. While the broader Index declined, the top quartile delivered approximately 6% YoY gains, driven by companies tied to mission-critical workflows, data infrastructure, and AI enablement. Category selection will drive the majority of PE returns in SaaS over the next five years.
-
The three investor fears contain genuine signal. Vibe coding, customer build-vs-buy shifts, and seat compression are not fiction. But each applies primarily to specific SaaS categories — not uniformly across the sector. PE firms that can precisely assess where each fear applies will gain significant investment edge.
-
Speed of disruption is the variable most likely to be underestimated. AI capability improvement is exponential, not linear. Planning horizons must be compressed accordingly.
Chapter 2: How Generative AI Changes SaaS Economics
The preceding chapter documented what happened to SaaS valuations and why investors are repricing the sector. This chapter explains how — by providing a rigorous, line-item analysis of how generative AI alters SaaS cost structures, competitive dynamics, and business models. As Chapter 1 established, the February 2026 sell-off erased more than $800 billion in market value in a single week and contributed to an estimated $2 trillion in cumulative losses from the sector's peak, driven by fears that AI would commoditize software economics.1 But the actual economic impact is far more nuanced than the headline narrative suggests. AI simultaneously compresses some costs, inflates others, destroys certain revenue streams, and creates new ones. The net effect varies dramatically by SaaS category — a critical finding that will inform the risk spectrum developed in Chapter 3.
This chapter is structured as a consulting deep-dive across five sections: development cost compression, feature commoditization dynamics, customization and implementation shifts, support and services cost changes, and the critical intersection of gross margin erosion versus operating leverage expansion. For PE investors, these are the line items that determine whether an AI-exposed SaaS investment is a value trap or a margin expansion opportunity.
Section 1: Development Cost Compression
The New Economics of Building Software
The cost of building software has undergone the most dramatic compression in the history of the industry. Gartner forecasts enterprise software spending rising at least 40% by 2027, with generative AI as the primary accelerant, while global spending on AI-enabled applications could hit $644 billion in 2025, an increase of 76.4% from 2024. This spending surge both reflects and accelerates AI tool adoption: a 2025 Pragmatic Engineer survey reported that approximately 85% of developer respondents use at least one AI tool in their workflow, while according to Stack Overflow's 2025 Developer Survey, 65% of developers are using AI coding tools at least weekly.
The market leaders are scaling rapidly. GitHub Copilot maintains an estimated 42% market share among paid AI coding tools, benefiting from deep integration with Visual Studio Code and GitHub's dominant position in code hosting. Approximately 90% of Fortune 100 companies have adopted GitHub Copilot, validating the tool as an enterprise-grade solution. Meanwhile, Cursor's ARR has surpassed $500 million, capturing approximately 18% market share among paid AI coding tools — up from near zero just 18 months ago. Vibe coding platforms are showing even faster trajectories: Lovable reached $100 million ARR in just 8 months, and Replit's annual recurring revenue exploded from $10 million to $100 million in the 9 months following their Agent release.
These tools generate measurable productivity improvements — though the evidence is more nuanced than vendor claims suggest. Early studies from GitHub, Google, and Microsoft — all vendors of AI tools — found developers completing tasks 20% to 55% faster. Large enterprises report a 33–36% reduction in time spent on code-related development activities. However, the reality is not uniformly positive: a rigorous METR randomized controlled trial published in July 2025 studied how early-2025 AI tools affect the productivity of experienced open-source developers. Sixteen developers with moderate AI experience completed 246 tasks in mature projects on which they had an average of 5 years of prior experience. Surprisingly, allowing AI actually increased completion time by 19% — AI tooling slowed developers down. The study's implications are nuanced — despite this slowdown, developers believed AI had sped them up by 20%, revealing a massive disconnect between perception and reality. While seasoned developers may struggle with workflow disruption on deeply familiar codebases, other research shows GitHub Copilot's own research has often reported significant productivity boosts, sometimes up to 26% or even 55% faster for specific tasks.
The Training Cost Collapse
Beyond coding tools, the cost of training AI models themselves has fallen at an extraordinary rate. Sam Altman, CEO of OpenAI, stated in 2023 that foundational model training had cost "much more" than $100 million. By contrast, DeepSeek's reasoning-focused R1 model cost $294,000 to train using 512 Nvidia H800 chips, according to a peer-reviewed Nature publication. However, context matters: the $294,000 figure excludes approximately $6 million spent developing the foundational base model for R1. And some analysts argue the true costs are higher still: by one estimate, the purchase cost of the 256 GPU servers used to train the models exceeds $51 million.
At the extreme end, UC Berkeley's TinyZero project replicated a scaled-down version of DeepSeek's AI for just $30 using open-source tools and a single Nvidia H100 chip. While TinyZero's capabilities are limited to basic tasks like counting and multiplication, its significance lies in demonstrating the increasing accessibility of AI technology.
Quantitative Breakdown: AI Inference Cost Dynamics
For PE investors evaluating SaaS targets, understanding inference cost structure is essential because, unlike training, inference costs accrue continuously with every user query. By 2027, inference is projected to represent 80–90% of total compute spend for any scaled AI product. The cost trajectory has been dramatic: for an LLM of equivalent performance, the cost is decreasing by approximately 10x every year, according to analysis by Andreessen Horowitz. GPT-4-equivalent performance now costs $0.40 per million tokens versus $20 in late 2022.
Current per-token pricing benchmarks (as of early 2026) illustrate both the rapid decline and the wide variance:
| Model / Provider Tier | Cost per Million Tokens (Input/Output) | Context |
|---|---|---|
| GPT-4o (OpenAI) | ~$3 / $10 | Frontier proprietary model |
| Claude 3.5 Sonnet (Anthropic) | ~$3 / $15 | Frontier proprietary model |
| DeepSeek-V2 | $0.14 / $0.28 | Open-source, MoE architecture |
| DeepSeek R1 (Reasoner) | $0.55 / $2.19 | Open-source reasoning model |
| Llama 3.2 3B (via Together.ai) | $0.06 / million | Smallest open-source model |
| MoE model on Blackwell (DeepInfra) | $0.05 / million | Latest hardware optimization |
Sources: Introl Blog (Dec. 2025 update); Andreessen Horowitz LLMflation analysis; IntuitionLabs; NVIDIA Blog (Feb. 2026); Epoch AI.
In early 2025, OpenAI's CEO observed that DeepSeek's R1 runs 20–50x cheaper than OpenAI's comparable model. However, two critical caveats apply to these headline cost reductions. First, the rate of decline varies dramatically depending on the performance milestone, ranging from 9x to 900x per year. Second, frontier reasoning models are getting more expensive, not cheaper — the rise of agentic workflows has caused token consumption per task to jump 10x–100x since December 2023, as chain-of-thought and multi-step reasoning generate far more tokens per request. MIT research has found that infrastructure and algorithmic efficiencies are reducing inference costs for frontier-level performance by up to 10x annually, but this applies to older performance benchmarks, not the ever-advancing frontier.
For a typical SaaS application deploying AI features, inference costs translate to the P&L as follows. Assume a mid-market SaaS product with 10,000 active users, each generating an average of 500 AI-assisted interactions per month, with each interaction consuming approximately 2,000 tokens (input + output combined). At $1 per million tokens (blended, mid-tier pricing): monthly inference cost = 10,000 × 500 × 2,000 ÷ 1,000,000 × $1 = $10,000/month, or $120,000/year. At $5 per million tokens (frontier model pricing): $600,000/year. At $0.10 per million tokens (optimized open-source on latest hardware): $12,000/year. This 50x cost range between frontier and optimized open-source models illustrates why AI compute cost management is a first-order P&L lever.
The Implication: Barrier to Entry vs. Barrier to Trust
For PE investors, the critical distinction is between building code and building a business. As Chapter 1 documented, SaaStr's Jason Lemkin noted that he had built over ten apps with vibe coding — things that would have taken a team six months were completed in hours — yet none of them replaced enterprise systems of record. The development cost compression has implications that cut both ways:
Lower barrier to entry for new competitors. A startup can now ship an MVP in weeks rather than months, at a fraction of the previous cost. This creates genuine competitive pressure for SaaS companies whose differentiation is primarily feature-based. A generative AI agent can replicate a core dashboard in a single weekend. The era of feature parity is here, and it is forcing a massive rethink.
Unchanged barrier to building enterprise-grade platforms. Veracode's 2025 GenAI Code Security Report, which analyzed 80 curated coding tasks across more than 100 LLMs, found that AI produces functional code but introduces security vulnerabilities in 45% of cases. Enterprise customers require compliance, audit trails, scalability, and vendor accountability — none of which vibe coding delivers. The cost of creation has fallen; the cost of being wrong has not.
Accelerated development for incumbents. Companies that already have enterprise-grade platforms can leverage AI coding tools to ship features faster and reduce R&D headcount. Vista Equity Partners' Robert F. Smith has argued that generative AI can reduce product development costs from 30% to 20% of revenue.
The net effect on the SaaS P&L: R&D as a percentage of revenue declines from a typical 25–35% range toward 15–25%, freeing 500–1,000 basis points for either margin expansion or reinvestment. A notable change in 2025 benchmarks is that the percentage of revenue allocated to R&D in early-stage companies (< $5M ARR) is already lower than in previous years. But this benefit flows primarily to established platforms that deploy AI to accelerate development — not to new entrants that use AI to build competitive clones.
Section 2: Feature Commoditization Dynamics
When Code Is No Longer a Moat
The development cost compression described above has a profound downstream effect: the commoditization of individual software features. This is arguably the single most important structural change that AI introduces to SaaS economics.
Even a technically complex SaaS product is composed of well-known technologies, with a fair amount of "glue" code to hold it in a particular way that fits their value proposition. As SaaS Capital's analysis noted, few SaaS companies derive competitive advantage from true innovation in their code. SaaStr's analysis of 20+ deployed AI agents found that generic GTM agents — sales, marketing, support — have weak moats. The implications are stark: the winners will not be determined by who has the best underlying AI. They will be determined by who builds the best everything else around that AI — the workflow infrastructure and data assets.
This insight directly validates the signal-vs-noise framework from Chapter 1. As the February 2026 sell-off data showed, companies perceived as relying on algorithmic or feature-based differentiation bore the brunt of the repricing. The locus of value is shifting from "what your software can do" to "what data, workflows, and trust your software controls."
Features That Have Been Commoditized
The following categories of features have already reached effective parity across AI tools and are no longer sustainable sources of differentiation:
- Basic text generation and summarization. Any SaaS product offering AI-powered text drafting, email generation, or document summarization is offering a capability that frontier models deliver natively.
- Simple data analysis and visualization. Basic dashboarding and reporting capabilities can be replicated by prompting a foundation model with a dataset.
- Tier 1 customer support automation. As documented in Section 4 below, AI-powered support resolution has become table stakes, not a premium feature.
- Generic contract review and extraction. The Anthropic Claude Cowork release that triggered the February sell-off demonstrated that legal document analysis is approaching commodity status.
- Code generation for standard patterns. Routine CRUD operations, API integrations, and boilerplate code generation offer zero differentiation.
Features That Resist Commoditization
In contrast, certain capabilities remain defensible because they depend on assets that AI alone cannot create:
- Features built on proprietary customer-generated data. An AI recommendation engine trained on five years of customer behavior data within a specific industry vertical cannot be replicated by a foundation model with a prompt.
- Features embedded in regulated workflows. A compliance monitoring feature that is the auditable system of record for HIPAA or SOX cannot be replaced by a general-purpose AI tool without enterprise liability implications.
- Features that control physical-world operations. Software that manages construction safety protocols, pharmaceutical manufacturing processes, or supply chain logistics involves real-world consequences that resist digital substitution.
- Features with deep integration dependencies. When a feature depends on real-time connections to dozens of enterprise systems (ERP, CRM, HRIS, financial systems), the integration complexity is the moat — not the code.
The PE diligence implication: any SaaS company whose competitive advantage rests primarily on a feature that could be described in a single prompt is overvalued relative to companies whose advantage rests on data, integration, or regulatory positioning. Chapter 4 will develop this into a formal decision tree.
Section 3: Customization and Implementation Dynamics
The Traditional Implementation Layer
SaaS implementation and customization has historically been a significant revenue and cost driver. Professional services at the median represents approximately 15% of total SaaS revenue. If a SaaS company's mix of professional services revenue to subscription revenue exceeds 15–20% of total revenue and/or if services gross margin is lower than 30%, the total gross margin is likely to be lower than the median benchmark of 77%. For enterprise platforms like Salesforce, SAP, or Workday, implementation projects commonly spanned 6–18 months and cost multiples of the annual software license.
AI is reshaping this layer in complex and sometimes contradictory ways.
How AI Accelerates Implementation
AI tools can now automate many implementation tasks that previously required specialized consulting:
- Configuration generation. AI can analyze a customer's existing workflows and automatically generate recommended configurations, reducing setup time from weeks to days.
- Data migration assistance. AI-powered tools can map data schemas, clean source data, and automate the migration pipeline.
- Documentation and training. AI generates context-specific training materials, user guides, and workflow documentation at a fraction of the previous cost.
- Custom integration development. AI coding tools accelerate the development of custom connectors and API integrations.
According to McKinsey research, generative AI could automate activities that consume 60–70% of employees' time in knowledge work industries. For SaaS implementation specifically, this suggests potential time reductions of 30–50% for standard deployments.
How AI Introduces New Implementation Complexity
However, AI also creates entirely new implementation requirements that offset some of these savings:
- Model tuning and fine-tuning. Enterprise AI features often require customization of underlying models to reflect industry-specific terminology, regulatory requirements, and organizational preferences. Fine-tuning costs range from $5,000–50,000 per model iteration for enterprise-grade customization.
- Data pipeline setup. AI features require structured access to customer data through vector databases, embeddings, and retrieval-augmented generation (RAG) pipelines. Embeddings and vector databases add cost per query and per GB of storage in production deployments, typically $0.10–0.50 per GB monthly for RAG implementations.
- AI governance and compliance configuration. Enterprises deploying AI features need guardrails, bias testing, explainability configurations, and compliance documentation — a new category of implementation work.
- Forward-deployed engineering. Leading firms are increasingly turning to forward-deployed engineers (FDEs), technical experts embedded directly on-site with clients to drive successful implementation, integration, and scaled adoption of AI. These teams bridge product and service, helping customers pilot gen AI, tailor agents to their workflows, and continuously optimize deployments. In consumption-led models — where usage drives revenue — this role becomes even more critical. FDEs not only accelerate time to value but also increase the likelihood of sustained adoption.
Empirical Data: The Professional Services Mix Shift
The shift in professional services composition is now measurable. In 2025, the AI services segment led the market and held the largest revenue share of 36.3%. This segment is anticipated to exhibit the highest CAGR over the forecast period, driven by the increasing adoption of AI-driven consulting, integration, and support services as businesses seek to optimize AI implementation. Organizations require expert guidance to integrate AI solutions into existing infrastructures, leading to a surge in demand for managed and professional services. Additionally, continuous AI advancements necessitate regular updates, maintenance, and training, further boosting the services market.
Industry benchmarks predict the ARR per FTE increase will continue as legacy SaaS firms are being evaluated against native-AI and agentic AI companies with 2x–3x higher productivity. For implementation services specifically, emerging data suggests that 20–35% of professional services hours at AI-enhanced SaaS firms now involve AI-specific work — model tuning, data pipeline engineering, AI governance configuration, and forward-deployed engineering — that did not exist as a category three years ago. This shift is transforming professional services from a low-margin, largely commoditized cost center into a higher-value, strategically differentiated offering.
Net Impact on Professional Services Revenue
The net effect is a transformation, not an elimination, of the professional services layer. Implementation timelines for standard configurations compress by 30–50%, reducing billable hours for routine deployments. However, new categories of AI-specific implementation work emerge — model tuning, data pipeline engineering, governance setup, and forward-deployed engineering — that partially offset the compression.
For PE-owned SaaS companies, the implications are:
- Professional services margins may improve. AI automates the low-value, repetitive aspects of implementation while the new AI-specific work commands premium billing rates.
- Mix shift toward higher-value services. The balance shifts from rote configuration to strategic AI deployment consulting.
- Faster time-to-value improves retention. Compressed implementation timelines reduce the risk of customer churn during long, painful deployments.
- New revenue streams emerge. AI model tuning, data governance, and ongoing optimization create recurring services revenue that did not previously exist.
Section 4: Support, Onboarding, and Services Cost Shifts
The AI Customer Support Revolution
AI customer support is one of the most tangible and already-realized areas of SaaS cost structure transformation. As the Executive Summary documented, customer success tools captured $630 million in enterprise AI spending in 2025, with AI handling ticket routing, sentiment analysis, and proactive outreach.
Intercom's Fin AI Agent exemplifies this shift. Its resolution-based pricing model — $0.99 per successful resolution — represents a fundamental departure from the traditional per-seat support model. This means customers are not paying for the AI's availability or the number of queries it handles, but rather for the tangible outcome: a resolved customer issue.
The economics are compelling: if one human agent costs $4,000/month and handles 600 conversations, each conversation costs approximately $6.67 in human time. Fin at $0.99 per resolution saves $5.68 per conversation. At 1,000+ resolutions per month, that's $5,680+ in monthly savings. Within six months of deployment, one documented case showed Fin had resolved over 6,000 conversations, saved the team over 1,300 hours, and pushed self-serve support rates as high as 87%.
The broader trend is even more significant. Across industries, the global baseline for customer support sits around $6–$7 per contact. Companies adopting AI and self-service effectively see 25–45% ticket deflection and ROI multipliers of 2x to 5x within the first year.
Impact on SaaS COGS and Service Margins
For SaaS companies that operate large customer support organizations, AI support automation directly reduces cost of goods sold (COGS). The impact flows through the P&L in several ways:
Headcount reduction in Tier 1 support. AI handles routine inquiries — password resets, billing questions, basic how-to guidance — that previously required live agents. With resolution rates of 50–70%, support headcount for routine inquiries can be reduced by 40–60%.
Improved service margins. Support and customer success teams shift from reactive ticket handling to proactive account management and strategic advisory — higher-value activities that justify premium pricing.
Reduced onboarding costs. AI-powered onboarding assistants guide new users through setup, configuration, and initial usage, reducing the manual onboarding burden that typically requires 2–4 hours of CSM time per customer.
However, as with all AI cost savings, there are countervailing factors. Vendors lure customers with generous pilot credits, yet scaling to production routinely reveals 500–1,000% cost underestimation. The cost of AI inference for support chatbots must be netted against labor savings to determine true P&L impact. Using the token-cost framework from Section 1: a support chatbot handling 10,000 resolutions per month at an average of 3,000 tokens per interaction, priced at $1/million tokens (blended), incurs roughly $30/month in inference cost — negligible against the $6.67/interaction human equivalent. Even at $10/million tokens, the cost is $300/month for 10,000 resolutions versus $66,700 in equivalent human labor. This asymmetry explains why support automation delivers the most immediately realizable AI benefit.
The Pricing Model Signal
Intercom's pay-per-resolution model is a leading indicator of a broader pricing transformation across SaaS. Gartner forecasts 40% of enterprise SaaS will include outcome-based elements by 2026, up from 15% a few years ago. Zendesk now charges $1.50 per AI-resolved ticket, and HubSpot offers metric-linked tiers, which reportedly boost customer retention by 31% and customer satisfaction by 21%. ServiceNow has Assists, and Salesforce has Flex Credits based on actions. Software companies are moving toward models that align revenue with the value delivered, charging based on outcomes achieved, actions taken, or compute resources consumed.
AI's high computing demands are pushing vendors toward consumption-based or outcome-oriented models. Only 16% of providers monetized AI standalone by late 2025, but those who did saw 2–3x higher traction. For PE investors, this transition has direct valuation implications: usage-based revenue is inherently less predictable than seat-based subscriptions, potentially reducing the multiple the market assigns to recurring revenue streams unless companies demonstrate consistent consumption growth.
Section 5: Gross Margin vs. Operating Leverage — The New Math
This section contains the chapter's most critical analytical contribution. Traditional SaaS enjoyed a P&L structure that was the envy of nearly every other industry: 75–90% gross margins, near-zero marginal cost per additional user, and massive operating leverage as fixed costs were amortized across a growing customer base. AI disrupts this beautiful economics in both directions — compressing gross margins through inference costs while simultaneously creating operating leverage through automation. The net effect depends entirely on the category and execution.
The Gross Margin Compression Problem
The fundamental economic shift is that AI inference is not free. Traditional SaaS is beautiful from a unit economics standpoint: you build the software once, host it cheaply, and the marginal cost of each new customer approaches zero. That's how you get to 75–80% gross margins. AI changes this calculus. Every single AI inference — every ChatGPT response, every Copilot code suggestion — burns actual compute.
The data on AI-first gross margins is sobering:
- AI-native product gross margin benchmarks are in the range of 50%–65%, while traditional SaaS company gross margin benchmarks are in the 70%–85% range.
- The Bessemer State of AI 2025 report highlights that the fastest-growing AI-native companies — or as they call them "Super Novas" — typically have gross margins in the approximately 25% range as they trade off gross profit for user adoption and engagement.
- AI may tap a 10x larger TAM, but its gross margins (40–60%) are structurally lower than traditional SaaS (70–85%).
The cost structure impact is particularly acute for companies that rely on third-party APIs. One analysis finds that 84% of enterprises are watching gross margins erode by 6% or more due to AI infrastructure costs. For companies with heavy AI workloads, that hit reaches 16%, translating to $12M+ in lost EBITDA on a $200M portfolio company. The problem is compounded by poor cost visibility: an estimated 50% of companies with AI-core products do not include LLM API costs in their P&L reporting at all — treating inference costs as a feature development expense, not a cost of serving the customer.
The case of Replit illustrates both the challenge and the path forward: Replit saw its revenue rocket from approximately $2M ARR to $144M ARR in a year by 2025, but only by moving to usage-based plans could it lift gross margin from single digits into the approximately 20–30% range. At one point in 2024, Replit's gross margin was reportedly under 10%, even dipping negative during a usage surge.
However, margin trajectory is not static. OpenAI's compute margin jumped from around 35% in January 2024 to roughly 70% by October 2025. Anthropic has projected its gross profit margin to reach 50% in 2025 and 77% by 2028. There is a critical caveat, however: the inference cost declines are happening on older model benchmarks. The fastest price drops have occurred in the past year, so it's less clear that those will persist. Frontier models are getting more expensive, not cheaper, and the rise of agentic workflows has caused token consumption per task to jump 10x–100x since December 2023.
The Capex Burden: AI Infrastructure and FCF Implications
A critical and frequently overlooked dimension of AI's impact on SaaS economics is the capital expenditure required to support AI-intensive products. While hyperscaler capex dominates headlines, the downstream implications for SaaS companies are substantial.
The five largest US cloud and AI infrastructure providers — Microsoft, Alphabet, Amazon, Meta, and Oracle — have collectively committed to spending between $660 billion and $690 billion on capital expenditure in 2026, nearly doubling 2025 levels. These costs ripple through to SaaS companies in several ways:
-
Higher cloud hosting costs. As hyperscalers invest aggressively, they pass costs through to customers via higher-priced GPU-optimized compute tiers. SaaS companies deploying AI features on cloud infrastructure face 2–5x higher compute costs per workload compared to traditional application hosting.
-
On-premises GPU procurement. Some SaaS companies are investing in their own GPU infrastructure to reduce per-inference costs. H200 with 141GB HBM3e is now widely available at $30,000–$40,000 purchase price and $2.15–$6.00/hour cloud pricing, enabling single-GPU serving of 70B models that previously required two H100s. For a portfolio company investing in even a modest GPU cluster (e.g., 8 H100s at approximately $25,000 each = $200,000), this represents material capex that flows through depreciation and directly impacts FCF.
-
FCF compression during build phase. Analysts model scenarios in which capital intensity meaningfully depresses FCF in 2026–2027 before potential monetization of AI services restores margin power. For SaaS companies — even those not building their own models — the investment required to integrate AI features (GPU procurement, data pipeline infrastructure, model tuning compute, vector database hosting) can depress FCF margins by 3–8 percentage points during the integration phase.
-
Inference cost as variable capex. Unlike traditional SaaS where infrastructure costs were largely fixed, AI inference creates a variable cost component that scales with usage. For companies building AI-intensive products, inference spend can be 10–20x the training budget, making it a material capex-equivalent line item. Companies that fail to architect for inference cost optimization face persistent FCF headwinds.
For PE diligence, the key question is: What is the target's AI capex profile, and does the investment case adequately model the FCF impact during the AI integration phase? Companies transitioning from traditional SaaS to AI-enhanced platforms may see 12–24 months of FCF compression before the operating leverage benefits (documented below) materialize.
The Operating Leverage Opportunity
Against this margin compression, AI creates substantial operating leverage through automation of previously labor-intensive functions. The key areas:
Sales and marketing automation. AI can enable salespeople to spend 40–70% more time actually selling versus administrative tasks. AI-powered lead scoring, content generation, and pipeline analysis reduce the cost of customer acquisition.
Support cost reduction. As documented in Section 4, AI can deflect 25–45% of support tickets and reduce per-ticket costs by 70–85% for routine inquiries. Generative AI can deflect 60–90% of customer support calls with higher satisfaction scores.
Development efficiency. R&D costs as a percentage of revenue decline as AI coding tools accelerate feature delivery. The implication: the same output with fewer developers, or more output with the same team.
G&A automation. Finance, HR, legal, and administrative functions benefit from AI-powered document processing, compliance monitoring, and workflow automation.
The Rule of 40 Becomes the Rule of 50 — or 70?
Vista Equity Partners' Robert F. Smith has made perhaps the most ambitious prediction about AI's impact on SaaS economics. He has argued the Rule of 40 becomes the Rule of 70: Vista coined the "Rule of 40" metric combining EBITDA margin and growth rate, but generative AI could enable companies to achieve much higher scores. Smith's thesis is that incumbents positioned correctly could see operating margins surge from 25% to 40% and beyond.
The argument has merit in specific contexts. For AI-enhanced systems of record — where the company is layering AI features onto an existing platform with strong data moats and high switching costs — the economics are compelling. AI reduces R&D, support, and sales costs while the underlying platform maintains its traditional 80%+ gross margins. The AI features are deployed judiciously (not on every inference), and any compute-intensive features are monetized through premium pricing tiers or usage-based add-ons.
But the Rule of 70 thesis breaks down for AI-native tools that compete on AI features alone. Here, gross margins start at 50–60% (not 80%+), and price competition from other AI-native entrants erodes pricing power. The operating leverage from automation helps, but it cannot overcome the fundamental gross margin disadvantage if the product is a commodity.
As of Q1 2025, the median Rule of 40 score across tracked SaaS companies is approximately 12%, with a median growth rate of 10% and EBITDA margins of just 6%. Only a handful of high performers, such as Doximity (55%), Klaviyo (25%), and MeridianLink (36%), are comfortably above the 40% threshold. Private SaaS companies above $100M ARR are investing 33% (median) of revenue in Sales and Marketing, exactly the same as public SaaS companies. This baseline makes even the Rule of 40 aspirational for most SaaS companies, let alone the Rule of 50 or 70. Achieving Vista's vision requires:
- Deep proprietary data that justifies premium pricing
- Effective AI monetization through hybrid pricing models
- Disciplined AI compute cost management
- Aggressive automation of operating expenses
- Strong net revenue retention above 115%
The Category-Dependent Net Effect
The central insight of this chapter — and the bridge to the risk spectrum in Chapter 3 — is that the net impact of AI on SaaS economics varies dramatically by category. The following matrix summarizes the expected impact across the P&L:
| P&L Line Item | Traditional SaaS (Pre-AI) | AI-Enhanced System of Record | AI-Native / Feature-Centric SaaS | Key Drivers |
|---|---|---|---|---|
| Revenue per Customer | $20K–$100K ACV | $25K–$130K ACV (+10–30%) | $10K–$50K ACV (price pressure) | AI pricing uplift for systems of record; price deflation for commoditized tools |
| Gross Margin | 78–85% | Base: 72–78% / Bull: 75–80% / Bear: 65–72% | Base: 55–65% / Bull: 60–70% / Bear: 40–55% | Inference costs drag AI-native margins; systems of record preserve margins through selective AI deployment. Bear case reflects unoptimized inference or frontier model dependency. |
| R&D (% of Revenue) | 25–35% | Base: 18–25% / Bull: 15–20% / Bear: 22–28% | Base: 30–40% / Bull: 25–35% / Bear: 35–45% | AI coding tools reduce incumbent R&D; AI-native companies invest heavily in model development. Bear case assumes limited AI coding productivity gains per METR study findings. |
| Sales & Marketing (% of Revenue) | 35–50% | Base: 25–40% / Bull: 22–35% / Bear: 30–42% | 30–45% | AI automates lead scoring, content generation, and pipeline management for all categories |
| Customer Support (% of Revenue) | 8–15% | Base: 4–8% / Bull: 3–6% / Bear: 6–10% | 6–10% | AI support automation reduces Tier 1 costs 40–60%; new AI governance costs partially offset |
| G&A (% of Revenue) | 8–12% | 6–10% | 8–12% | AI automates admin, finance, and compliance functions |
| Professional Services (% of Revenue) | 15–25% | Base: 10–18% / Bull: 8–14% / Bear: 12–20% | 5–10% | Faster implementation offset by new AI deployment services; AI-native has less services revenue |
| EBITDA Margin | 5–15% | Base: 18–30% / Bull: 25–35% / Bear: 10–20% | Base: (-5%)–15% / Bull: 5–20% / Bear: (-15%)–5% | Systems of record see 500–1500 bps margin expansion; AI-native faces persistent margin pressure. Bear case reflects uncontrolled inference costs. |
| Free Cash Flow Margin | 8–18% | Base: 12–25% / Bull: 18–28% / Bear: 5–15% | Base: (-15%)–8% / Bull: (-5%)–12% / Bear: (-25%)–0% | AI infrastructure capex (GPU, data pipelines, vector DBs) depresses FCF for AI-native; AI-augmented sees temporary compression then recovery. Bear reflects heavy capex phase. |
| Rule of 40 Score | 20–30 (median) | Base: 35–55 / Bull: 45–65 / Bear: 25–40 | Base: 15–35 / Bull: 25–45 / Bear: 5–20 | Category leaders can approach Rule of 50; AI-native depends on growth compensating lower margins |
Note: All figures represent ranges for illustrative purposes. "Bull" assumes optimized AI deployment, strong pricing power, and rapid inference cost declines. "Bear" assumes uncontrolled inference costs, limited AI productivity gains, and competitive price pressure. Actual figures vary significantly by company size, growth stage, vertical, and execution quality. Sources: Benchmarkit 2025 SaaS Performance Metrics; Bessemer Venture Partners State of AI 2025; SaaS CFO; Valere AI; Monetizely Economics of AI-First B2B SaaS; author analysis.
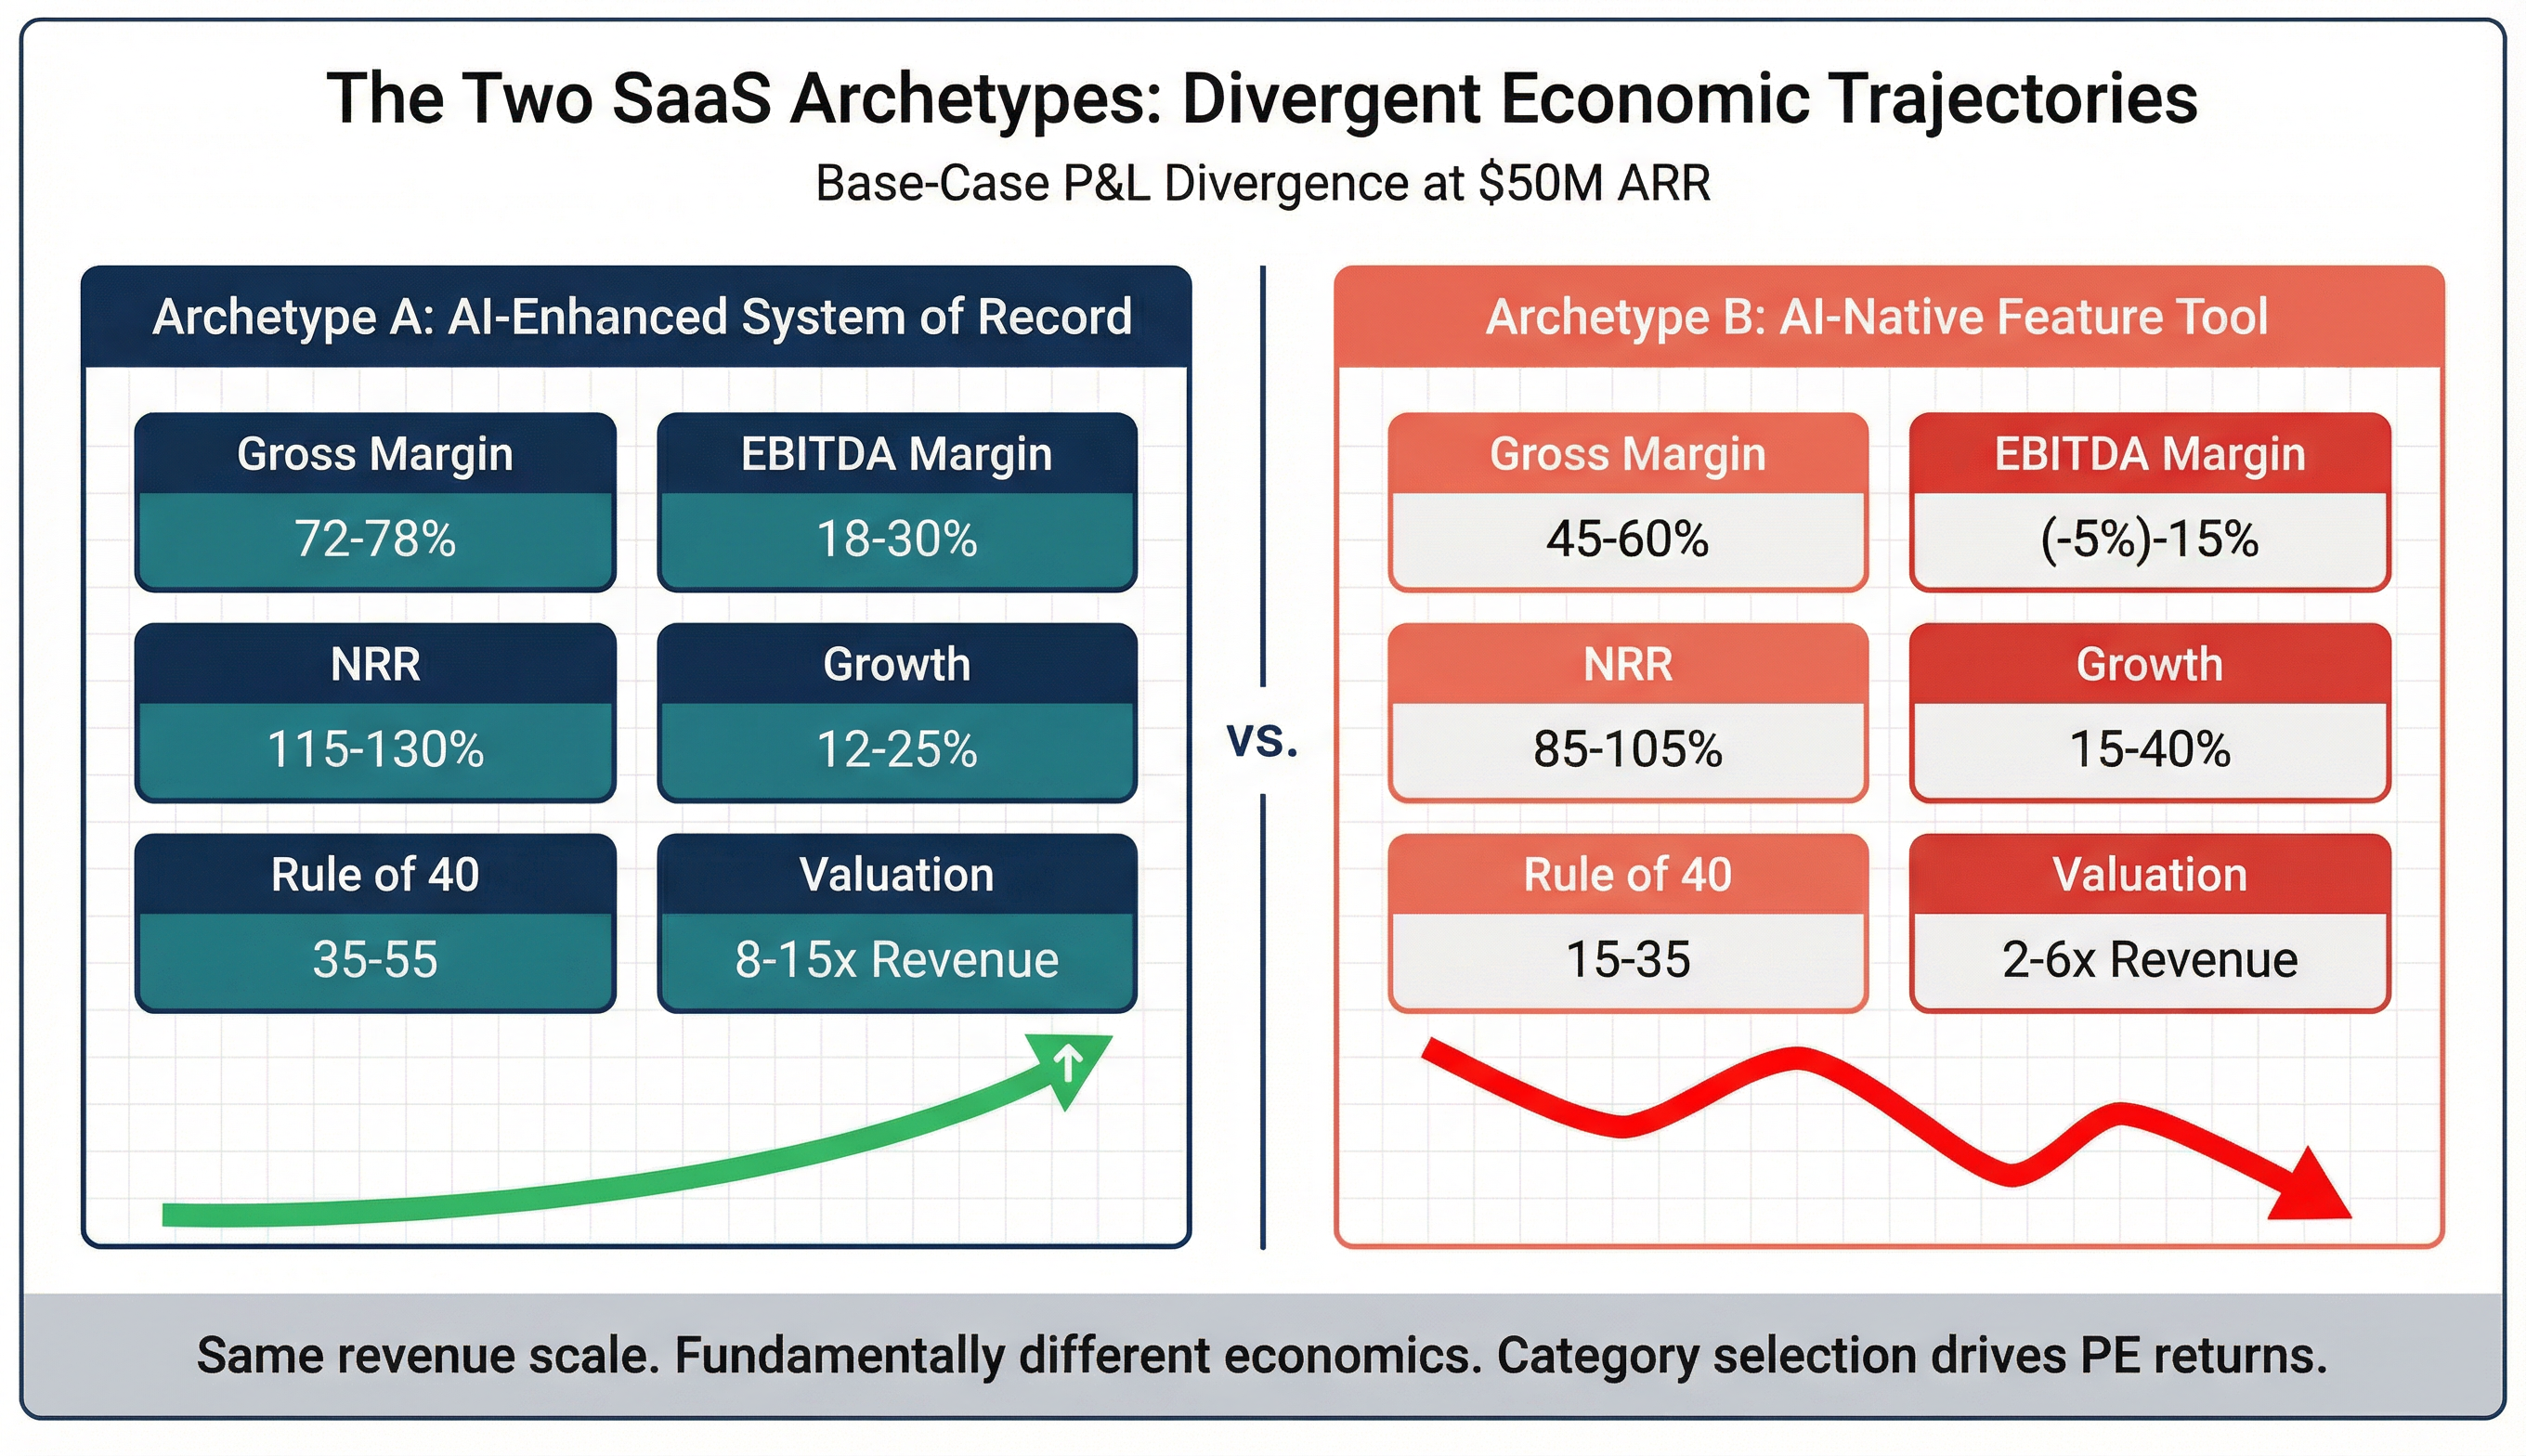
The Two SaaS Archetypes: Divergent Economic Futures — A Quantitative Illustration
The data in this chapter reveals two fundamentally different economic trajectories emerging within the SaaS landscape. To make these concrete, the following presents a simplified base-case P&L model for each archetype using a hypothetical $50M ARR SaaS company, applying the average benchmarks documented throughout this chapter.
Exhibit: Base-Case P&L Comparison — Archetype A vs. Archetype B ($50M ARR)
| P&L Line Item | Archetype A: AI-Enhanced System of Record | Archetype B: AI-Native Feature Tool |
|---|---|---|
| Revenue | $56.5M (+13% AI pricing uplift) | $47.5M (-5% price pressure) |
| COGS (incl. AI inference) | $14.7M (GM: 74%) | $19.0M (GM: 60%) |
| Gross Profit | $41.8M | $28.5M |
| R&D | $11.3M (20% of rev) | $17.1M (36% of rev) |
| Sales & Marketing | $18.1M (32% of rev) | $17.1M (36% of rev) |
| Customer Support | $3.4M (6% of rev) | $3.8M (8% of rev) |
| G&A | $4.5M (8% of rev) | $4.8M (10% of rev) |
| Professional Services (net) | $2.3M (4% of rev, net cost) | $1.0M (2% of rev, net cost) |
| EBITDA | $14.5M (26% margin) | ($1.3M) (-3% margin) |
| AI Inference Costs (within COGS) | $2.8M (5% of rev) | $9.5M (20% of rev) |
| Estimated FCF Margin | 18–22% (mature infra) | (-8%)–2% (capex-heavy build phase) |
| Rule of 40 Score | 41 (15% growth + 26% margin) | 37 (40% growth + (-3%) margin) |
| EV/Revenue Multiple (indicative) | 8–12x | 4–7x |
| Implied Enterprise Value Range | $452M–$678M | $190M–$333M |
Assumptions: Archetype A has 80% pre-AI gross margin, layers selective AI features, uses hybrid pricing (base sub + usage). Archetype B has 60% AI-heavy gross margin, competes on AI features, uses consumption-based pricing. Both assume median SaaS benchmarks for opex categories. Author modeled.
Archetype A: AI-Enhanced System of Record. An established SaaS platform with deep data moats, regulatory compliance, and high switching costs layers AI features onto its existing product. Gross margins compress modestly (5–10 points, from 82% to 72–77%) as selective AI features introduce compute costs. But operating expenses decline dramatically as AI automates support (saving 4–8 points), accelerates R&D (saving 5–10 points), and improves sales efficiency (saving 5–10 points). The net effect: EBITDA margins expand by 500–1,500 basis points. The pricing model evolves to hybrid (base subscription + usage-based AI components), potentially expanding ARPA by 10–30%. This archetype validates Vista's Rule of 50+ thesis.
Archetype B: AI-Native Feature-Centric Tool. A new SaaS entrant competing primarily on AI-powered features faces structurally different economics. Gross margins start at 50–65% due to inference costs. A 2025 industry report found 92% of AI software companies now use mixed pricing models — combining subscriptions with usage fees — precisely to tackle the margin issue. Operating leverage from AI automation helps, but the company must spend heavily on R&D to maintain feature parity in a rapidly commoditizing market. Price competition from other AI-native entrants erodes pricing power. The net effect: narrow or negative EBITDA margins during growth phase, with a target of 60–70% gross margins at scale. AI-native firms may never routinely hit 85–90% like the leanest traditional SaaS, but settling in the 60–70% range at scale is a reasonable goal — essentially, closer to a cloud services company than to a legacy software company.
For PE investors, this divergence is the most important finding of this chapter. The implied enterprise value difference between these archetypes — potentially 2–3x at the same revenue scale — illustrates why the blanket "AI kills SaaS" narrative is as wrong as the blanket "SaaS is safe" narrative. The same AI wave that compresses valuations for Archetype B can expand them for Archetype A — if the company executes effectively on AI integration while protecting its existing moats. This category-dependent reality is precisely what the risk spectrum in Chapter 3 will formalize.
The Hidden Cost: AI Compute Opacity
A final point that PE firms must internalize: AI costs are often poorly tracked, inadequately classified, and systematically underestimated. Vendors lure customers with generous pilot credits, yet scaling to production routinely reveals 500–1,000% cost underestimation. For portfolio company diligence, this means:
- AI compute costs may be buried in engineering budgets rather than properly allocated to COGS.
- Inference costs scale non-linearly with user adoption, creating margin surprises as AI feature usage grows.
- Only an estimated 15% of companies can forecast their AI spend within a ±10% range. Approximately 24% of leaders miss their AI cost forecasts by over 50%.
PE acquirers must demand granular AI cost attribution during diligence. The difference between a target reporting 80% gross margins and the same target reporting 65% gross margins after proper AI cost allocation can represent hundreds of millions of dollars in enterprise value.
Chapter Synthesis: What PE Must Model Differently
The economics documented in this chapter require PE investors to update their SaaS financial models in five specific ways:
-
Gross margin is no longer a fixed assumption. The traditional assumption of 80%+ gross margins must be stress-tested against AI inference costs. Model three scenarios as shown in the mandatory table: pre-AI baseline, AI-enhanced (selective deployment, 70–80% margins), and AI-intensive (heavy compute, 55–70% margins). Use the token-cost benchmarks in Section 1 to build bottom-up inference cost models tied to projected user adoption curves.
-
R&D efficiency gains are real but execution-dependent. AI coding tools can reduce R&D headcount or accelerate output. The METR study found that experienced developers using AI tools took 19% longer — a snapshot of early-2025 AI capabilities that highlights the gap between vendor claims and real-world outcomes. The gains flow to companies that manage technical debt, security vulnerabilities (AI-generated code introduced risky security flaws in 45% of tests per Veracode), and AI code quality — not to those that simply replace developers with AI outputs.
-
Support cost savings are the most immediately realizable AI benefit. With AI resolution rates of 50–70% and per-resolution costs of approximately $1 versus $6+ per human interaction, support automation delivers concrete, measurable P&L improvement within 6–12 months of deployment. The token-cost analysis in Section 4 demonstrates that inference costs for support chatbots are negligible relative to human labor savings.
-
Professional services revenue transforms rather than disappears. The AI services segment is anticipated to exhibit the highest CAGR, driven by the increasing adoption of AI-driven consulting, integration, and support services as businesses seek to optimize AI implementation. New AI-specific implementation work (model tuning, data pipelines, governance) partially offsets the compression of traditional implementation services. The mix shifts toward higher-value, higher-margin advisory work.
-
The pricing model and capex profile are now first-order risk factors. Gartner forecasts 40% of enterprise SaaS will include outcome-based elements by 2026. Any target generating 100% of revenue from per-seat pricing carries significant unpriced transition risk. Simultaneously, the direct mechanical effect of AI capex acceleration is a temporary compression of free cash flow that must be explicitly modeled in the investment case, particularly for companies transitioning from traditional to AI-enhanced models.
Chapter 3: The SaaS Risk Spectrum: Segmenting AI Exposure
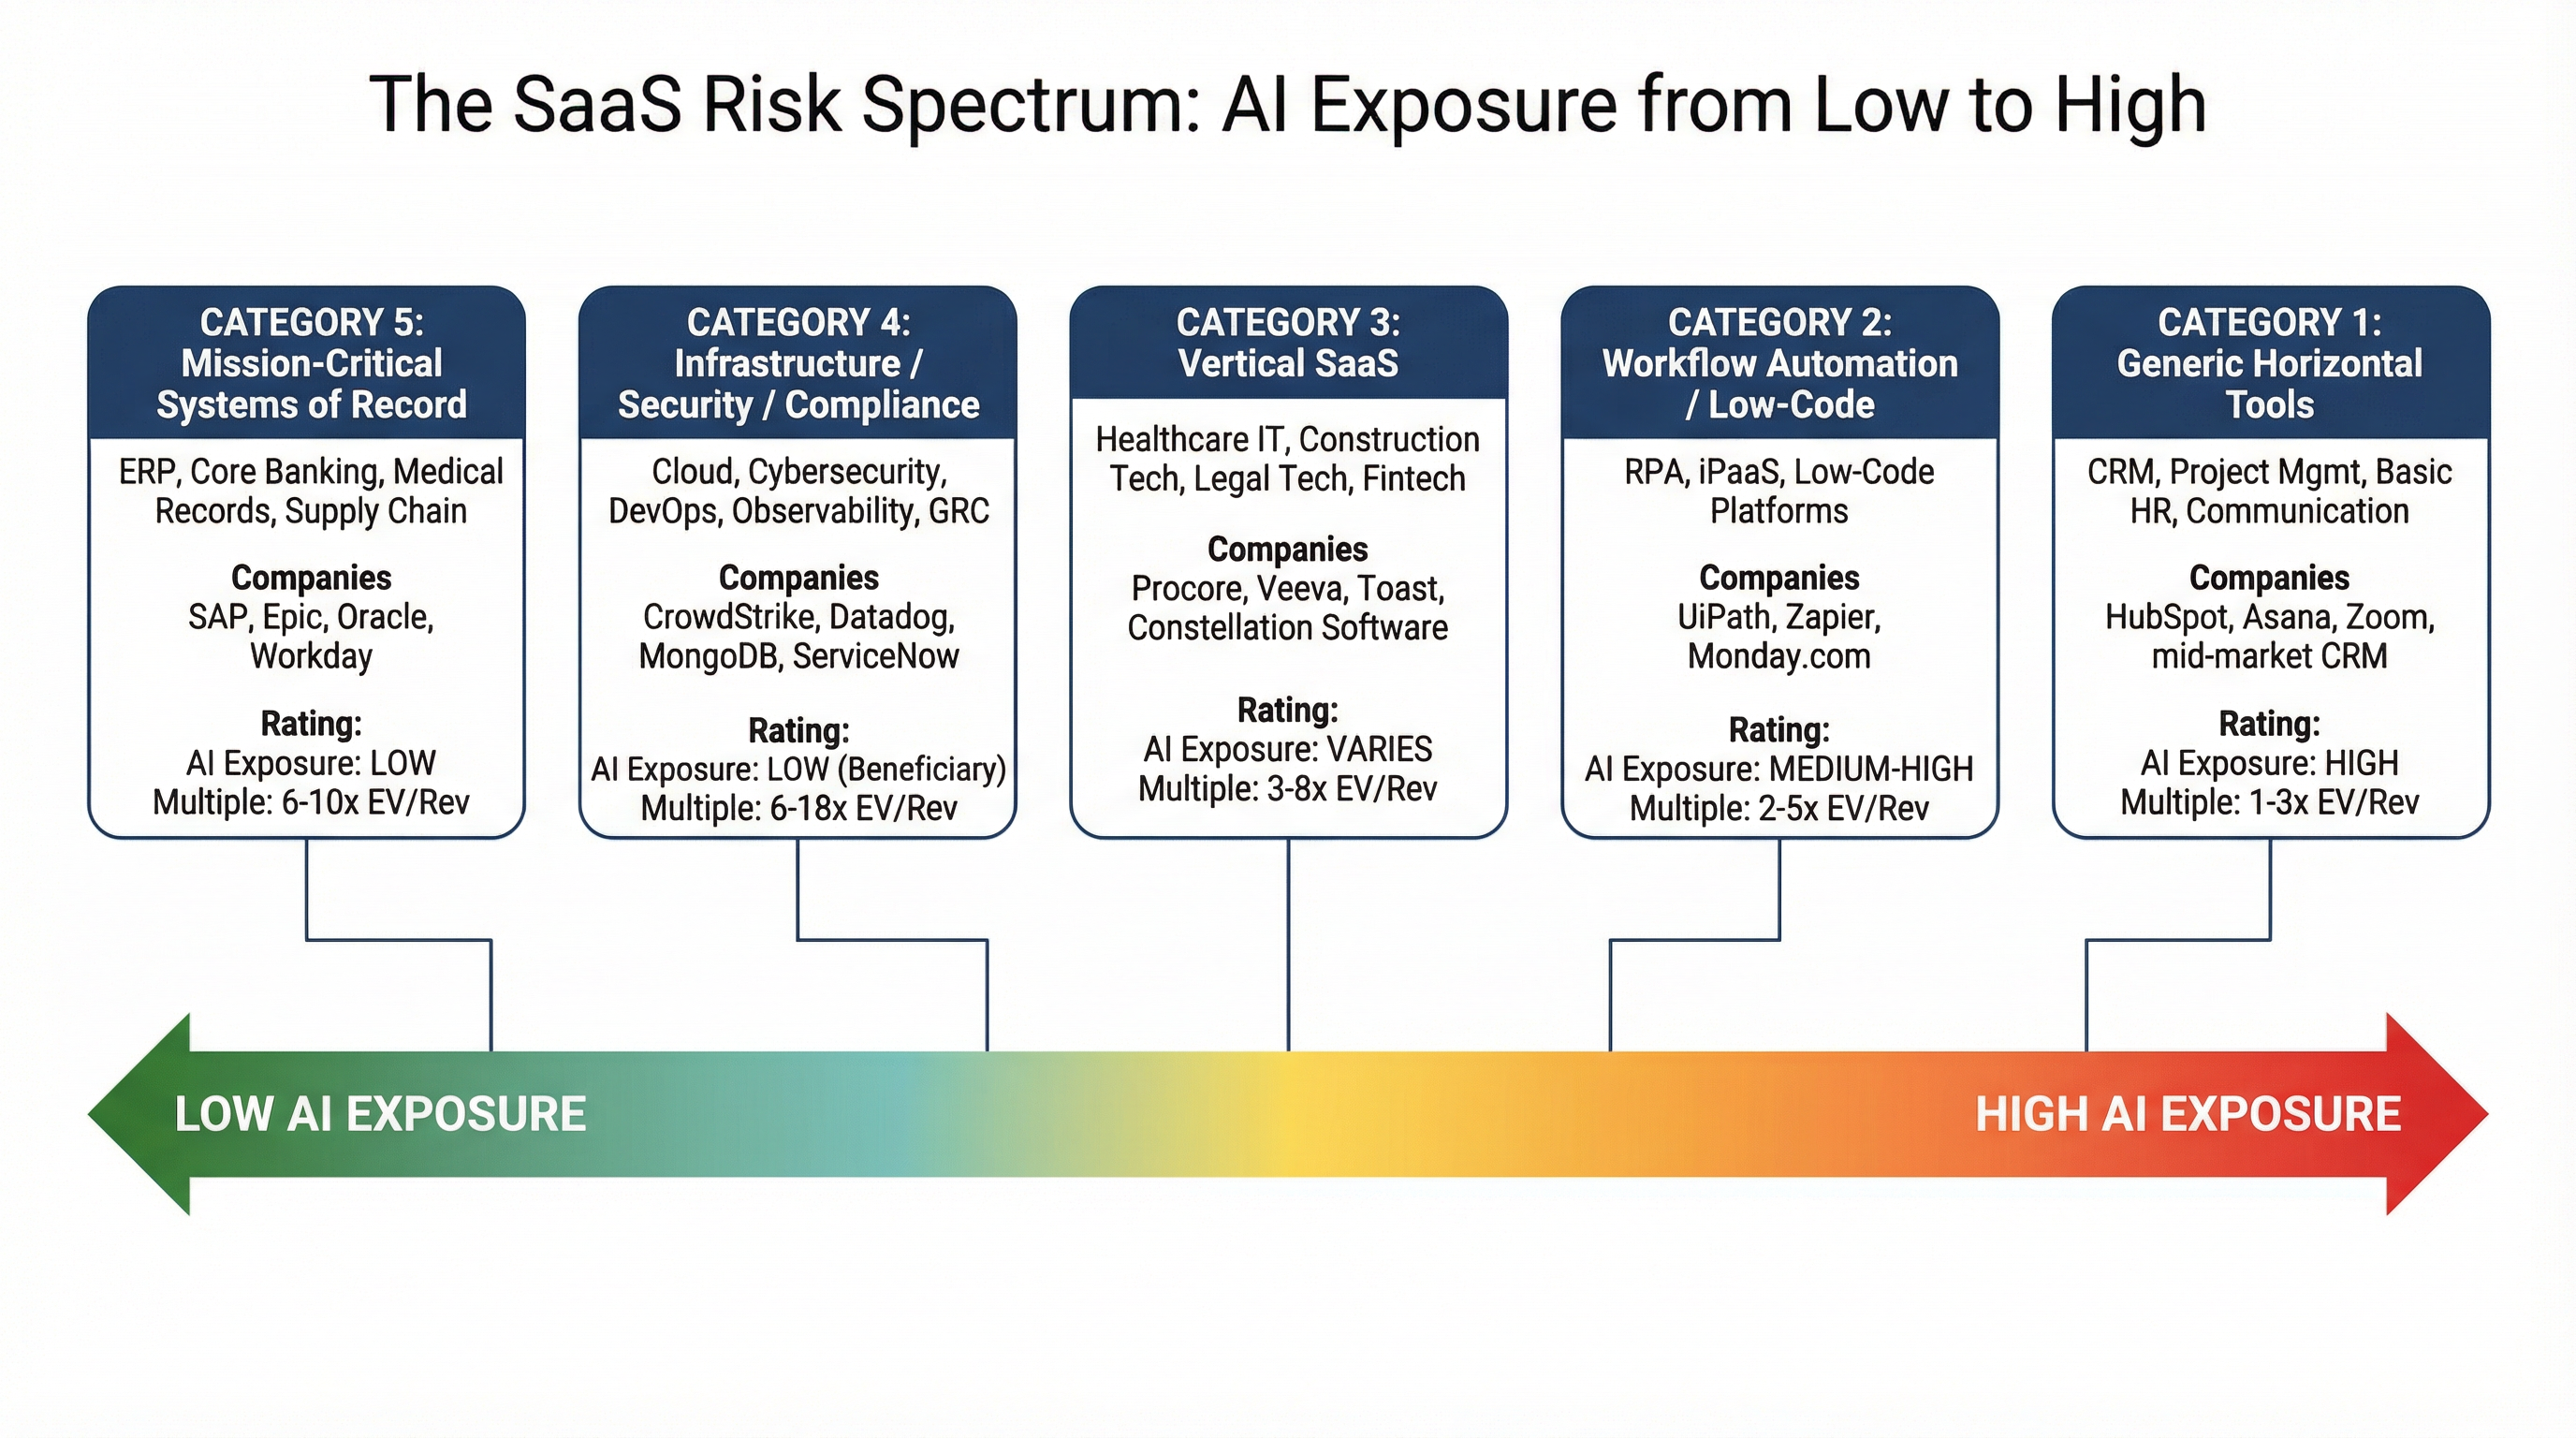
The previous chapters established two foundational findings. Chapter 1 documented the $2 trillion cumulative market-cap wipeout from the SaaS sector's peak and the historically wide valuation dispersion now visible across subsectors — from infrastructure software at 6.2x NTM revenue to sales/marketing automation at 1.9x and adtech at 1.1x. Chapter 2 provided the line-item economics: AI simultaneously compresses gross margins through inference costs while creating operating leverage through automation, producing two divergent P&L archetypes — the AI-enhanced system of record (projected EBITDA margins of 18–30%) and the AI-native feature tool (projected margins of negative 5% to 15%).
This chapter bridges valuation data and economic mechanics into the report's central analytical contribution: a five-category risk spectrum that segments the SaaS landscape by AI exposure, pricing pressure, and subscription model sustainability. The framework is designed not as a generic "some categories are more exposed" observation, but as an operationally actionable tool that PE investors can apply during diligence to classify targets, calibrate entry pricing, and set hold-period expectations.
As Deloitte's software and platforms leader Ayo Odusote emphasized, "It's important to avoid overgeneralizing 'SaaS.' Dev tools, cybersecurity, productivity platforms, and industry-specific systems will not all move at the same pace." Buyers should avoid one-size-fits-all assumptions about disruption. This chapter provides the segmentation necessary to avoid precisely that error.
The Framework: Five Categories, Five Distinct Risk Profiles
The SaaS Risk Spectrum classifies the software landscape along a single axis — exposure to AI-driven substitution, pricing compression, and business model disruption — ranging from LOW (net beneficiary of AI trends) to HIGH (facing existential or near-existential pressure). Within each category, we assess six dimensions: AI substitution risk, pricing pressure likelihood, subscription model sustainability, data moat strength, integration depth, and regulatory protection. The composite of these dimensions produces an overall PE attractiveness rating.
The five categories, from highest to lowest exposure, are:
- Generic Productivity & Horizontal Tools (HIGH exposure)
- Workflow Automation / Low-Code / No-Code (MEDIUM-HIGH exposure)
- Vertical SaaS (VARIABLE — from HIGH to LOW depending on integration depth)
- Infrastructure / Security / Compliance Software (LOW exposure; potential beneficiary)
- Data-Intensive and Mission-Critical Systems (LOW exposure)
Each is examined in detail below.
Category 1: Generic Productivity & Horizontal Tools
Archetype Description
This category encompasses CRMs, project management platforms, basic HR tools, communication and collaboration suites, and general-purpose productivity applications sold horizontally across industries. These tools were the canonical SaaS success story of the 2010s: seat-based pricing, high net-dollar retention, and massive scale economies. Representative companies include mid-market CRMs (HubSpot, Pipedrive), project management tools (Asana, Monday.com, Basecamp), basic HR platforms (BambooHR, Gusto), and communication tools (Slack, Zoom). Salesforce sits in a unique liminal position — nominally horizontal, but with ecosystem depth that may partially insulate it, as discussed below.
Exposure Assessment
Generic horizontal SaaS is the most exposed category in the AI era. The evidence is multidimensional:
Valuation compression already reflects this risk. As documented in Chapter 1, horizontal SaaS trades at a median of 3.0x EV/NTM revenue versus 3.3x for vertical SaaS — and the more granular breakdown is even starker. Sales/marketing automation has compressed to just 1.9x, signaling maximum commoditization risk. HubSpot declined 39% year-to-date by early February 2026; Atlassian dropped 35%.
The barrier to building competitive alternatives has collapsed. As Chapter 2 established, vibe coding tools enable non-technical users to build functional applications in hours. AI agents now log interactions, update records, score leads, and generate pipeline reports automatically; the manual data entry that justified CRM seat licenses is the first workflow to be fully automated. AI agents can track, assign, and update tasks autonomously, and the entire workflow of creating tickets, assigning based on capacity, and following up on status is automatable without a dedicated UI.
AI agents directly substitute for the human workflows these tools support. Generic SaaS products, especially point solutions, with limited differentiation and heavy reliance on seat-based pricing likely face greater disruption risk. As Microsoft CEO Satya Nadella stated, business applications "are essentially CRUD databases with a bunch of business logic" — and in the agent era, "the business logic is all going to these agents."
Seat-based pricing is under direct assault. If AI agents can do the work of 100 sales reps, the customer doesn't need 100 Salesforce seats — they need 10. As Chapter 1 documented, this per-seat revenue compression creates a perverse innovation dilemma: the more effective a SaaS company's AI features become, the fewer human seats its customers need.
Pricing Pressure: HIGH
Horizontal tools face pricing pressure from three directions simultaneously: (a) AI-native competitors entering at lower price points with leaner cost structures, (b) enterprise customers building bespoke alternatives via vibe coding, and (c) existing usage declining as AI agents reduce the number of human users who need seats. Gartner forecasts that by 2030, at least 40% of enterprise SaaS spend will shift toward usage-, agent-, or outcome-based pricing. For horizontal tools that are 100% seat-based, this transition represents an existential repricing event.
Subscription Model Sustainability: SIGNIFICANT RISK
The traditional per-seat subscription model is the single greatest liability for this category. Companies that fail to transition to hybrid or usage-based models face revenue erosion that compounds quarterly as AI agents replace human seats. The transition itself is treacherous: usage-based revenue is inherently less predictable, potentially lowering the multiple the market assigns.
Example Companies and Recent Market Evidence
- HubSpot — Down 39% YTD by February 2026. Its inbound marketing methodology is replicable by AI agents.
- Monday.com — Project management workflows are among the most easily automated by AI agents.
- Asana — Stock declined significantly in the sell-off; task tracking is a commodity function.
- Zoom — Communication platform facing both saturation and AI-driven meeting reduction.
The Salesforce Exception: Salesforce occupies a unique position as the largest horizontal CRM that has invested heavily in agentic AI (Agentforce) and ecosystem lock-in (AppExchange, 150,000+ customers). Most companies must pick a lane: either become the neutral agent platform or supply the unique data that powers it. Only a few giants — Salesforce, for example — can realistically do both. However, even Salesforce is not immune: the company was down nearly 29% year-to-date by mid-February 2026, and quietly cut nearly 1,000 roles. The market is not yet convinced that Salesforce can reinvent its pricing model fast enough to offset seat compression.
What PE Buyers Should Look For
When evaluating targets in this category, PE buyers should ask:
- What percentage of revenue is per-seat? If >80%, price the transition risk into entry valuation. Model a 30–50% seat reduction scenario over three years.
- Does the platform control proprietary data? A CRM that merely stores customer records has no data moat. A CRM that generates unique customer insights through proprietary algorithms does.
- Can it become an agent platform? The few horizontal tools that survive will be those that become the "operating system" for AI agents — the infrastructure on which agents run, not the tasks they replace.
- What is the competitive threat from AI-native entrants? Map not just traditional competitors but AI-native disruptors — including the customer's own ability to build alternatives.
Category 2: Workflow Automation / Low-Code / No-Code
Archetype Description
This category includes robotic process automation (RPA) vendors (UiPath, Automation Anywhere), integration-platform-as-a-service (iPaaS) providers (MuleSoft, Workato), and low-code/no-code development platforms (OutSystems, Mendix, Microsoft Power Platform, Retool). These tools occupy a paradoxical position: they were designed to democratize software creation and automate workflows — the very capabilities that generative AI now delivers natively.
Exposure Assessment
The assessment for this category is split along a critical fault line: simple automation versus complex enterprise orchestration.
Simple automation faces existential pressure. Industry experts say no-code platforms are dying due to AI-powered "vibe coding." After years of drag-and-drop, no-code platforms democratizing app creation, generative AI is eliminating the need for no-code platforms in many cases. One industry expert declared: "No-code's on its last legs — it's being snuffed out by vibe coding. AI-driven development tools will be the final knell for no-code as we know it." Why use a visual drag-and-drop builder when you can describe what you want in natural language and have an AI generate the entire application?
Complex enterprise orchestration retains value — but is being redefined. With 70% of new apps using low-code/no-code by 2026 per Gartner, the technology has achieved strategic importance. The category is converging with automation and AI, which is why "platform" matters more than "builder." The economic engine behind low-code and no-code is not "developers can't code," but organizations can't afford to waste senior engineering time on internal glue work. Enterprise low-code platforms that handle governance, compliance, multi-system integration, and audit trails are harder to replace than simple app builders.
RPA faces the sharpest challenge. Traditional RPA — screen-scraping bots that mimic human clicks across applications — is being superseded by AI agents that can understand context, make decisions, and interact with APIs directly rather than through UI emulation. The core value proposition of RPA (automating manual, repetitive tasks) is exactly what large language models now do natively, often more flexibly and at lower cost.
Pricing Pressure: MEDIUM-HIGH
For simple automation and no-code builders: HIGH — pricing will compress rapidly as AI alternatives emerge. For enterprise iPaaS and governed low-code platforms: MEDIUM — these retain pricing power through integration complexity, compliance requirements, and multi-system orchestration that AI alone cannot replicate.
Subscription Model Sustainability: MODERATE RISK
Low-code platforms are already shifting to consumption-based models (usage per app, per workflow, per execution). The transition is less disruptive than for seat-based horizontal tools because the pricing model is already partially aligned with value delivered.
Example Companies and Recent Market Evidence
- UiPath — Trading at depressed multiples; RPA faces direct substitution from AI agents.
- Microsoft Power Platform — Benefits from Microsoft ecosystem integration; AI (Copilot) enhances rather than replaces the platform.
- OutSystems / Mendix — Enterprise low-code platforms with governance and compliance features retain stronger positioning.
- Workato / MuleSoft — iPaaS providers benefit from increasing integration complexity as enterprises deploy more AI tools.
What PE Buyers Should Look For
- Does the platform serve as enterprise-grade governance infrastructure? If yes, it has defensibility. If it's primarily a visual builder for simple applications, it faces rapid commoditization.
- Is the platform converging with AI orchestration? The winners in this space will be those that position as agent orchestration platforms — managing, governing, and controlling AI agents — rather than alternatives to AI.
- How deep is the integration layer? Companies that connect dozens of enterprise systems through complex, production-grade integrations have real switching costs.
Category 3: Vertical SaaS
Archetype Description
Vertical SaaS encompasses industry-specific software platforms: healthcare IT (Epic, Veeva, Athenahealth), construction technology (Procore, Autodesk Construction Cloud), legal technology (Clio, LegalZoom), fintech (nCino, Q2 Holdings), property management (Yardi, AppFolio), and hundreds of niche solutions serving specific industries. This is the category where the defensibility debate is most nuanced — and where the most analytical precision is required.
The Critical Insight: Depth of Integration Determines Everything
The single most important finding of our analysis is that vertical SaaS is not a single category — it is two distinct categories masquerading as one, split by the depth of workflow integration.
Surface-level vertical tools — basic scheduling apps for salons, simple billing systems for small law firms, lightweight inventory trackers for local retailers — are as exposed to AI disruption as any horizontal tool. They are features, not platforms. Startups that are thin wrappers may find themselves in a pickle in 2026 and will need to pivot, sell, or shut down. These tools can be replicated by vibe coding in hours, or absorbed into horizontal AI platforms that add industry-specific modules.
Deeply embedded vertical platforms — those that serve as the system of record for their industry, handle regulatory compliance, control physical-world workflows, and manage money flows — retain strong and potentially strengthening defensibility. As one venture capital analysis argued, "AI has turned data from a moat into a commodity. In vertical SaaS, real defensibility now comes from owning the workflow where the business actually runs."
The Procore Case Study: What a "System of Consequence" Looks Like
Procore evolved beyond merely tracking project progress — it became the platform for financial management, bidding, and creating the legally mandated audit trail for the project. If Procore goes down, work doesn't just get messy. Capital can't be deployed, and compliance is jeopardized. That is a "System of Consequence."
Procore operates as the construction industry's central operating system, providing a unified, cloud-based SaaS platform that connects all project stakeholders on one system of record. This platform streamlines the entire construction lifecycle, effectively eliminating the data silos that traditionally plague the industry. Its deep integration is why their gross revenue retention rate remains high at 95%. The company's revenue is based on a customer's annual construction volume, not per user, making the solution highly scalable. This volume-based pricing model — already decoupled from human seat count — makes Procore structurally insulated from the seat compression threat that devastates horizontal tools.
The Procore Helix intelligence layer, which uses proprietary construction data to automate tasks and surface insights, is its primary competitive moat against generic software solutions. This illustrates the archetype of a vertical platform that AI strengthens rather than threatens: proprietary data generated by 17,000+ customers over decades of construction projects, combined with an industry-specific AI engine, creates a defensibility layer that no horizontal AI model can replicate.
The Constellation Software Model: Evidence That "Boring" Vertical SaaS Compounds
Constellation Software is an acquirer, manager, and developer of vertical market software businesses globally. VMS differentiates from horizontal software in that it provides mission-critical solutions within a specific industry for customers in a particular market. The company had its IPO in 2006, and since then, early investors have seen their initial investments compound at a CAGR of almost 36% annually (dividends reinvested).
As of 2025, Constellation consisted of over 1,000 individual businesses and 64,000 employees. For the first nine months of 2025, total revenues were $8,446 million, an increase of 15% compared to $7,363 million for the comparable period in 2024. Fears that generative AI could disrupt Constellation's niche products have weighed on sentiment, but management addressed this with a balanced view, acknowledging both risks and opportunities, and reiterated that their acquisition underwriting already reflects technological change. This narrative of fear contrasts with fundamentals.
The Constellation model validates a core thesis of this report: deeply embedded, "boring," mission-critical vertical software with high switching costs and strong customer relationships is structurally resilient to AI disruption — and the current sell-off may present a generational buying opportunity for firms that understand this distinction.
The Vertical AI Threat: Foundation Models Entering Verticals
The counter-argument cannot be dismissed. In January 2026, both OpenAI and Anthropic announced HIPAA-compliant life sciences healthcare tools that directly compete against the Veevas of the world and the Salesforce life sciences offerings — "very specific examples of these AI-first companies directly competing with SaaS." SaaS companies now have new competition in the form of OpenAI and Anthropic.
This is a genuine threat — but its severity depends on depth. Foundation model companies can build impressive demos and even functional products for specific vertical tasks. What they cannot easily replicate is: (a) decades of regulatory compliance infrastructure, (b) integration with dozens of industry-specific systems, (c) customer-generated data that accrues over years, (d) physical-world operational control, and (e) the liability coverage and vendor accountability that enterprises require.
True defensibility in the AI era comes from something far more durable: deep workflow integration. As Euclid Ventures articulated, "The future of AI is specialized." The most valuable companies will be those that apply intelligence to real-world problems, integrating deeply into professional workflows, handling unstructured data, and delivering measurable outcomes.
Exposure Assessment (Bifurcated)
- Surface-level vertical tools: HIGH exposure. Basic scheduling, billing, and lightweight workflow tools are as commoditizable as horizontal SaaS.
- Deeply embedded vertical platforms (systems of record/consequence): LOW-MEDIUM exposure. Regulatory compliance, physical-world integration, proprietary data flywheels, and industry-specific AI create strengthening moats.
Pricing Pressure
- Surface vertical: HIGH — AI alternatives will undercut.
- Deep vertical: LOW-MEDIUM — volume-based or outcome-based pricing models insulate against seat compression. Customers cannot easily replicate regulatory compliance and integration depth.
Subscription Model Sustainability
- Surface vertical: MODERATE RISK — seat-based models vulnerable; migration to usage-based necessary.
- Deep vertical: STRONG — subscription models tied to business volume, compliance, or transactions are structurally durable. Founders must transition to outcome-based pricing models, charging for the work done, not the seat.
What PE Buyers Should Look For
This is the most diligence-intensive category. The decisive questions are:
- Is the software a "System of Consequence" or merely a "System of Record"? Apply the Vendep framework from above: does the software control the flow of money, the flow of physical things, or the flow of compliance? If it controls none, it is a surface tool.
- How deep is the regulatory moat? Does the software generate legally mandated audit trails, compliance records, or regulatory filings? Can the customer operate without this software and still be in compliance?
- What proprietary data does the platform generate? Data that customers generate by using the product (construction project histories, patient treatment records, financial transaction patterns) is far more defensible than data the company collected and input.
- Does the company price by seat or by business volume? Volume-based, outcome-based, or transaction-based pricing models are structurally superior in the AI era.
- Can the company credibly deploy vertical AI? Vertical platforms that leverage their proprietary data to build industry-specific AI engines (like Procore Helix) can capture new TAM and justify premium pricing.
Category 4: Infrastructure / Security / Compliance Software
Archetype Description
This category encompasses cloud infrastructure management (Datadog, Dynatrace), cybersecurity platforms (CrowdStrike, Palo Alto Networks, Fortinet), DevOps and developer tools (JFrog, GitLab, HashiCorp), observability platforms (Splunk/Cisco, New Relic), and governance, risk, and compliance (GRC) software (ServiceNow GRC, Archer, OneTrust). These companies provide the foundational infrastructure that AI systems run on, the security that protects them, and the compliance frameworks that govern them.
Exposure Assessment: The AI Beneficiary
This category is not merely resilient to AI disruption — it is a direct beneficiary of AI adoption. The logic is structural:
More AI means more infrastructure. Every AI deployment requires compute, storage, networking, and monitoring. With analysts forecasting AI-related capital spending to exceed $500 billion in 2026, savvy allocators are positioning in private equity vehicles targeting this "super-cycle" of digital and physical infrastructure. Infrastructure software that monitors, manages, and optimizes these AI workloads sees demand grow proportionally.
More AI means more security risks. The global AI in cybersecurity market size is accounted at $29.64 billion in 2025 and predicted to increase to approximately $167.77 billion by 2035. Worldwide end-user spending on information security is projected to reach $213 billion in 2025, with spending estimated to increase 12.5% in 2026 to total $240 billion. Global spending on cybersecurity products and services is projected to exceed $520 billion annually by 2026, up from $260 billion in 2021. AI is expanding a $2 trillion total addressable market for cybersecurity providers, according to a 2024/2025 study by McKinsey.
More AI means more compliance requirements. As documented in Chapter 1, only 22% of enterprises prioritized AI governance policy in 2025. This governance gap is a massive opportunity for GRC software. The EU AI Act, evolving HIPAA requirements for AI in healthcare, and financial services AI oversight create regulatory demand that grows with AI adoption — not despite it. Microsoft's 2026 Data Security Index finds that while companies are rapidly deploying generative and agentic AI, data security controls and visibility are struggling to keep pace.
More AI-generated code means more DevOps demand. The rise of AI-generated code and use of coding agents has led to a surge in the volume of software binaries. JFrog's platform is positioned as foundational infrastructure to manage and secure this growing complexity. JFrog reported 25.5% year-on-year ARR growth, with net revenue retention at 119%.
Valuation Evidence
As Chapter 1 documented, infrastructure software commands the highest valuations across SaaS: 6.2x EV/NTM revenue for data infrastructure, with DevOps at 36.5x EV/EBITDA. These premiums reflect the market's assessment that these categories benefit from secular AI tailwinds.
Cisco expects its AI infrastructure business to generate roughly $3 billion in revenue in 2026. Microsoft in fiscal 2025 generated around $37 billion in cybersecurity revenue, representing about 14% of its total revenue.
Pricing Pressure: LOW
Enterprise customers cannot cut security or infrastructure budgets to save money — the consequences (breaches, outages, regulatory violations) are catastrophic. If anything, AI adoption creates upward pricing pressure as enterprises need more sophisticated tools to secure and manage AI workloads.
Subscription Model Sustainability: STRONG
Usage-based pricing models (common in infrastructure and observability) are structurally aligned with AI adoption: more AI workloads → more monitoring/security/compliance activity → more revenue. This creates a natural expansion dynamic without requiring seat growth.
Caveat: Infrastructure Commoditization at the Lower End
Not all infrastructure software is equally defensible. Commodity monitoring tools, basic log aggregation, and undifferentiated cloud management platforms face competition from open-source alternatives and from hyperscaler-native tooling. The premium accrues to platforms with deep integration, proprietary threat intelligence, or specialized capabilities (AI-specific security, autonomous incident response, multi-cloud governance).
Example Companies and Recent Market Evidence
- CrowdStrike — AI-native endpoint security; beneficiary of increasing attack surface.
- Palo Alto Networks — Consolidation platform for network security, cloud security, and AI security.
- Datadog — Usage-based observability; directly benefits from increasing AI workloads.
- JFrog — Software supply chain security, now positioned as critical infrastructure for AI-generated code management.
What PE Buyers Should Look For
- Is the company positioned in a growth vector of AI infrastructure? AI-specific security, agent governance, model monitoring, and AI supply chain management are the highest-growth vectors.
- Does the pricing model capture AI-driven usage expansion? Usage-based or consumption-based models that naturally expand with AI adoption are ideal.
- How defensible is the platform's threat intelligence or data moat? Security vendors with proprietary threat data and network effects (every endpoint adds intelligence) have strong moats.
- Is this a platform or a point solution? Platform consolidators (Palo Alto Networks, CrowdStrike) that provide integrated suites command premiums over single-function tools that face commoditization risk.
Category 5: Data-Intensive and Mission-Critical Systems
Archetype Description
This category includes enterprise resource planning (ERP: SAP, Oracle, Microsoft Dynamics), core banking systems (Temenos, FIS, Jack Henry), electronic medical records (Epic, Cerner/Oracle Health), supply chain management (Kinaxis, Blue Yonder), and other systems of record that serve as the foundational data infrastructure of large enterprises. These platforms store the customer histories, inventory logs, financial records, codebases, and operational data that both human workers and AI agents need to function.
Exposure Assessment: The Fortress
A subset of software providers, especially those running mission-critical enterprise workloads such as Oracle and ServiceNow, still have a sustained "right to earn." The depth of their data and entrenched role in customer workflows make them more likely to coexist with AI rather than be replaced outright.
Wedbush Securities argued that "enterprises won't completely overhaul tens of billions of dollars of prior software infrastructure investments to migrate over to Anthropic, OpenAI, and others." Large enterprises took decades to accumulate trillions of data points now ingrained in their software infrastructure.
The logic is compelling and multidimensional:
AI agents need these systems, not the other way around. When you look at how enterprises are actually deploying AI agents, they're not replacing their systems of record — they're building orchestration layers on top of them. An AI agent that can draft a customer email is useless unless it can access the customer's full transaction history, support ticket record, and account status — data that resides in the ERP or CRM system of record.
Switching costs are immense and structural. Replacing an SAP or Epic implementation is a multi-year, multi-hundred-million-dollar project that disrupts every business function simultaneously. As Chapter 1 quoted, this is "open-heart surgery for an enterprise." No AI tool reduces these switching costs.
Regulatory requirements create additional lock-in. Financial records, medical records, and compliance data must be stored, managed, and audited in systems that meet specific regulatory standards. AI does not eliminate these requirements — it adds new ones (AI governance, bias auditing, explainability requirements).
ERP is being enhanced, not replaced. For most enterprises, core ERP and CRM systems won't go away; they'll evolve with added agentic capabilities and, in many cases, "subsume smaller boundary systems because it becomes easier and cheaper to build that functionality into the core platform." Forrester predicts that half of enterprise ERP vendors will launch autonomous governance modules that combine explainable AI, automated audit trails, and real-time compliance monitoring.
ERP "didn't go anywhere but is being abstracted." The data layer remains; the interaction layer evolves from dashboards to conversational AI. For ERP users, AI eliminates the need for human intermediation in data analysis, pattern recognition, and metric definition. Rather than navigating predetermined dashboards, users will interact with business data through natural language queries.
The Deterministic vs. Probabilistic Framework
One of the most analytically useful frameworks for understanding this category's resilience comes from the distinction between deterministic and probabilistic systems. Deterministic systems are those where precision is critical, state management is complex, and errors cascade into serious consequences. As a former Microsoft manager put it, "LLMs lack the deterministic consistency required for critical industries like financial services. For use cases such as underwriting, a system that provides a correct answer 'six out of ten times' is insufficient."
ERP, core banking, and medical records are fundamentally deterministic systems — they must be correct 100% of the time. AI's probabilistic nature makes it a powerful enhancement layer (for analytics, predictions, and automation of routine tasks) but an inadequate substitute for the core transactional system. This is why enterprises are building orchestration layers on top of their systems of record, not replacing them.
Pricing Pressure: LOW
Mission-critical systems have strong pricing power because the cost of failure far exceeds the cost of the software. Vendors are increasingly bundling AI capabilities into premium tiers, creating upsell opportunities. Salesforce's Agentic Enterprise License Agreement (AELA) exemplifies this approach: "AELA is for customers that have already experimented. They're ready to scale. They want to go all in so we agree on a flat fee, and then it's a shared risk."
Subscription Model Sustainability: STRONG
These systems command long-term enterprise contracts (3–7 year terms), with high gross retention (often 95%+) and expansion revenue from new modules, AI add-ons, and increased user counts. The subscription model is not threatened — it is evolving to include AI-powered premium tiers that expand ARPA.
Example Companies and Recent Market Evidence
- SAP — Launching Joule AI agents integrated into ERP workflows; subscriptions growing despite sell-off.
- Oracle — Core database and ERP; cloud migration accelerating with AI features.
- Epic — Dominant in US hospital EMR; regulatory moat makes replacement essentially impossible.
- ServiceNow — Evolving from IT service management to enterprise AI orchestration platform.
What PE Buyers Should Look For
- Is the company the system of record for a critical business function? If removing the software would require the customer to fundamentally restructure their operations, the moat is strong.
- What is the contract structure? Long-term, multi-year enterprise agreements with high gross retention indicate structural durability.
- Is the company successfully layering AI on its existing platform? Companies that are building proprietary AI capabilities on top of their data assets — rather than simply integrating third-party models — command higher defensibility and pricing power.
- How deep is the regulatory moat? In healthcare, financial services, and government, compliance requirements create switching costs that transcend economic considerations.
The following matrix synthesizes the assessment across all five categories. Each dimension is rated on a 1–5 scale, where 1 = lowest risk/highest defensibility and 5 = highest risk/lowest defensibility. "Overall PE Attractiveness" inverts the scale: 1 = least attractive for PE investment, 5 = most attractive.
| SaaS Category | AI Substitution Risk | Pricing Pressure | Subscription Sustainability | Data Moat Strength | Integration Depth | Regulatory Protection | Overall PE Attractiveness |
|---|---|---|---|---|---|---|---|
| 1. Generic Productivity / Horizontal | 5.0 | 4.5 | 2.0 | 1.5 | 1.5 | 1.0 | 1.5 |
| 2. Workflow Automation / Low-Code | 3.5 | 3.5 | 3.0 | 2.0 | 3.0 | 1.5 | 2.5 |
| 3a. Vertical SaaS (Surface-Level) | 4.5 | 4.0 | 2.5 | 2.0 | 2.0 | 2.0 | 2.0 |
| 3b. Vertical SaaS (Deep/Embedded) | 2.0 | 2.0 | 4.5 | 4.5 | 4.5 | 4.0 | 4.5 |
| 4. Infrastructure / Security / Compliance | 1.0 | 1.5 | 4.5 | 3.5 | 3.5 | 3.5 | 5.0 |
| 5. Data-Intensive / Mission-Critical | 1.5 | 1.5 | 5.0 | 5.0 | 5.0 | 5.0 | 4.5 |
Ratings: AI Substitution Risk: 1=Low/beneficiary, 5=High/existential. Pricing Pressure: 1=Low, 5=High. Subscription Sustainability: 1=At significant risk, 5=Highly durable. Data Moat, Integration Depth, Regulatory Protection: 1=None/minimal, 5=Very strong. PE Attractiveness: 1=Avoid, 5=Strong buy at current valuations.
Note: Category 3 (Vertical SaaS) is split into 3a (Surface-Level) and 3b (Deep/Embedded) to reflect the dramatic variance documented above. PE diligence must distinguish between these sub-categories.
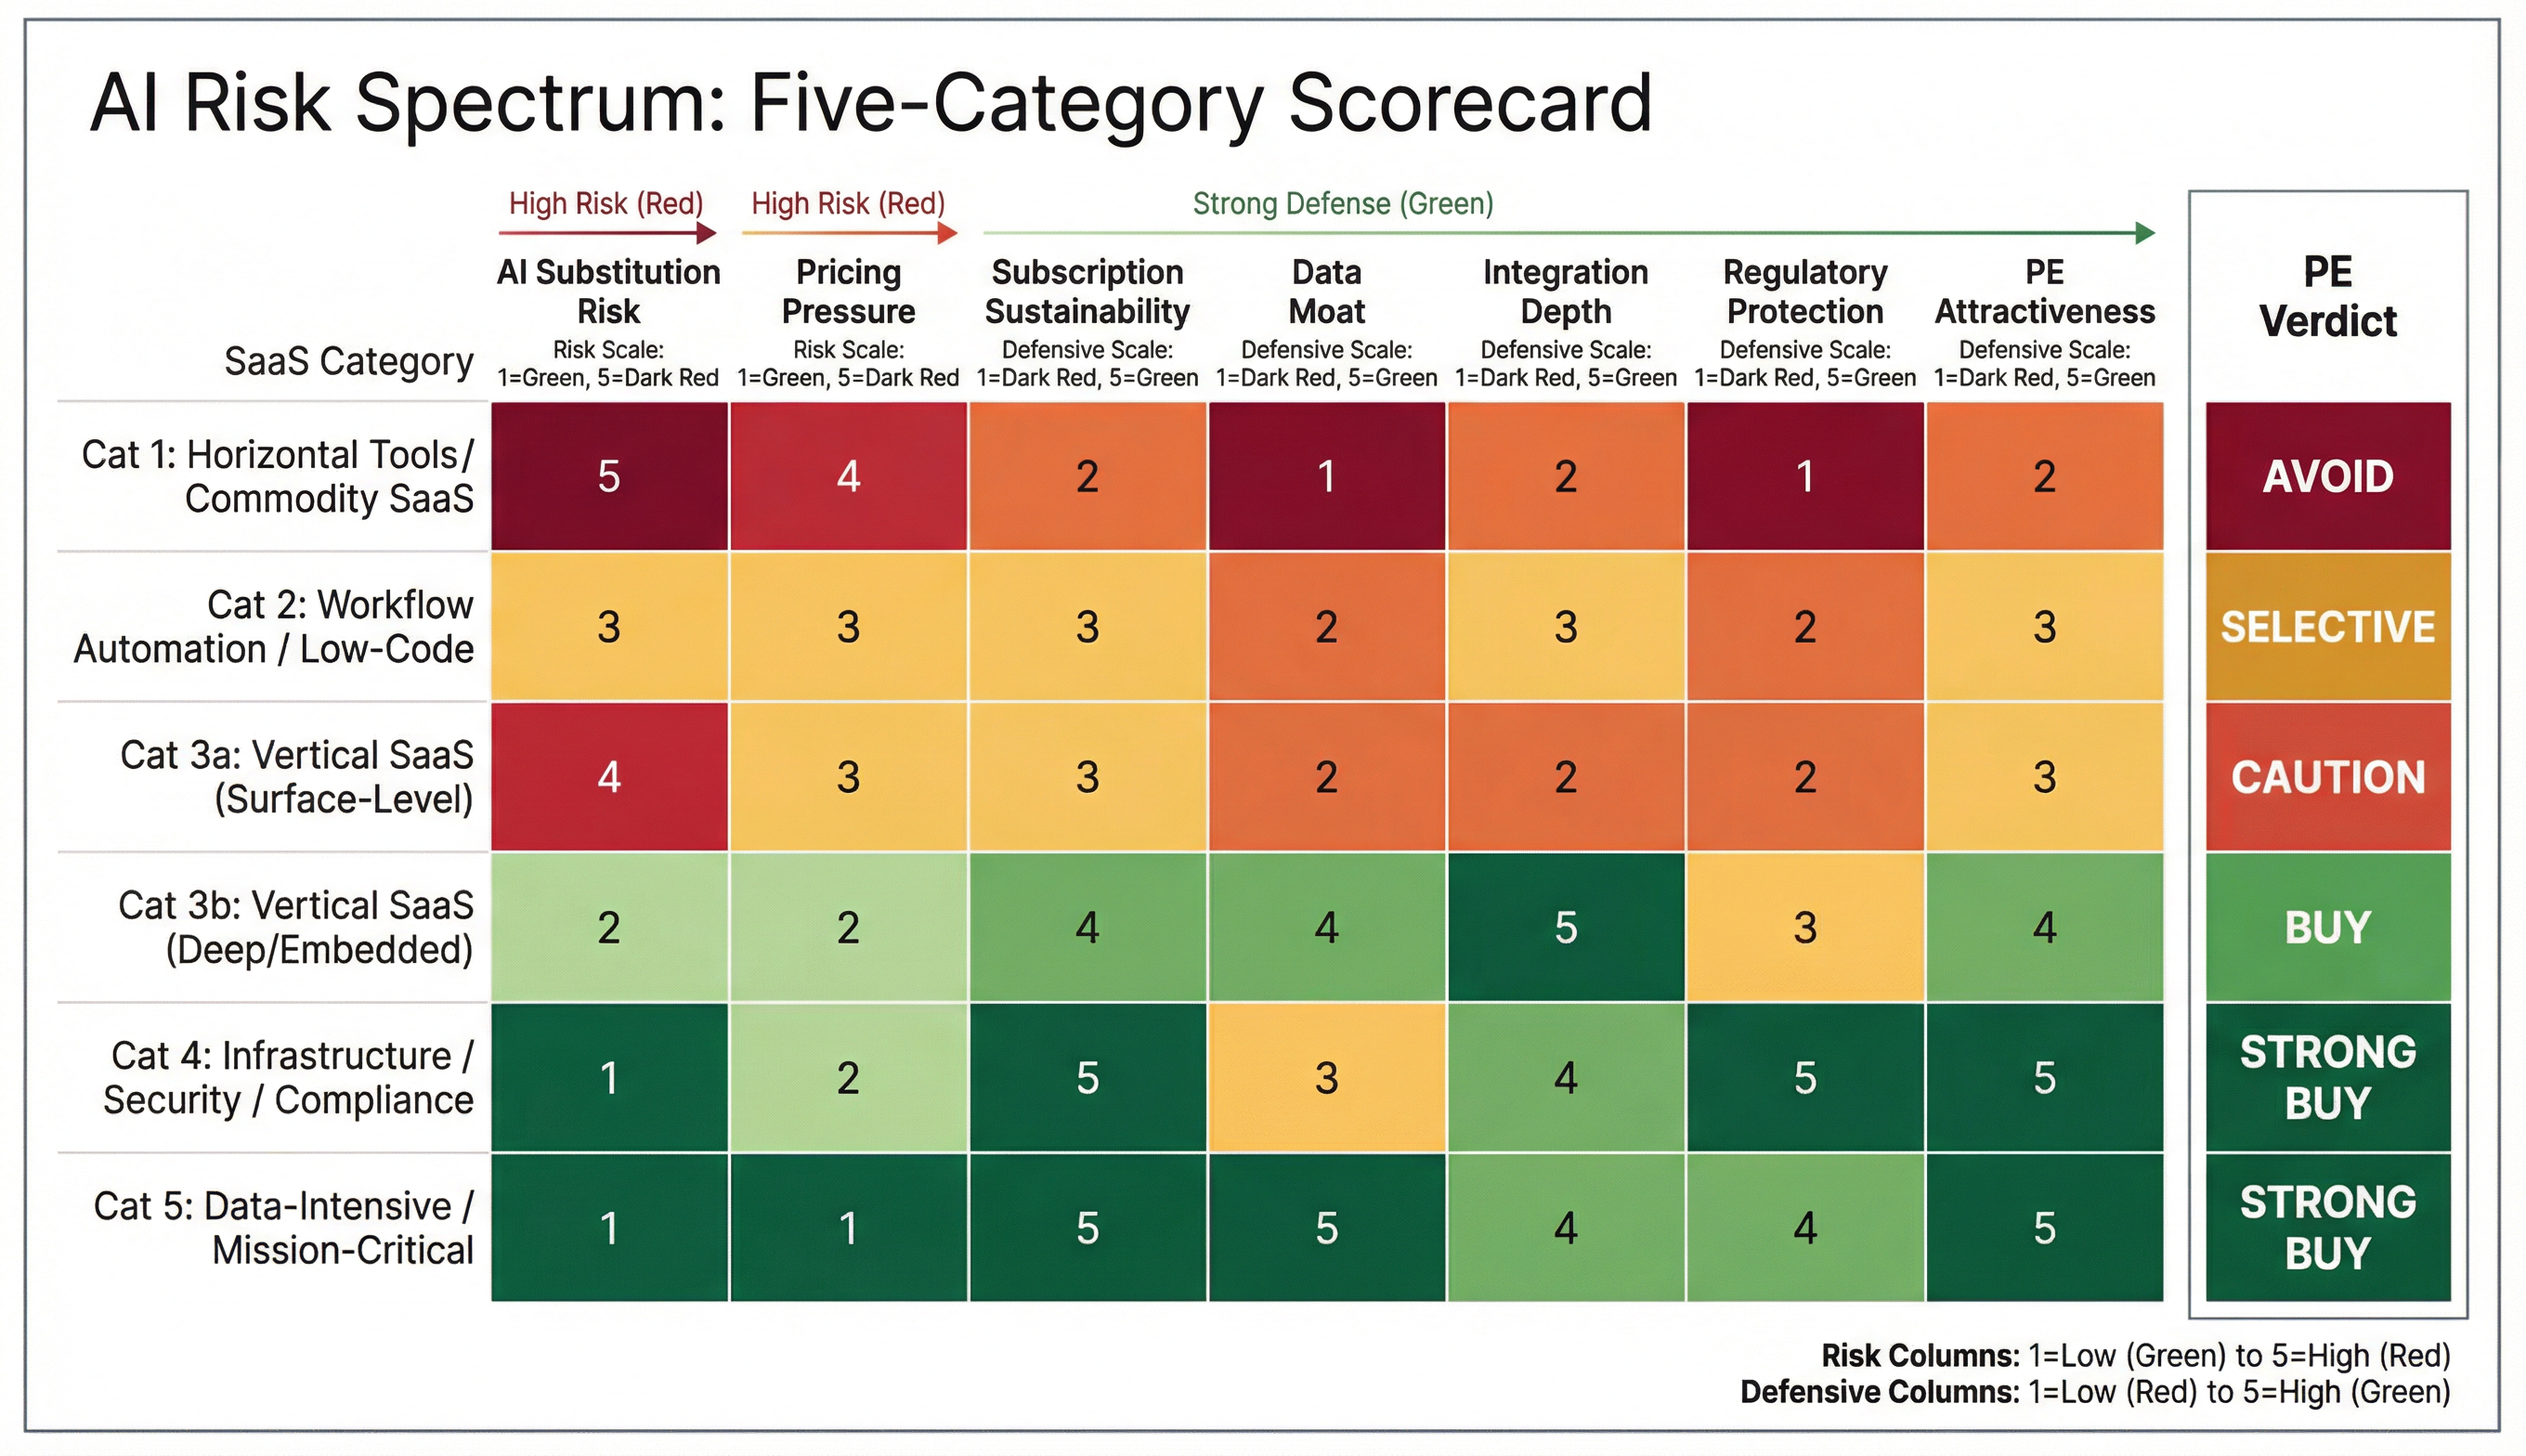
Cross-Category Dynamics: How the Risk Spectrum Interacts
The five categories do not exist in isolation — they interact in ways that amplify or mitigate risk:
The "subsumption" dynamic. Core ERP and CRM systems will, in many cases, "subsume smaller boundary systems because it becomes easier and cheaper to build that functionality into the core platform." This means that mission-critical systems (Category 5) will absorb functionality from horizontal tools (Category 1) and surface-level vertical tools (Category 3a), concentrating value in fewer, larger platforms. PE firms holding generic horizontal tools must model this consolidation risk.
The "agent platform" dynamic. Agentic AI is rebundling control on a three-layer stack: systems of record, agent operating systems, and outcome interfaces. Categories 4 and 5 are well-positioned to own the "systems of record" layer. Category 2 (workflow automation) will compete to own the "agent operating systems" layer. Categories 1 and 3a risk becoming the "outcome interfaces" — thin layers with minimal pricing power.
The security amplification dynamic. As Categories 1, 2, and 3 deploy more AI, they generate more security and compliance requirements that benefit Category 4. Every AI deployment creates new attack vectors, new governance needs, and new compliance obligations. The security sector's growth is therefore partially funded by the disruption happening to the other categories.
The "vertical AI" convergence. While traditional SaaS captures just 1–5% of an employee's value, Vertical AI can capture 25–50% by automating high-value, cognitive work. That expands the addressable market from a $450 billion software industry to an $11 trillion labor market. This expansion is the key reason deeply embedded vertical platforms (Category 3b) can increase their value in the AI era — they can capture labor budgets, not just software budgets. This is a fundamental TAM expansion that is unique to deep vertical platforms.
Implications for PE Portfolio Construction
The risk spectrum produces concrete portfolio implications that should inform both new investments and existing portfolio management:
What the Spectrum Means for New Investments
-
Category 5 and 4 represent the strongest buying opportunities in the current dislocation. The February 2026 sell-off was indiscriminate, but the disruption risk is not. Mission-critical systems and infrastructure/security software are being sold at multiples that do not reflect their structural advantages. PE firms with conviction should be deploying capital into these categories.
-
Category 3b (Deep Vertical SaaS) offers the highest alpha potential. The analytical complexity of distinguishing deep vertical platforms from surface tools creates information asymmetry — the precise condition that generates outsized PE returns. Firms that can accurately assess integration depth, regulatory moats, and proprietary data assets will find targets that the market is mispricing as "exposed SaaS."
-
Category 1 and 3a should be approached only at deep discounts for cash flow harvesting. If the asset generates strong free cash flow and is priced at 1–3x revenue, it may be attractive as a cash flow play — but the investment thesis cannot rely on multiple expansion at exit. Model for declining growth and potential fire-sale exit dynamics.
-
Category 2 requires surgical precision. Enterprise iPaaS and agent orchestration platforms may be undervalued; simple automation and no-code builders are overvalued. The distinction often comes down to customer composition (enterprise vs. SMB), pricing model (usage vs. seat), and governance capability.
What the Spectrum Means for Existing Portfolio Companies
For PE firms holding SaaS portfolio companies, the risk spectrum demands immediate re-classification:
- Classify every holding into one of the five categories. Use the matrix scoring from the mandatory table.
- For Category 1 and 3a holdings: Begin pricing model migration immediately. Model seat compression scenarios. Explore exit windows before further compression.
- For Category 3b holdings: Invest in deepening the moat — proprietary AI development, regulatory compliance expansion, and customer data flywheel acceleration.
- For Category 4 and 5 holdings: Invest aggressively in AI enhancement. These companies can capture AI-driven upsell revenue through premium tiers and outcome-based pricing.
Chapter Synthesis
This chapter has presented the report's central analytical framework: a five-category risk spectrum that segments the SaaS landscape by AI exposure and structural defensibility. The key findings are:
-
Generic horizontal tools (Category 1) face the highest AI exposure — seat-based pricing, feature commoditization, and direct substitution by AI agents create a perfect storm of value destruction.
-
Workflow automation and low-code (Category 2) face a paradoxical position: simple automation tools are being superseded by native AI capabilities, while enterprise orchestration platforms may evolve into the critical "agent operating system" layer.
-
Vertical SaaS (Category 3) is not one category — it is two, separated by integration depth. Surface-level vertical tools are as exposed as horizontal SaaS; deeply embedded vertical platforms are among the most defensible software businesses in existence.
-
Infrastructure, security, and compliance (Category 4) are direct beneficiaries of AI adoption — more AI means more infrastructure, more security risks, and more compliance requirements.
-
Mission-critical systems of record (Category 5) are the ultimate "fortress" — AI agents need these systems, not the other way around. Switching costs are immense, regulatory lock-in is strong, and AI enhances rather than replaces these platforms.
The valuation dispersion documented in Chapter 1 — from 36.5x EBITDA for DevOps to 1.1x revenue for AdTech — reflects the market's early-stage recognition of these category differences. But the dispersion has further to run, and the indiscriminate nature of the February 2026 sell-off has created mispricing within categories that creates the specific opportunity PE investors need.
The next chapter — "Moats in the AI Era: What Remains Defensible" — will shift from category-level risk assessment to mechanism-level defensibility analysis. Where this chapter identified which SaaS categories are exposed or protected, Chapter 4 will examine why — providing the five specific defensibility mechanisms (proprietary data, deep integration, regulatory lock-in, security and trust requirements, and ecosystem switching costs) that PE investors can use to assess individual targets. It will also introduce the critical "AI Wrapper vs. Structurally Defensible Software" decision tree — the operational tool PE deal teams can deploy during diligence to classify targets within the risk spectrum presented here.
Chapter 4: Moats in the AI Era: What Remains Defensible
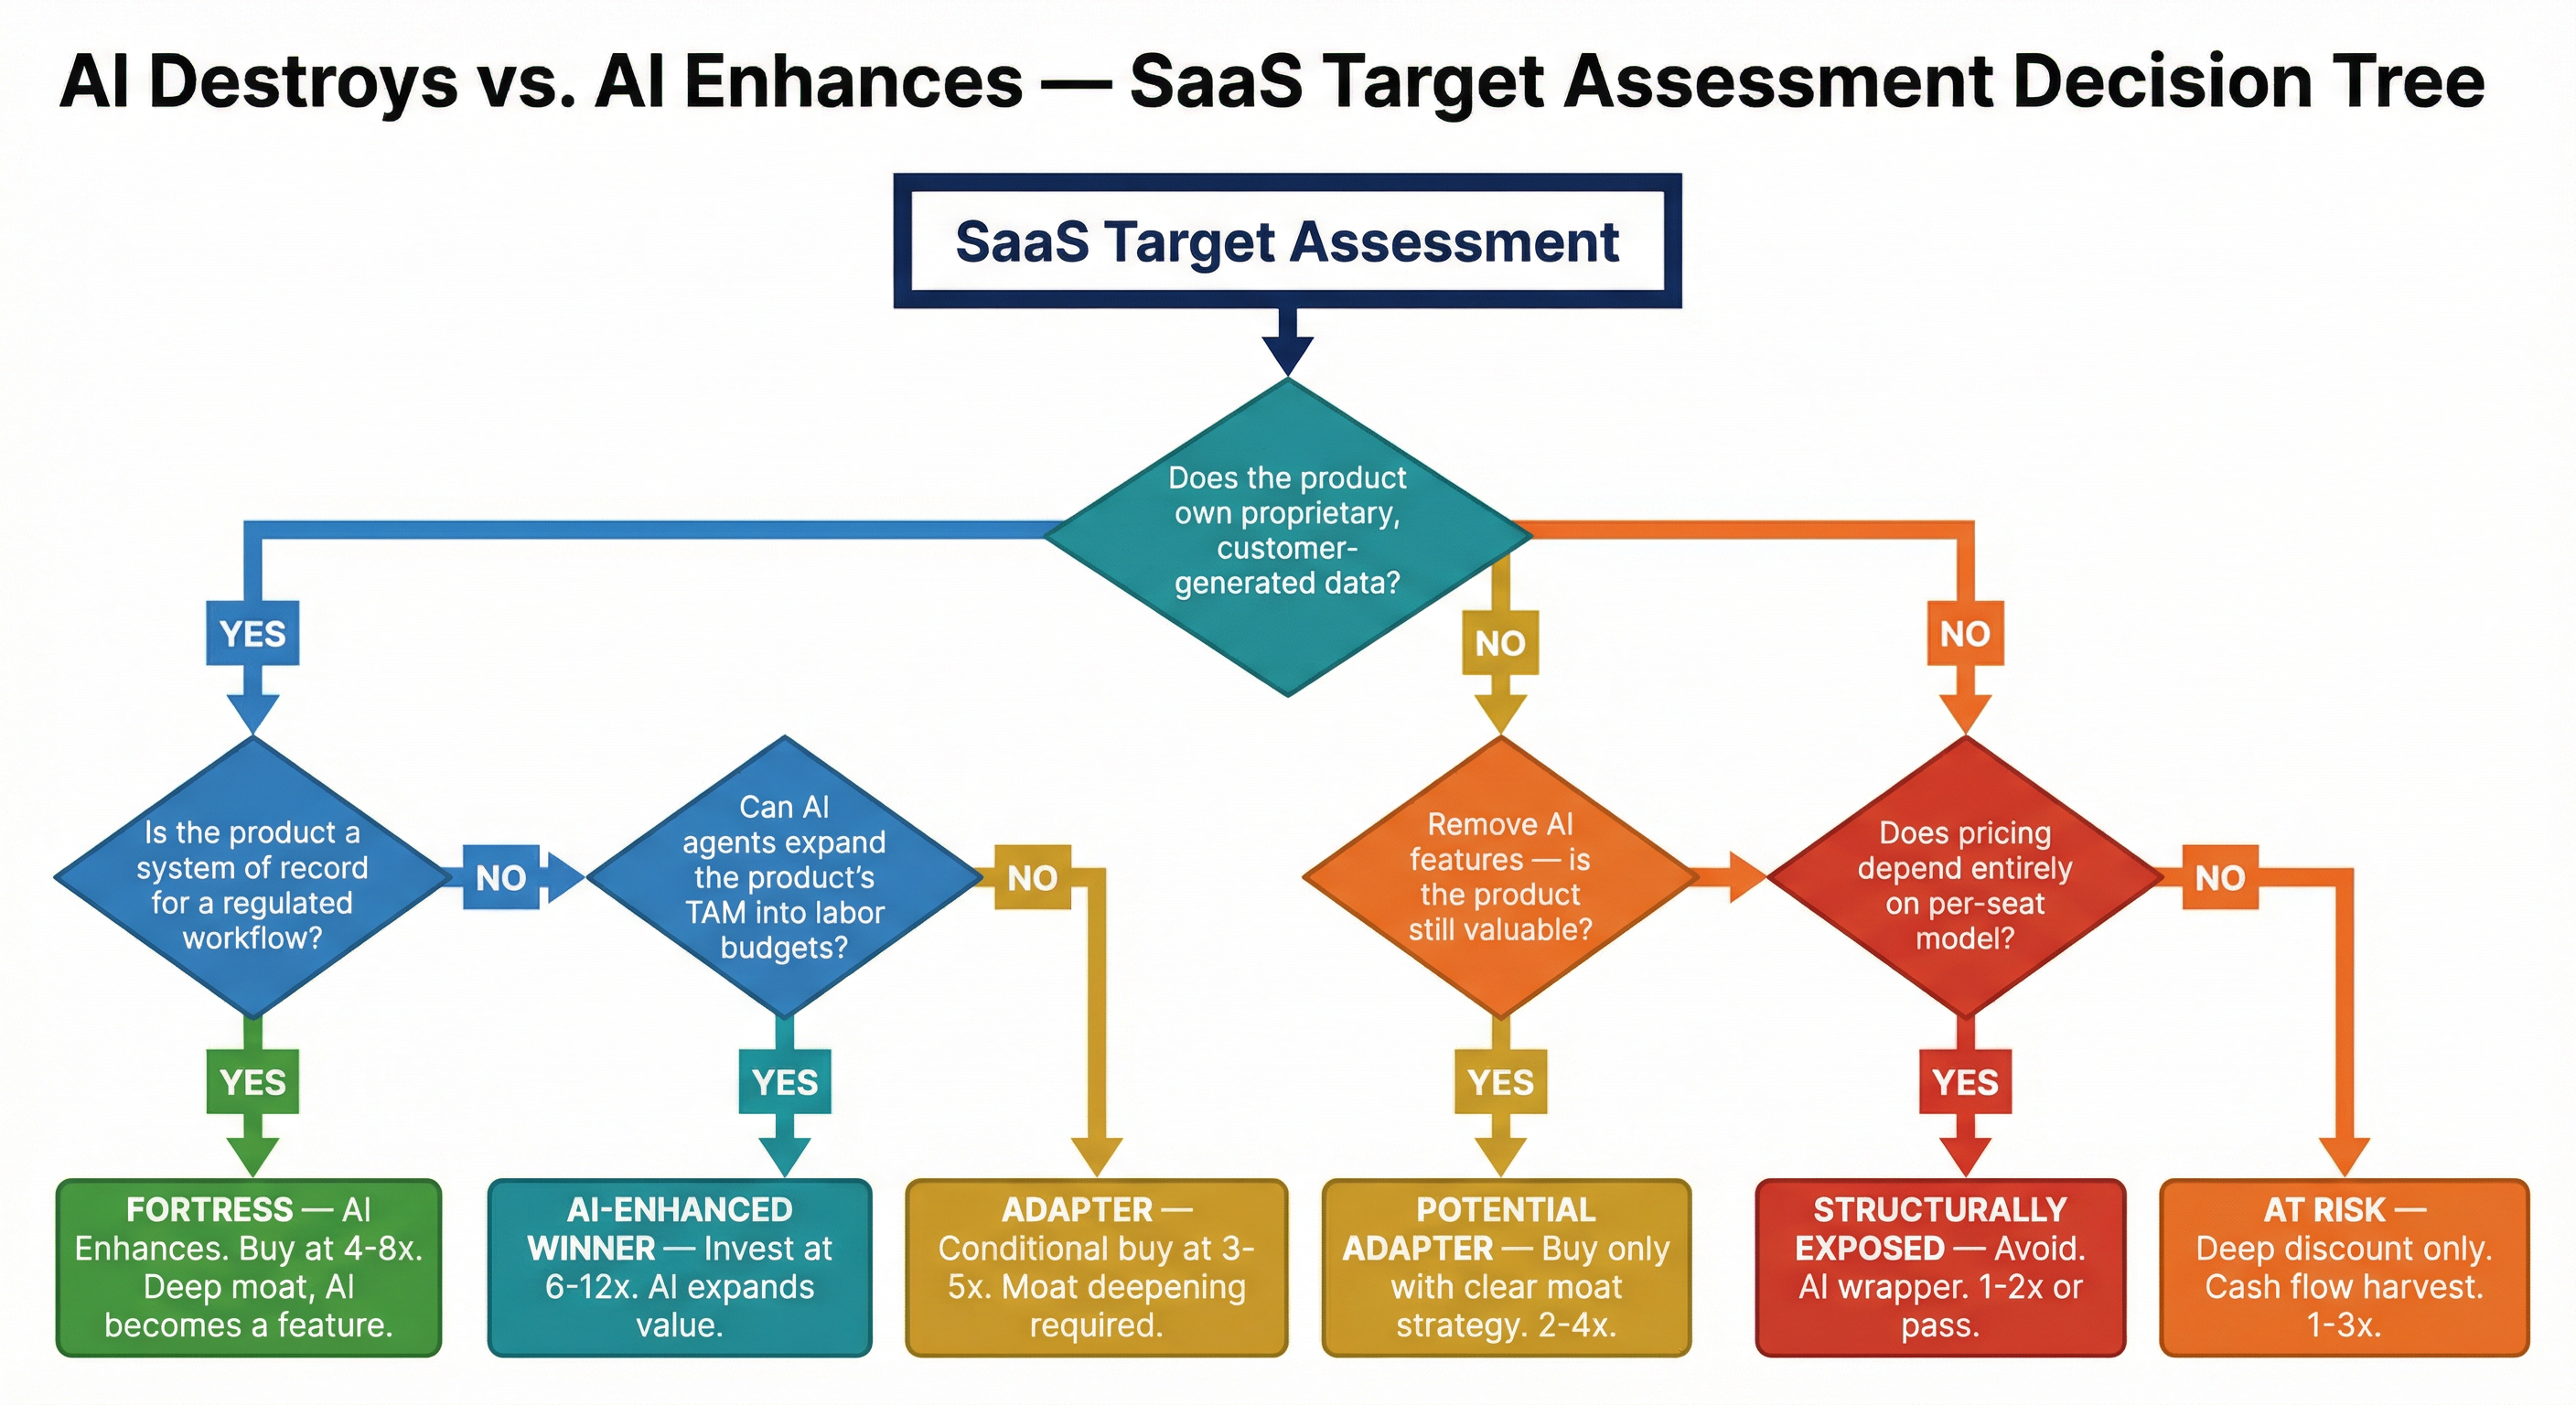
Mechanism 1: Proprietary or Hard-to-Replicate Data. Analyze when data is truly a moat and when it isn't. Counter-argument: AI has turned generic data from a moat into a commodity. But proprietary, domain-specific data that doesn't exist in sufficient volumes in the public domain (healthcare records, legal precedents, manufacturing sensor data, financial transaction history) remains highly defensible. The key distinction: data that is 'initial access' vs. data that is 'generated by customers using your product' — the latter creates a self-reinforcing flywheel. Reference the three 'unfair advantages' of vertical AI: unstructured data handling, domain-specificity, and customer-generated data loops.
Mechanism 2: Deep Integration into Customer Processes. Analyze workflow integration as the true fortress. When your software controls physical operations (delivery routes, machinery maintenance, construction safety protocols), ripping it out means re-wiring the physical world. Switching costs are tied to hardware, staff training, and operational processes — not just data migration. Reference the observation that replacing a core SaaS platform is 'open-heart surgery for an enterprise.' Provide a framework: 'surface integration' (API connections, data feeds) vs. 'deep integration' (process control, decision authority, regulatory compliance).
Mechanism 3: Regulatory or Compliance-Driven Lock-In. In regulated industries, software becomes the official, auditable system of truth. Legal mandates create switching costs that transcend economics. Examples: HIPAA-compliant healthcare records, KYC/AML compliance in financial services, SOC 2 audit trails, GDPR data management. AI actually INCREASES regulatory complexity, creating MORE demand for compliance software, not less. Only 22% of enterprises prioritized AI governance policy in 2025 — this gap represents a massive opportunity.
Mechanism 4: Security, Reliability, and Trust Requirements. Enterprise buyers prioritize proven reliability over cutting-edge features. AI-specific security is a fast-emerging vertical (Zemali for LLM protection, Binarly for firmware security, Island for enterprise browser protection). As AI deployment scales, security and trust become MORE important, not less. Shadow AI risks are high — employees adopt and abandon unapproved AI tools without oversight. Software that provides governance, auditability, and explainability commands premium pricing.
Mechanism 5: Ecosystem and Switching Costs. Analyze the network effects and ecosystem dynamics that protect established platforms. Salesforce's AppExchange, SAP's partner ecosystem, Workday's HR integration network. When vendors, customers, and cloud platforms align around standards, switching becomes nearly impossible. Community-driven moats: 'You can clone a codebase in a week; you cannot clone a network of 500 high-level CFOs who trust each other.'
Critical Contrast: 'AI Wrappers' vs. Structurally Defensible Software. Explicitly define what an 'AI wrapper' is and why it lacks defensibility (thin feature layer on top of third-party models, no proprietary data, no integration depth, no switching costs). Contrast with structurally defensible software that uses AI as an enhancement layer on top of existing moats. Provide a decision tree: 'If you removed the AI features, would the product still be valuable? If yes, the AI is enhancing a moat. If no, you're a wrapper.'
The preceding chapter presented the SaaS Risk Spectrum — this report's central analytical framework — segmenting the SaaS landscape into five categories with exposure ratings ranging from "net beneficiary" (infrastructure and security software) to "existentially threatened" (generic horizontal tools). This chapter answers the follow-on question that every PE deal team will ask: within any given SaaS company, what specific mechanisms create durable competitive advantage in an AI-disrupted landscape?
The question is urgent because the conventional wisdom on software defensibility is fracturing in two contradictory directions. One camp declares "everything is just an AI wrapper" — a dismissive narrative implying that any software company whose product relies on AI features is inherently commoditized. The opposing camp clings to "data is the new moat" — a comforting narrative suggesting that sitting on data confers automatic defensibility. Both are wrong in their absolute form, and both can destroy PE value if applied uncritically to investment decisions.
This chapter rejects both simplifications. It identifies five specific defensibility mechanisms that survive the AI disruption — proprietary data, deep process integration, regulatory lock-in, security and trust requirements, and ecosystem switching costs — and provides the evidence-based framework PE investors need to assess each. It then draws the critical contrast between "AI wrappers" and structurally defensible software, culminating in a decision tree that deal teams can deploy during diligence to classify any SaaS target as structurally enhanced or structurally threatened by AI.
As Chapter 3 documented, the valuation dispersion between the most and least defensible SaaS categories is already historically wide. Data infrastructure commands 6.2x NTM revenue, while DevOps trades at 5.7x NTM revenue — both reflecting sticky enterprise contracts and AI-critical infrastructure positioning. At the other extreme, horizontal SaaS shows the widest dispersion, from 1.1x NTM revenue for AdTech to 5.4–5.5x for design/engineering software and vertical AI apps. When viewed through an EBITDA lens, the dispersion is even more dramatic: Data Infrastructure trades at 24.4x EBITDA while DevOps commands 36.5x, both far surpassing the median of 12.7x for all SaaS companies. The mechanisms analyzed in this chapter explain why that dispersion exists, and how to assess whether a specific target's moat will hold over a five-year PE hold period.
Mechanism 1: Proprietary or Hard-to-Replicate Data
Most applicable categories: Deep Vertical SaaS (Category 3); Mission-Critical Systems (Category 5)
When Data Is a Moat — and When It Isn't
The "data moat" was long considered the ultimate defensibility mechanism in software. The logic was straightforward: the more data a company accumulated, the better its product became, creating a virtuous flywheel that competitors could not replicate. In the AI era, this logic requires radical refinement.
AI has turned data from a moat into a commodity. In vertical SaaS, real defensibility now comes from owning the workflow where the business actually runs. The Vendep Capital analysis, echoed by multiple venture and PE practitioners, underscores a critical distinction: in the age of AI, clinging to the idea of a data moat is a fatal strategic error. Foundation models have become so powerful that the advantage from proprietary data is fleeting. The real, durable, defensible asset in this new era is not the data you have — it's owning the entire workflow.
This statement is both correct and misleading — correct for generic data, but misleading when applied to domain-specific, customer-generated data. The critical distinction is between three types of data:
Type 1: Publicly Accessible or Generic Data. Data that exists in sufficient volumes across the open internet or in widely available datasets — general business knowledge, standard financial metrics, commodity market data, generic customer service transcripts. Foundation models are already trained on this data. Owning a copy confers zero defensibility. Any SaaS company whose "data moat" consists of information that GPT-4 or Claude already knows is effectively unmoated.
Type 2: Initial-Access Proprietary Data. Data that a company collected, purchased, or licensed to build its product — curated industry databases, purchased data feeds, aggregated public records. This data was once defensible because acquisition and curation required significant investment. AI has dramatically reduced these barriers: when access to frontier models becomes widespread, intelligence in its raw form stops being a differentiator. It becomes infrastructure. Competitors can now assemble similar datasets using AI-powered web scraping, synthetic data generation, and automated curation. This type of data moat is eroding rapidly — a trend accelerated by the proliferation of open-weight models. By 2026, open-weight models have caught up enough that architecture decisions are shifting from "which provider?" to "which open foundation?" When any enterprise can deploy a capable LLM on-premises using LLaMA, Mistral, or Qwen, the barrier to replicating Type 2 data advantages drops further.
Type 3: Customer-Generated Proprietary Data. Data that customers create by using the product — healthcare treatment outcomes recorded in a vertical EMR, manufacturing sensor data flowing through a factory management system, financial transaction patterns within a fintech platform, legal case outcomes within a litigation management tool. While models are commoditized, datasets are not. A dataset that captures the subtleties of your users, workflows, and outcomes is extremely hard to replicate. It becomes your defensible advantage, your moat.
This third category is the only genuinely durable data moat — and it is formidable. Customer-generated data possesses three characteristics that make it resistant to AI commoditization:
-
It doesn't exist elsewhere. A decade of anonymized patient treatment data within a specific hospital system cannot be replicated by training a foundation model on publicly available medical literature. The data is unique to the customer-vendor relationship.
-
It creates a self-reinforcing flywheel. As documented in Brim Labs' analysis, every user action, transaction, and query is a signal. Most startups collect it but rarely use it strategically. A proprietary dataset emerges when you systematically capture, clean, and label these signals for model fine-tuning or retrieval. Each customer interaction makes the product more valuable, increasing switching costs and data lock-in.
-
It compounds over time. The data advantage grows wider, not narrower, as the company accumulates more customers and more interactions. New entrants cannot leapfrog this advantage with AI alone — they need the customer relationships and time that generated the data.
The Three "Unfair Advantages" of Vertical AI
As Chapter 3's analysis of vertical SaaS demonstrated, the most defensible software companies combine three data-related unfair advantages:
- Unstructured data handling. Domain-specific expertise in processing unstructured data (handwritten medical notes, construction blueprints, legal documents) that general-purpose models handle poorly without fine-tuning.
- Domain specificity. Models fine-tuned on industry-specific corpora consistently outperform general models on domain tasks, and the fine-tuning data itself is proprietary.
- Customer-generated data loops. The flywheel described above, where product usage generates data that improves the product, which attracts more usage.
As one analysis of defensible AI products observed, the most defensible AI products are built on data that OpenAI, Anthropic, and Google don't have and can't get. If your AI is trained on or retrieves from data that's unique to your company, your customers, or your domain, generic models are useless. Data compounds over time.
Quantitative Evidence for Data Moat Durability
Empirical evidence supports the durability thesis for customer-generated data moats. By October 2025, vertical software companies commanded a slight premium, trading at 3.3x revenue compared to horizontal SaaS companies at 3.0x revenue. This premium was attributed to deeper customer relationships and higher switching costs. Across both public and private markets, buyers reward products that are "deeply embedded in workflows and data." The premium for customer-generated data flywheel effects is measurable: companies with strong data compounding characteristics (e.g., Veeva in life sciences, Procore in construction) consistently trade at the high end of their respective category multiples, providing quantitative validation that market participants price this mechanism into valuations.
PE Diligence Implication
The diligence question is not "Does this company have data?" but rather: "What type of data does this company possess, and how was it generated?" A three-part test:
- Could a competitor with access to frontier AI models and unlimited capital replicate this data within 24 months? If yes, the data is not a moat.
- Is the data generated by customers using the product, creating a compounding flywheel? If yes, the data moat strengthens over time.
- Does the data exist in the public domain in sufficient volumes to train a competitive model? If yes, the data is already commoditized.
Mechanism 2: Deep Integration into Customer Processes
Most applicable categories: Deep Vertical SaaS (Category 3); Mission-Critical Systems (Category 5)
Workflow Integration as the True Fortress
If data moats have been partially eroded by AI's ability to access and process generic information, process integration moats have arguably strengthened. When a software platform controls physical operations — delivery routes, machinery maintenance schedules, construction safety protocols, pharmaceutical manufacturing workflows — replacing it requires rewiring the physical world, not just migrating digital data.
As Chapter 1 documented, replacing a core SaaS platform like Salesforce or SAP remains "open-heart surgery for an enterprise." But the depth of that integration varies enormously — and depth determines defensibility.
The Surface vs. Deep Integration Framework
Not all integrations are created equal. PE investors must distinguish between two fundamentally different types:
Surface Integration: API Connections and Data Feeds. Software connected to other systems via standard APIs, webhooks, and data synchronization. While valuable for user convenience, surface integrations are increasingly replicable. Most SaaS products have well-documented APIs. AI excels as an integration layer without the need for pre-built connectors. With AI agents, these integrations and connections will become even more seamless as adoption accelerates. Surface integrations create switching costs measured in days or weeks — not months or years.
Deep Integration: Process Control, Decision Authority, and Regulatory Compliance. Software embedded into the operational fabric of the organization — controlling how work gets done, how decisions get made, and how compliance gets maintained. Deep integration involves:
- Hardware dependencies. When the software interfaces directly with physical equipment (IoT sensors, manufacturing controllers, point-of-sale hardware, medical devices), replacement requires physical infrastructure changes.
- Staff training and workflow habits. When hundreds or thousands of employees have built their daily work routines around the software, organizational change management becomes the binding constraint on switching.
- Operational process control. When the software dictates operational sequences — routing decisions, approval workflows, safety protocols — it cannot be replaced without re-engineering the operational process itself.
- Decision authority. When the software makes or enforces decisions that carry legal, financial, or safety consequences, it becomes the authoritative system for those decisions.
As Chapter 3's analysis of Procore demonstrated, deep vertical platforms evolve beyond merely tracking data to becoming the system that controls the flow of money, compliance, and physical operations. The switching cost is not the data migration — it is the operational disruption.
These businesses have operational moats. While AI can optimize dispatch, improve marketing, and help with forecasting, scheduling, and back-office efficiency, what it can't do currently is replace licensed technicians, safety-critical workflows, physical production constraints, or deeply embedded customer relationships. That matters in a world where "defensibility" is being redefined.
The AI Agent Erosion Risk — and Its Limits
A critical counter-argument deserves examination. For two decades, SaaS companies built moats around user habits, data lock-in, and workflow integration. AI agents are eroding each of these advantages simultaneously. AI agents can increasingly navigate software interfaces programmatically, extract data across platforms, and reduce the organizational friction of switching vendors.
AI agents are starting to crack that moat. Databricks, Snowflake, Microsoft, Salesforce, Palantir — they're all building AI-powered migration tools that can take months of work and shrink it to days, sometimes for free. Some even subsidize the switch. Customers suddenly have leverage in contract negotiations, knowing the cost to leave has plummeted.
However, this erosion applies primarily to the data migration component of switching costs — not the operational, organizational, and regulatory components. This could change mid-market dynamics fastest, where agility is higher and the benefits of a 10x-better product outweigh institutional inertia. But at the enterprise level, entrenched workflows, security requirements, and change management culture will still slow the exodus.
An important caveat on forward-looking risk: The pace at which multi-agent systems and open-weight models advance could alter this calculus more rapidly than current trajectories suggest. Bain & Company projects that in three years, "any routine, rules-based digital task could move from 'human plus app' to 'AI agent plus API.'" The economic reality is that models are increasingly commoditized — "OpenAI, Anthropic, Google, and open-source alternatives all deliver similar capabilities at similar price points." If multi-agent orchestration systems mature faster than expected, they could compress the timeline on which Level 2 (and potentially Level 3) integration switching costs erode. PE investors should stress-test moat assumptions against a scenario in which agent capabilities advance materially faster than consensus expectations.
The net effect: AI reduces data-migration switching costs but leaves process-control, regulatory, and organizational switching costs largely intact. For deeply integrated enterprise platforms, the moat narrows slightly but does not collapse. For surface-integrated tools that relied on data portability friction as their primary lock-in, the moat may indeed be breached.
PE Diligence Implication
Assess integration depth on a four-level scale:
| Integration Level | Description | Switching Cost | AI Erosion Risk |
|---|---|---|---|
| Level 1: Data Access | Read-only data connections via API | Days | HIGH — AI agents replicate easily |
| Level 2: Data Sync | Bidirectional data synchronization | Weeks | MEDIUM-HIGH — migration tools accelerating |
| Level 3: Workflow Control | Software controls operational sequences and approval flows | Months | LOW — requires org change management |
| Level 4: System of Consequence | Software controls money flows, physical operations, or compliance | Years | VERY LOW — replacement means operational shutdown |
Only Levels 3 and 4 constitute durable moats in the AI era. Any target whose integration depth sits at Level 1 or 2 should be priced accordingly.
Sample Application — Procore (Chapter 3 Example): Procore illustrates Level 4 integration in construction management. The platform controls project financials (payment applications, change orders, budget tracking), safety compliance (OSHA incident reporting, safety inspections), and field operations (daily logs, RFIs, punch lists) for general contractors and owners. Removing Procore from an active $500M construction project would require rebuilding compliance documentation, retraining hundreds of field workers, and re-establishing audit trails mid-project — an operational impossibility. In PE diligence, Procore-class targets with Level 4 integration should be classified as "Fortress" or "AI-Enhanced Winner" and priced at the upper end of the Deep Vertical SaaS range.
Mechanism 3: Regulatory or Compliance-Driven Lock-In
Most applicable categories: Infrastructure/Security/Compliance (Category 4); Healthcare IT; Financial Services
When Regulation Becomes the Moat
In regulated industries, software is not merely a productivity tool — it becomes the official, auditable system of truth. Legal mandates create switching costs that transcend economics, because switching introduces compliance risk that no CIO or CFO will accept voluntarily.
The examples are pervasive and growing:
- HIPAA-compliant healthcare records. Electronic medical records must maintain complete audit trails, access controls, and data integrity to satisfy HIPAA requirements. Migrating between EMR systems risks creating compliance gaps that could expose the healthcare organization to regulatory sanctions.
- KYC/AML compliance in financial services. In financial services and fintech, AI is becoming a driver of intelligence and speed for regulatory compliance — including anti-money laundering, Know Your Customer (KYC), and fraud detection. These compliance systems accumulate years of transaction history, risk models, and audit records that cannot be replicated quickly by a new vendor.
- SOC 2 audit trails. Enterprise software that generates SOC 2 audit evidence becomes the compliance record itself — replacing it requires regenerating the audit chain from scratch.
- GDPR data management. Software that manages data subject access requests, consent records, and data processing documentation cannot be easily replaced without risking GDPR violation.
- EU AI Act compliance. Global frameworks such as ISO 27001, SOC 2, GDPR, HIPAA, PCI DSS, and AI-specific standards — including the EU AI Act — are driving stronger governance requirements, expanding the compliance surface area that software vendors must address.
AI Increases Regulatory Complexity — Creating More Demand for Compliance Software
A critical insight for PE investors: AI does not reduce regulatory burden — it dramatically increases it. Every AI deployment introduces new compliance requirements around bias testing, explainability, data provenance, and governance that did not exist before.
Amanda Carty, general manager of compliance solutions at Diligent, predicts that "in 2026, we anticipate that compliance will undergo a fundamental reset." Organizations are grappling with "regulatory complexity and resource fatigue," a challenge that "61 percent of compliance teams experience."
The SEC's 2026 examination priorities reveal a significant shift: concerns about cybersecurity and AI have displaced cryptocurrency as the industry's dominant risk topic of the past five years. This regulatory intensification is happening across every major jurisdiction:
- In the US, the SEC's Investor Advisory Committee recently recommended enhanced disclosures concerning how boards oversee AI governance. The cyber insurance market is undergoing an AI-related transformation, with many carriers increasingly conditioning coverage on the adoption of AI-specific security controls. Insurers have begun introducing "AI Security Riders" that require documented evidence of adversarial red-teaming, model-level risk assessments, and specialized safeguards as prerequisites for underwriting.
- In Europe, the EU AI Act imposes graduated compliance requirements based on risk classification, requiring detailed documentation, conformity assessments, and post-market monitoring. Regulation is tightening around data and AI sovereignty, with governments demanding that data and AI processing remain within given borders — a geopolitical fence that splinters global AI deployments. By 2028, most nations are expected to mandate such sovereignty.
- In financial services, as financial institutions head into 2026, artificial intelligence is moving from a promising compliance tool to a regulatory necessity. The coming year will be defined by how effectively firms deploy governed, high-impact AI to manage growing regulatory complexity.
As the Executive Summary documented, only 22% of enterprises in 2025 prioritized AI governance policy with a visible, defined AI strategy — despite investment increasing rapidly. This governance gap is not a threat to compliance software companies. It is a massive market opportunity, and it is already beginning to close: 63% of breached organizations either don't have an AI governance policy or are still developing one, creating urgent demand for vendors that can accelerate governance readiness.
PE Diligence Implication
When evaluating targets in regulated verticals, ask:
- Is the software legally required for the customer to operate? If yes, switching involves regulatory risk that transcends economic calculation.
- Does the software generate compliance artifacts (audit trails, regulatory filings, consent records) that would need to be reconstructed upon switching? If yes, the regulatory moat is deep.
- Is the regulatory environment becoming more complex? In virtually every sector, the answer in 2026 is yes — which means the moat is widening, not narrowing. However, PE investors should acknowledge that regulatory trajectories carry uncertainty: potential harmonization of standards across jurisdictions could, over the long term, reduce vendor differentiation if compliance frameworks become more standardized.
- Does the company have specific certifications (HIPAA, SOC 2, FedRAMP, ISO 27001) that competitors would need years to obtain? These are barriers to entry that generic tools won't bother with.
Mechanism 4: Security, Reliability, and Trust Requirements
Most applicable categories: Infrastructure/Security/Compliance (Category 4); Deep Vertical SaaS (Category 3)
Enterprise Buyers Prioritize Proven Reliability Over Cutting-Edge Features
In the rush to discuss AI's disruptive potential, a fundamental fact of enterprise software procurement is often overlooked: large organizations choose vendors primarily based on security, reliability, and trust — not feature innovation. A CFO selecting an ERP system, a CISO choosing a security platform, or a CTO deploying a compliance tool will always prioritize proven reliability and vendor accountability over a marginally superior AI feature from an unproven startup.
This dynamic creates a structural advantage for established SaaS platforms and a structural disadvantage for AI-native entrants that lack enterprise track records, security certifications, and incident response histories.
AI-Specific Security Is a Fast-Emerging Vertical
As AI deployment scales, the security attack surface expands dramatically — creating a rapidly growing market for AI-specific security software. A 2026 Dark Reading poll found that 48% of security professionals rank agentic AI as the top attack vector for the year (Dark Reading, "2026 Security Priorities Survey," Feb. 2026). The finding reflects a growing industry consensus that AI agents — operating with elevated permissions across multiple systems — represent the fastest-expanding attack surface in enterprise security today.
The market is responding rapidly. As Chapter 3 documented, cybersecurity spending is projected to exceed $520 billion annually by 2026, with AI-specific security emerging as the fastest-growing subsegment. Companies providing LLM protection, firmware security, enterprise browser isolation, model monitoring, and agent governance are seeing accelerating demand.
Shadow AI: The Hidden Threat Driving Governance Demand
AI-driven SaaS keeps Shadow IT risks high, as employees quickly adopt and abandon unapproved tools like generative AI models without oversight. Industry reports suggest a significant portion of these AI SaaS apps risk data leaks and risky ghost accounts, giving rise to rogue LLMs possibly exposing sensitive data.
The shadow AI problem is intensifying. BlackFog released new research highlighting the growing risks of "Shadow AI" in the workplace. The study found that 86% now use AI tools at least weekly for work-related tasks. However, more than one-third (34%) admit to using free versions of company-approved AI tools. Among respondents using AI tools not approved by their employer, 58% rely on free versions, which often lack enterprise-grade security.
The financial impact is quantifiable: according to IBM's 2025 Cost of a Data Breach report, having a high level of shadow AI added an extra USD 670,000 to the global average breach cost (IBM/Ponemon Institute, "Cost of a Data Breach Report 2025," July 2025). One in five organizations reported a breach due to shadow AI, and organizations with high levels of shadow AI observed an average of $670,000 in higher breach costs than those with low or no shadow AI. Looking forward, Gartner predicts that by 2030, more than 40% of enterprises will experience security or compliance incidents linked to unauthorized shadow AI (Gartner, "Critical GenAI Blind Spots," Nov. 2025).
For SaaS companies that provide governance, auditability, and explainability — the tools that help enterprises manage shadow AI, monitor AI agent behavior, and maintain compliance — this is not a headwind. It is a structural tailwind that creates growing, recurring demand. Software that provides these capabilities commands premium pricing precisely because the cost of not having it (data breaches, regulatory fines, reputational damage) far exceeds the cost of the subscription.
PE Diligence Implication
- Does the target serve as a "trust layer" for enterprise AI deployment? Companies providing governance, security monitoring, and compliance tools for AI workloads are in the most defensible position in the entire SaaS landscape.
- Does the company have enterprise security certifications and incident response track records? These are barriers to entry that AI-native startups cannot quickly replicate.
- Is the company positioned to benefit from the shadow AI governance gap? In regulated industries, a projected 1 in 4 compliance audits in 2026 will include specific inquiries into the governance of AI tools and data handling.
Mechanism 5: Ecosystem and Switching Costs
Most applicable categories: Mission-Critical Systems (Category 5); Large Horizontal Platforms
Network Effects and Ecosystem Dynamics
The final defensibility mechanism operates at the ecosystem level. When vendors, customers, partners, and cloud platforms align around a shared platform, switching becomes not just expensive for one company — it becomes disruptive to an entire network of relationships.
With more than 9,000 solutions available and over 13 million customer installs, Salesforce's AppExchange has become a gravitational force in the SaaS orbit. Over 90% of Salesforce customers use at least one AppExchange app. According to Business Research Insights, the global Salesforce AppExchange tools market was USD 2.49 billion in 2024 and is projected to grow to USD 8.92 billion by 2033, at a CAGR of 15.2% during the forecast period (Business Research Insights, "Salesforce AppExchange Tools Market," 2025).
This ecosystem creates multi-layered switching costs:
- Technical integration costs. Enterprises have built custom integrations between their core platform and dozens of ecosystem applications. Switching the core platform means rebuilding every integration.
- Partner and vendor relationships. Consulting firms, systems integrators, and ISVs specialize in specific platforms. An enterprise's entire vendor network may be aligned around a single ecosystem.
- Staff expertise and certification. Organizations invest heavily in training employees on specific platforms. Switching means retraining — or replacing — skilled staff.
- Community-driven network effects. The most powerful ecosystem moats are social, not technical. A Salesforce admin community, a SAP user group, a Workday HR professionals network — these communities create trust, shared knowledge, and peer validation that no AI model can synthesize. As one analysis stated: you can clone a codebase in a week; you cannot clone a network of 500 high-level CFOs who trust each other.
The Ecosystem Monetization Play
Critically, ecosystem ownership creates a defensibility mechanism that AI enhances rather than threatens. "When you use our API, you are using Salesforce compute," said Tyler Carlson, SVP of AppExchange. At the center of the debate is Salesforce's AppExchange Partner Program, which governs how third-party vendors build and distribute commercial applications that access Salesforce data. Salesforce requires partner vendors building a commercially distributed application to enroll in the partner program.
Software vendors are introducing new data access fees and API tolls, creating a monetization layer around their ecosystems. The legal battles between companies like Celonis and SAP over data access are just the beginning. CIOs and CFOs must now budget for these "data tolls," which Constellation Research argues could be the biggest risk to scaling AI agents.
This is a profound — if still uncertain — insight for PE investors: the same AI agents that threaten seat-based revenue models may actually reinforce ecosystem moats by requiring API access to the data and workflows within established platforms. AI agents need to read from and write to systems of record — and the platform that controls that access can charge for it. However, the pace and success of API toll monetization remains an open question. Regulatory backlash against data access fees, open data standards advocacy, and antitrust scrutiny could limit the scope of this revenue stream. PE investors should model API toll revenue as a potential upside scenario rather than a base-case certainty.
The Counter-Argument: AI as an Ecosystem Disruptor
The bear case on ecosystem moats cannot be dismissed entirely. AI agents flatten these moats because they don't care about the interface. An agent can navigate a clumsy UI just as easily as a sleek one, or bypass the UI entirely via API. This reduces the "stickiness" of traditional software.
However, this argument conflates user interface stickiness with ecosystem stickiness. An AI agent can indeed bypass a clumsy UI — but it cannot bypass the contractual, technical, and organizational dependencies that bind an enterprise to a platform ecosystem. The agent still needs the data, still requires API access, and still operates within the compliance and governance framework that the platform controls.
A more substantive risk to ecosystem moats comes from multi-agent orchestration platforms that could, over time, abstract away platform-specific dependencies. Bain describes agentic AI as "rebundling control" on a three-layer stack: systems of record at the base, agent operating systems in the middle, and outcome interfaces at the top. Systems of record "store core business data, manage who can access it, and enforce rules" — and "their edge lies in unique data structures, long histories of activity, and built-in regulatory logic." If the "agent operating system" layer matures into a dominant middleware tier, it could reduce the lock-in advantage of individual platform ecosystems by providing a common orchestration layer. This remains a speculative but plausible threat that PE investors should monitor.
PE Diligence Implication
- How large is the target's ecosystem? Count ISV partners, marketplace applications, certified consultants, and community members. Larger ecosystems create stronger gravitational pull.
- What percentage of customers use third-party applications built on the platform? High adoption of ecosystem apps dramatically increases switching costs.
- Does the target control data access for its ecosystem? Platforms that can charge API tolls and data access fees have monetization options that transcend the base product — though this revenue stream faces regulatory and competitive uncertainty.
- Is the community organically active? User conferences, community forums, certification programs, and peer networks signal genuine ecosystem lock-in versus superficial partnerships.
Emerging Threats to Moat Durability: Multi-Agent Systems and Open-Weight Models
Beyond the five mechanisms above, PE investors must account for two emerging technology trends that could accelerate moat erosion beyond current consensus expectations:
Multi-Agent Systems
Multi-agent orchestration is evolving from experimental concept to production reality. As one analysis notes, "each connector you build saves your customer 40–80 hours of engineering time — that's real switching cost," but these connectors are increasingly commoditized. SaaStr's experience deploying 20+ AI agents confirms that "your AI is table stakes" and moats lie in going vertical — "don't build 'an AI sales agent,' build 'the AI SDR for enterprise SaaS selling to IT buyers.'" If multi-agent systems can orchestrate across platforms without deep integration into any single vendor, they could weaken ecosystem lock-in for Category 5 platforms. The risk is highest for platforms whose stickiness derives primarily from UI familiarity and data format lock-in, and lowest for platforms embedded in regulatory workflows and physical operations.
Open-Weight Models
Open-source LLMs surged in late 2025, evolving from experimental projects into state-of-the-art AI systems rivaling proprietary offerings. DeepSeek's reasoning model validated that open weights can deliver high-value reasoning, showing that open models are "capable options for teams that need cost control or air-gapped deployments." The implications for SaaS moats are twofold: (1) AI wrapper companies lose their last potential differentiation as even their model access becomes commoditized; and (2) enterprises gain the ability to build internal AI capabilities that could, in some cases, substitute for SaaS tools that primarily provide AI-powered analytics or insights on non-proprietary data. However, open-weight models do not erode moats built on customer-generated data, process integration, regulatory compliance, or ecosystem lock-in — they primarily threaten Type 1 and Type 2 data advantages and wrapper-layer products.
PE investors should incorporate these trends into scenario analysis for hold-period planning, particularly for targets in Categories 1 and 3a (Surface Vertical SaaS) where moat depth is thinnest.
Critical Contrast: "AI Wrappers" vs. Structurally Defensible Software
Defining the AI Wrapper
An AI wrapper is a product whose core value proposition is a thin feature layer built on top of third-party AI models — with no proprietary data, no integration depth, no regulatory moat, and no meaningful switching costs. An OpenAI wrapper is any product where the core value is "ChatGPT but for [specific use case]" with no meaningful differentiation beyond the prompt and UI.
The characteristics are now well-documented:
- The underlying capability often remains indistinguishable from what others can access. When the heart of a product depends entirely on third-party APIs, value is effectively rented. Model updates, pricing changes, or policy shifts can instantly destabilize both economics and functionality.
- API costs typically consume 15–30% of revenue for successful wrappers, and the harsh reality is that 90% of AI startups are projected to fail by 2026 due to unsustainable economics and weak competitive moats.
- Traditional SaaS has near-zero marginal costs for serving additional users, while AI wrappers pay for every single API call. More usage directly means more expense, eliminating the economies of scale that made SaaS so profitable.
The wrapper failure mode is predictable: the most vulnerable segment isn't building AI — it's repackaging it. These are the companies that take OpenAI's API, add a slick interface and some prompt engineering, then charge $49/month for what amounts to a glorified ChatGPT wrapper. Some have achieved rapid initial success, like Jasper.ai, which reached approximately $42 million in ARR in its first year. But Microsoft can bundle your $50/month AI writing tool into Office 365 tomorrow.
What Structurally Defensible Software Looks Like
In contrast, structurally defensible software uses AI as an enhancement layer on top of existing moats — proprietary data, deep workflow integration, regulatory compliance, security infrastructure, or ecosystem network effects.
This only works if your product controls proprietary data, compliance gates, or switching costs that an external model cannot bypass. The test proposed by Wall Street analysts is revealing: "Can this workflow be executed by a general agent connected to APIs?" If the answer is yes, valuation compression follows.
The distinction is not about whether a product uses AI — nearly every SaaS product will incorporate AI features by 2028. The distinction is about what the product would be without AI.
The Wrapper Test: A Single Question
The simplest and most powerful diagnostic for PE diligence is this:
"If you removed the AI features from this product, would it still be valuable to customers?"
-
If YES: The AI is enhancing an existing moat. The company has intrinsic value independent of its AI capabilities — in its data, its integration depth, its regulatory position, or its ecosystem. AI makes it better, but the product doesn't need AI to justify its existence. This is structurally defensible software.
-
If NO: You are looking at an AI wrapper. The product's entire value proposition depends on AI capabilities that are built on third-party models, delivered through commodity compute, and replicable by any competitor with a well-crafted prompt. This is structurally exposed.
Cursor stands as a rare wrapper-layer company that has built genuine defensibility. By deeply integrating into developer workflows, creating proprietary features beyond simple API calls and establishing strong network effects through user habits and custom configurations, Cursor has demonstrated how a wrapper can evolve into something more substantial. But companies like Cursor are outliers, not the norm.
The table below provides PE deal teams with a structured framework for assessing moat durability across the five mechanisms. Durability ratings are informed by (a) current market multiples reflecting investor consensus on defensibility, (b) empirical switching-cost data from industry analyses, and (c) the trajectory of AI-agent capabilities as documented in this chapter. The "Expected Durability" column represents a base-case assessment; investors should stress-test against accelerated AI-adoption scenarios as described in the emerging threats section above.
| Defensibility Mechanism | Current Strength (2026) | Expected Durability (5-Year) | Most Applicable Categories (Ch. 3) | PE Diligence Questions | Risk Factors That Could Erode |
|---|---|---|---|---|---|
| 1. Proprietary Customer-Generated Data | HIGH for domain-specific data; LOW for generic data | HIGH — compounds with usage; strengthens over time | Deep Vertical SaaS (Cat. 3); Mission-Critical Systems (Cat. 5) | "Is this data generated by customers using the product? Could a competitor replicate it within 24 months? Does it compound?" | Synthetic data breakthroughs; open-source training data initiatives; data portability regulation; open-weight model proliferation reducing Type 2 data advantages |
| 2. Deep Process Integration | HIGH for Level 3–4 integration; LOW for Level 1–2 | HIGH — operational and organizational switching costs resist AI erosion | Deep Vertical SaaS (Cat. 3); Mission-Critical Systems (Cat. 5) | "What happens to the customer's operations if this software is removed? Is the integration at process-control level or API level?" | AI-powered migration tools (Databricks, Snowflake); multi-agent orchestration platforms abstracting dependencies; enterprise platform consolidation; "rip and replace" subsidies |
| 3. Regulatory / Compliance Lock-In | HIGH and INCREASING — AI creates new compliance requirements | VERY HIGH — regulatory complexity is accelerating, not declining | Healthcare IT; Financial Services; GRC; Infrastructure/Security/Compliance (Cat. 4) | "Is the software legally required for compliance? Does it generate audit artifacts? Is regulatory complexity increasing in this vertical?" | Regulatory rollback (unlikely in most jurisdictions); standardization of compliance frameworks reducing vendor differentiation; potential harmonization of AI governance standards |
| 4. Security, Reliability, and Trust | HIGH — enterprise buyers prioritize proven vendors | HIGH — shadow AI risks and AI security threats expand demand | Infrastructure/Security/Compliance (Cat. 4); Deep Vertical SaaS (Cat. 3) | "Does this company provide governance/auditability for AI workloads? Does it have enterprise security certifications? What is its incident response track record?" | Commoditization of basic security features; hyperscaler-native security tools absorbing point solutions; open-weight model security tooling maturing |
| 5. Ecosystem and Switching Costs | HIGH for large platforms (Salesforce, SAP, Workday); LOW for single-vendor tools | MEDIUM-HIGH — AI agents reduce UI stickiness but may increase API dependency | Mission-Critical Systems (Cat. 5); Large Horizontal Platforms | "How large is the partner/ISV ecosystem? What % of customers use ecosystem apps? Does the platform control data access and API monetization?" | AI agents reducing UI-level stickiness; multi-agent orchestration middleware; open data standards; platform antitrust regulation |
| — AI Wrapper (No Moat) | NONE | NONE — rapidly commoditized | Generic Horizontal (Cat. 1); Surface Vertical (Cat. 3a) | "If AI features were removed, would the product still be valuable?" | N/A — inherently non-defensible |
Using the Table in PE Diligence: A Sample Application
To illustrate practical application, consider Procore (a Chapter 3 example classified as Deep Vertical SaaS):
| Mechanism | Procore Assessment | Rating |
|---|---|---|
| 1. Proprietary Data | Customer-generated project data (RFIs, change orders, safety logs) across 1M+ projects; unique to each GC/owner relationship | HIGH |
| 2. Process Integration | Level 4: Controls payment workflows, safety compliance, subcontractor management — removal means construction project shutdown | VERY HIGH |
| 3. Regulatory Lock-In | OSHA safety documentation, prevailing wage compliance, lien waiver management — all generate audit artifacts | HIGH |
| 4. Security/Trust | SOC 2 certified; mission-critical uptime for active construction sites; 15+ year track record | HIGH |
| 5. Ecosystem | 500+ integrations with accounting, scheduling, estimating tools; certified partner network | MEDIUM-HIGH |
Classification: Fortress (4+ strong mechanisms). Diligence conclusion: Defensible for full PE hold period; AI enhances the platform (AI-powered safety monitoring, predictive scheduling) rather than threatening it.
The following decision tree provides PE analysts with a structured framework for assessing whether a specific SaaS target is structurally enhanced or threatened by AI. Each terminal node leads to a classification — Fortress, AI-Enhanced Winner, Adapter, or Exposed — that maps directly to the 2x2 matrix introduced in the Executive Summary.
How to Read the Tree: Starting from the top, answer each question sequentially. Follow the YES or NO branch until reaching a terminal classification. Multiple paths can converge on the same classification — a company can reach "Fortress" through data moats, process integration, or regulatory lock-in.
STEP 1 — PROPRIETARY DATA ASSESSMENT
Does the target own proprietary, customer-generated data that doesn't exist in the public domain?
-
YES → Is data compounding (flywheel from customer usage)?
- YES → STRONG DATA MOAT → Proceed to Step 4 (Pricing Model Test)
- NO → MODERATE DATA MOAT → Proceed to Step 2
-
NO → Proceed to Step 2
STEP 2 — PROCESS INTEGRATION ASSESSMENT
Does the target have deep process integration (Level 3–4)?
- YES → STRONG PROCESS MOAT → Proceed to Step 4 (Pricing Model Test)
- NO → Proceed to Step 3
STEP 3 — REGULATORY / COMPLIANCE ASSESSMENT
Is the target in a regulated industry with compliance lock-in (generates audit artifacts, legally required for operations)?
- YES → REGULATORY MOAT → Proceed to Step 4 (Pricing Model Test)
- NO → Proceed to Step 5 (Wrapper Test)
STEP 4 — PRICING MODEL TEST
Is >50% of revenue from seat-based pricing with no usage/outcome-based component?
- YES → ADAPT OR DIE — Strong moat but pricing model transition required. Invest only with clear migration plan. Target EV/Revenue: 3–7x at exit.
- NO → FORTRESS or AI-ENHANCED WINNER — Multiple moats plus modern pricing. Invest aggressively.
- If 3+ mechanisms strong → FORTRESS. Target EV/Revenue: 6–12x at exit.
- If 1–2 mechanisms strong + AI tailwinds → AI-ENHANCED WINNER. Target EV/Revenue: 8–18x at exit.
STEP 5 — WRAPPER TEST
If you removed the AI features, would this product still be valuable to customers?
- YES → ADAPTER — Limited moat but underlying value exists. Potential investment with significant operating improvements. Target EV/Revenue: 3–7x at exit.
- NO → STRUCTURALLY EXPOSED — AI wrapper or thin feature layer. Avoid or acquire only at deep discount for cash flow harvesting. Target EV/Revenue: 1–3x at exit.
Classification Key
| Classification | Description | Target EV/Revenue at Exit |
|---|---|---|
| FORTRESS | Multiple durable moats (data + integration + regulation). Buy at trough multiples. Hold for expansion. | 6–12x |
| AI-ENHANCED WINNER | Strong moats + AI tailwinds. Invest aggressively. AI adoption expands TAM. | 8–18x |
| ADAPT OR DIE | Some moats but significant transition risk. Invest only if clear path to moat-deepening. Pricing model migration required. | 3–7x |
| STRUCTURALLY EXPOSED | No durable moats. AI wrapper or thin feature layer. Avoid or acquire only at deep discount for cash flow harvesting. | 1–3x |
How to Use the Decision Tree
PE deal teams should apply this tree to every SaaS target during preliminary screening. The process takes approximately 30 minutes per target and requires answers to five core questions:
- Data proprietary? — Review data sources, customer-generation dynamics, and replicability.
- Integration depth? — Classify using the Level 1–4 framework from Mechanism 2.
- Regulatory moat? — Identify industry-specific compliance requirements and certification barriers.
- Pricing model? — Assess seat-based vs. usage-based revenue mix and transition risk.
- Wrapper test? — Answer the single question: "Would this product be valuable without AI features?"
The classification directly maps to the entry pricing framework established in the Executive Summary's 2x2 matrix and the valuation scenarios to be developed in Chapter 5.
Integrating the Five Mechanisms: The Compound Moat
The most defensible SaaS companies do not rely on a single mechanism — they layer multiple moats simultaneously. Consider how the mechanisms compound for a deeply embedded vertical platform like Epic (healthcare EMR):
- Proprietary Data: Decades of patient treatment records across thousands of healthcare systems, generated by clinical workflows within the product.
- Deep Integration: Level 4 integration controlling clinical workflows, medication ordering, billing processes, and inter-department communication for entire hospital systems.
- Regulatory Lock-In: HIPAA compliance requirements, FDA-regulated clinical decision support, and auditable medical records mandate.
- Security and Trust: Mission-critical uptime requirements (system downtime risks patient safety); enterprise security certifications; incident response track record spanning decades.
- Ecosystem: Hundreds of third-party integrations, certified implementation partners, trained staff at every customer organization.
No AI model, no matter how capable, can replicate this compound moat. AI can enhance Epic's product — and Epic is actively deploying AI for clinical decision support, documentation automation, and predictive analytics — but AI cannot substitute for the five-layer defensibility stack that Epic has built over decades.
For PE investors, the implication is clear: when evaluating SaaS targets, count the moat layers. A company with one mechanism may be defensible for 2–3 years. A company with three or more mechanisms operating simultaneously is likely defensible for the full PE hold period and beyond.
SaaS businesses that are embedded in mission-critical workflows, sitting on defensible proprietary data, or operating in regulated environments continue to attract premium attention. Across both public and private markets, buyers reward "products that are deeply embedded in workflows and data," and companies that can "mitigate AI risk while leveraging it within their platform are increasingly positioned for stronger outcomes."
Chapter Synthesis: What PE Must Take From This Analysis
This chapter has identified five defensibility mechanisms and drawn the critical contrast between AI wrappers and structurally defensible software. The key findings for PE investors are:
-
Not all data is a moat. Only customer-generated proprietary data that compounds through a usage flywheel constitutes a durable defensibility mechanism. Generic and publicly available data confer zero moat in the AI era. The proliferation of open-weight models (LLaMA, Mistral, Qwen, DeepSeek) accelerates the commoditization of Type 1 and Type 2 data advantages.
-
Integration depth determines switching-cost durability. Surface integrations (API connections, data feeds) are increasingly replicable by AI agents. Deep integrations that control operational processes, money flows, and compliance remain formidable. The Level 1–4 framework provides a practical assessment tool.
-
Regulatory complexity is a growing moat, not a shrinking one. AI deployment creates new compliance requirements around governance, bias, explainability, and data provenance. Companies serving regulated industries will see demand accelerate as AI adoption increases.
-
Security and trust command premium pricing that AI strengthens rather than threatens. One in five organizations reported a breach due to shadow AI, and organizations with high levels of shadow AI observed an average of $670,000 in higher breach costs. Gartner predicts by 2030 more than 40% of enterprises will experience security or compliance incidents linked to unauthorized shadow AI. This creates structural demand for security and compliance software. This is the most clearly AI-beneficiary segment in the SaaS landscape.
-
Ecosystem moats operate at the network level. The largest platforms (Salesforce, SAP, Workday) benefit from ecosystem lock-in that AI agents cannot easily bypass — and may in fact reinforce through API-based data access monetization — though the success of API toll strategies remains uncertain and subject to regulatory risk.
-
AI wrappers are not investments — they are time-decaying options. Any SaaS product that fails the wrapper test ("Would it be valuable without AI features?") is fundamentally non-defensible and should be avoided or acquired only at deep discounts for cash flow harvesting.
-
Multi-agent systems and open-weight models represent emerging, accelerating risks to moats built on shallow integration, generic data, or model-access differentiation. PE investors should stress-test hold-period assumptions against scenarios where these technologies advance faster than consensus.
"AI isn't killing SaaS," as Continuum Advisory Partners' Verma stated. But it has killed complacency. The moats that matter in the AI era are different from those that mattered in the cloud era — and PE firms that can accurately assess which mechanisms are present in a target company will gain significant investment edge in the current dislocation.
The next chapter — "Five-Year SaaS Valuation Scenarios (2026–2031)" — will translate the risk spectrum from Chapter 3 and the defensibility mechanisms from this chapter into four quantified scenario archetypes for how SaaS valuations may evolve over the PE hold period. Where this chapter identified what makes SaaS defensible, Chapter 5 will project what that defensibility is worth under different AI adoption trajectories — providing PE investors with the entry/exit pricing framework needed to calibrate bid prices and model returns.
Chapter 5: Five-Year SaaS Valuation Scenarios (2026–2031)
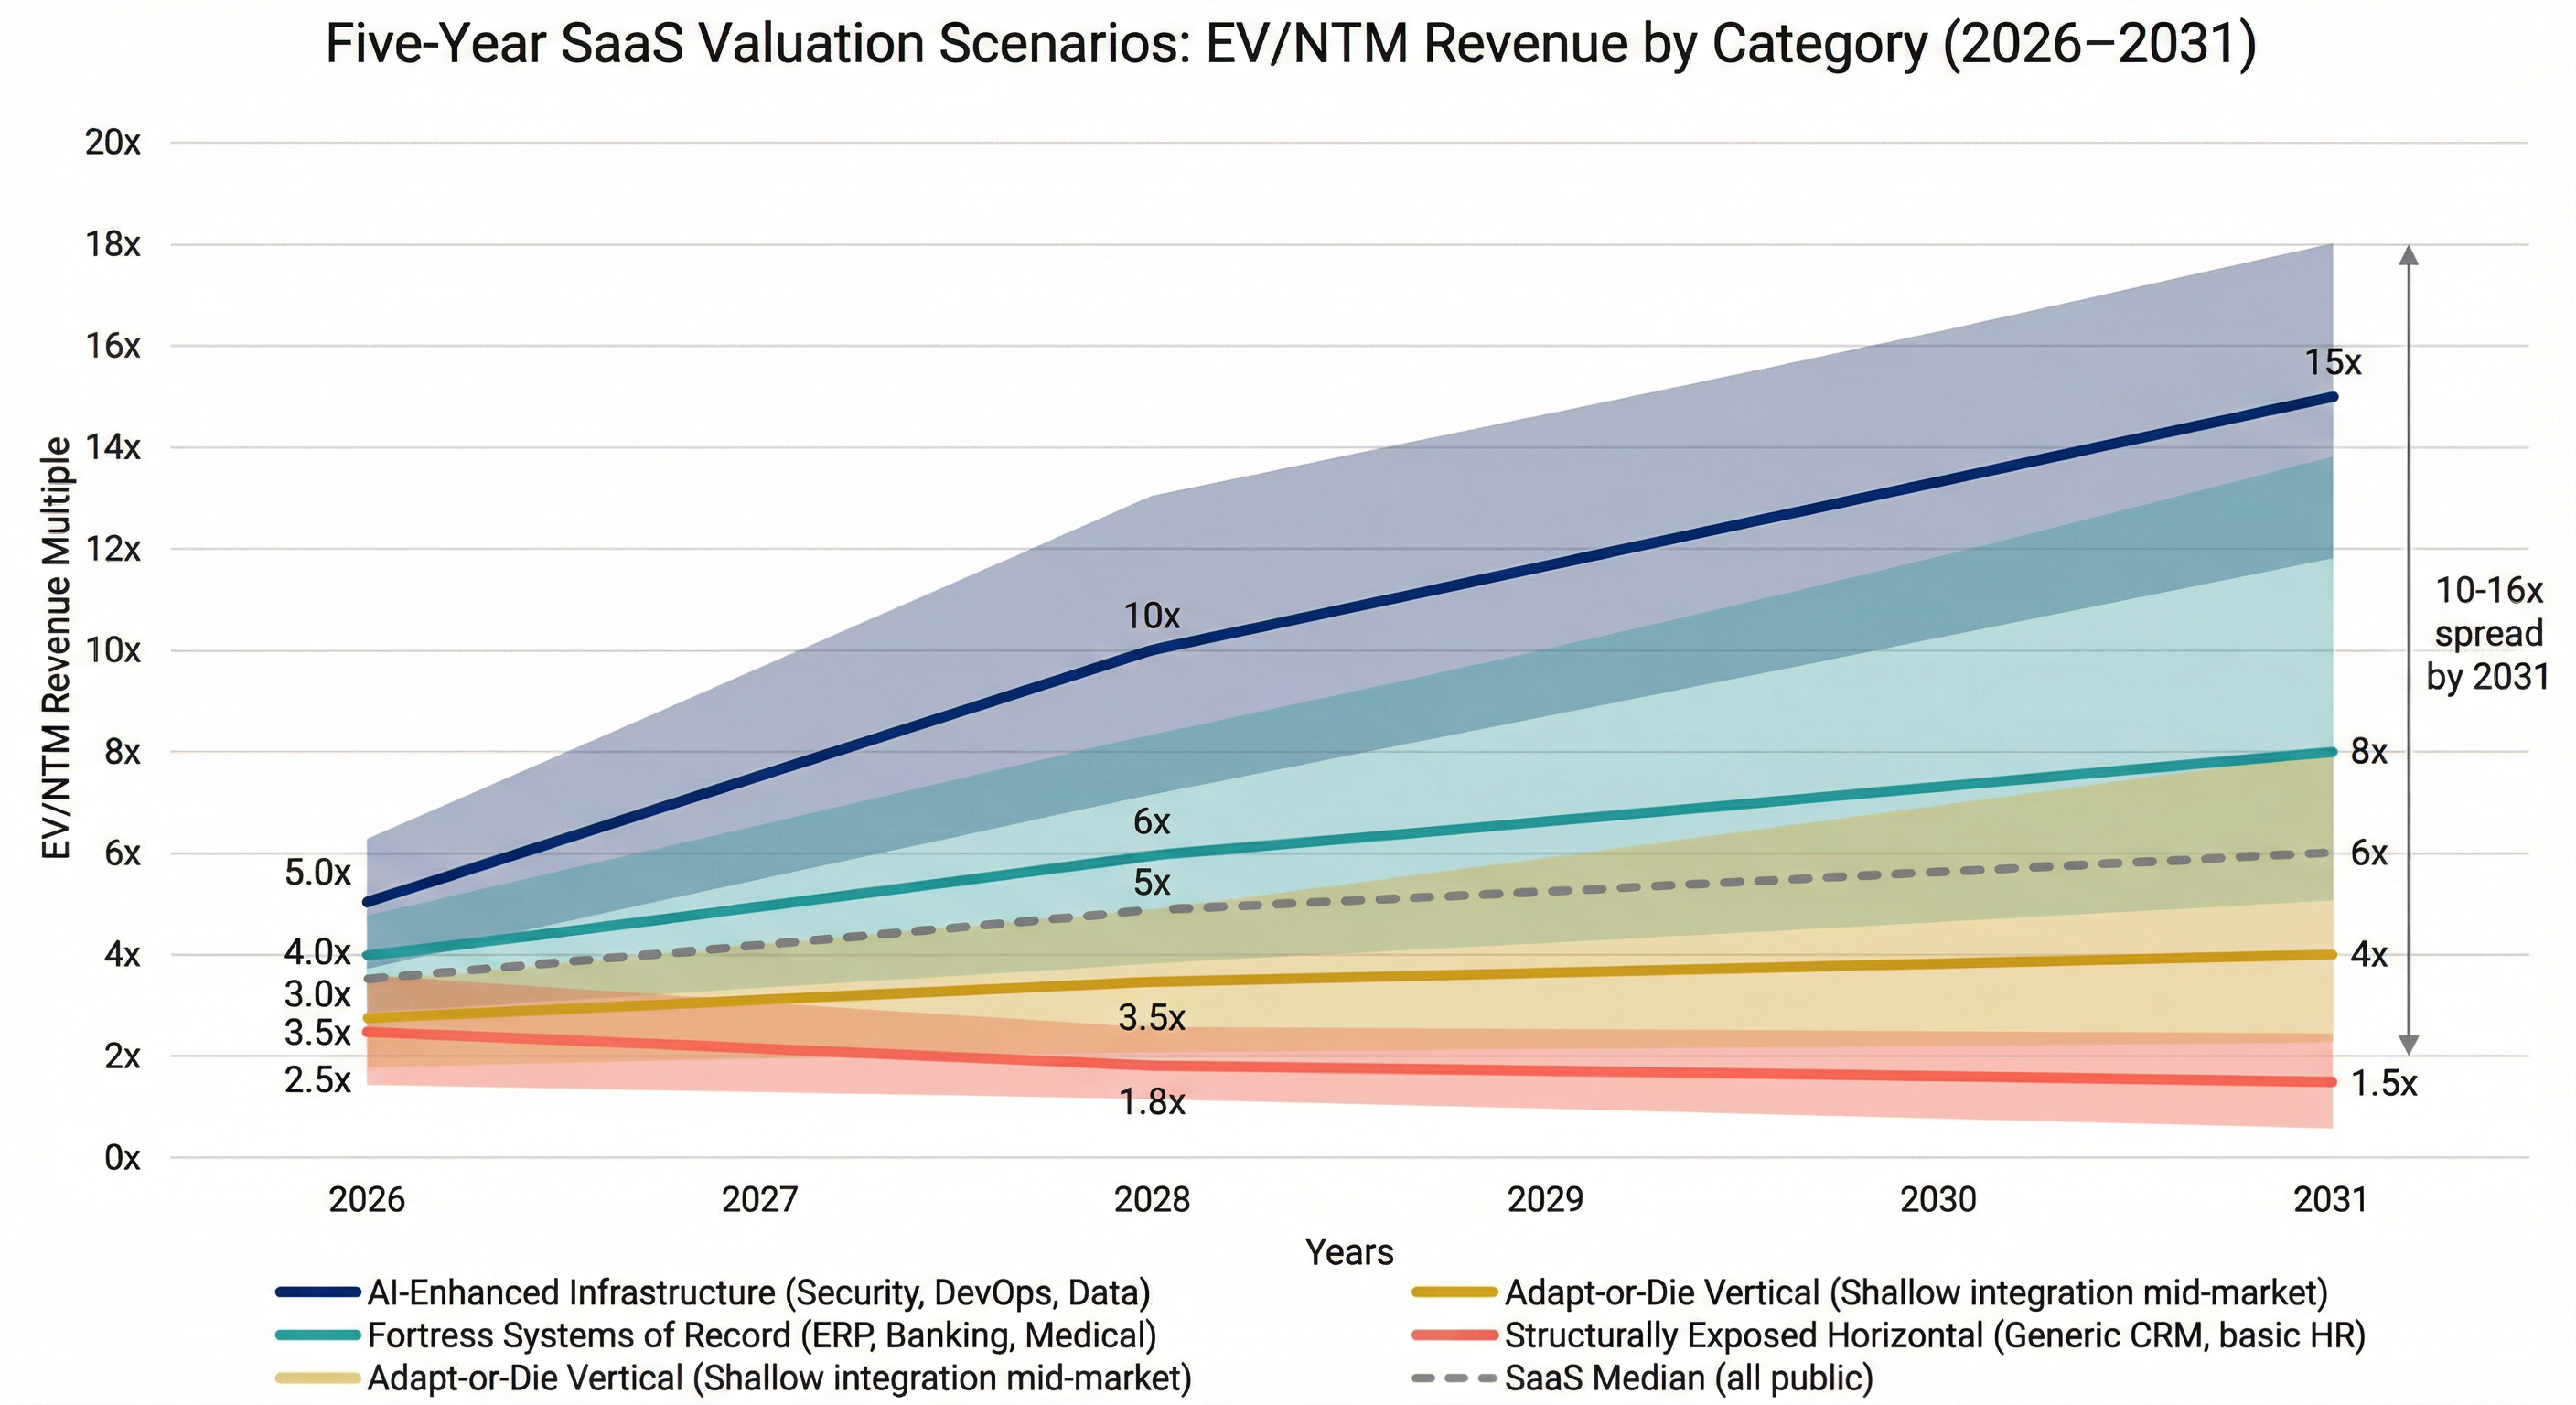
The preceding four chapters have established the empirical record (Chapter 1: $2 trillion in cumulative market-cap losses, historically wide valuation dispersion), the economic mechanics (Chapter 2: divergent P&L archetypes, gross margin compression vs. operating leverage), the segmented risk framework (Chapter 3: five categories from "Fortress" to "Structurally Exposed"), and the defensibility analysis (Chapter 4: five moat mechanisms and the critical "AI wrapper" test). This chapter synthesizes all four into the forward-looking framework that PE investors require: four scenario archetypes for how SaaS valuations may evolve from 2026 through 2031, each with quantified assumptions, expected multiple ranges by category, EBITDA margin and growth implications, exit market dynamics, and leading indicators.
A note on methodology: these scenarios are not forecasts. They are structured frameworks for stress-testing investment assumptions and calibrating entry/exit expectations under different conditions. Probability assignments are subjective assessments informed by the data documented in preceding chapters, current market indicators, and historical pattern analysis. No scenario is predicted to materialize in its pure form — the actual outcome will likely blend elements from multiple scenarios. The value of the framework lies in its ability to bound the range of outcomes, identify the category-specific implications of each, and surface the leading indicators that signal which scenario is materializing in real time.
Setting the Stage: Where We Stand in Early 2026
Before modeling forward, it is essential to anchor the scenarios in the current baseline. As of mid-February 2026:
- Median public SaaS revenue growth fell to 12.2% by Q4 2025, with forecasts pointing to further slowdown through at least Q2 2026.
- The broad public SaaS median EV/NTM Revenue stands at an estimated 3.5–3.8x post-sell-off, with the pre-sell-off January figure at 4.01x across 157 companies (as documented in Chapter 1).
- EBITDA multiples for SaaS and software companies are stabilizing in 2025–2026, with private SaaS companies at a median of 22.4x and public software companies closer to ~12.7x.
- Worldwide spending on AI is forecast to total $2.52 trillion in 2026, a 44% increase year-over-year, according to Gartner.
- Software spending growth is projected at 14.7% for 2026, with total software spending remaining above $1.4 trillion.
- SaaS M&A activity reached its highest level on record in 2025, with AI-referenced targets accounting for approximately 72% of all SaaS M&A transactions.
- AlixPartners predicts M&A in the software industry to surge 30–40% year-over-year in 2026 as AI disruption forces mid-market companies to merge or exit.
The critical macro context: Gartner notes that "because AI is in the Trough of Disillusionment throughout 2026, it will most often be sold to enterprises by their incumbent software provider rather than bought as part of a new moonshot project." This observation has profound implications for scenario probability weighting — it favors the augmentation and polarization scenarios over the pure commoditization scenario, at least in the near term.
Scenario 1: AI Commoditization — "Software Deflation"
Subjective Probability: 10–15%
This is the bear case — the scenario in which AI's deflationary forces overwhelm the sector's structural advantages, and the "SaaSpocalypse" narrative proves largely correct.
Core Assumptions
-
AI cost curves continue their exponential decline. The training cost trajectory documented in Chapter 2 — from $100M (OpenAI 2023) to $5M (DeepSeek R1 full cost) to $30 (TinyZero proof-of-concept) — continues unabated. By 2028, enterprise-grade AI applications can be built for under $10,000, enabling an explosion of micro-SaaS competitors and custom internal tools.
-
Vibe coding reaches enterprise-grade maturity. The security vulnerabilities documented in Chapter 2 (Veracode's finding that AI introduces flaws in 45% of cases) are largely resolved by 2028 through improved model architectures and automated security auditing. Non-technical teams routinely build production applications that meet compliance and security thresholds.
-
Seat-based pricing collapses across horizontal SaaS. AI agents systematically replace human users in CRM, project management, and communication tools. The perverse innovation dilemma from Chapter 1 — where better AI features reduce seat count — accelerates faster than pricing model transitions can compensate.
-
Enterprise vendor consolidation accelerates aggressively. Enterprises concentrate their AI budgets, spending more funds on fewer contracts, as Databricks Ventures predicts 2026 will be the year enterprises start consolidating their investments and picking winners. The average number of apps per organization drops from the current 106 (Blacksmith) to 60–70 by 2029, with the heaviest cuts falling on undifferentiated horizontal tools.
-
Foundation model companies enter vertical markets at scale. Following the pattern documented in Chapter 3 — OpenAI and Anthropic launching HIPAA-compliant life sciences tools in January 2026 — foundation model companies systematically target vertical SaaS categories with superior AI capabilities and aggressive pricing.
Valuation Implications by Category
| SaaS Category | EV/Rev 2026 (Baseline) | EV/Rev 2028 | EV/Rev 2031 | EBITDA Margin | Revenue Growth |
|---|---|---|---|---|---|
| Generic Horizontal (Cat. 1) | 2.0–3.0x | 1.5–2.5x | 1.0–2.0x | 5–15% | 0–8% |
| Workflow Automation (Cat. 2) | 2.5–4.0x | 2.0–3.0x | 1.5–2.5x | 8–18% | 2–10% |
| Vertical SaaS – Surface (Cat. 3a) | 2.0–3.5x | 1.5–2.5x | 1.0–2.0x | 5–12% | 0–6% |
| Vertical SaaS – Deep (Cat. 3b) | 3.5–6.0x | 3.0–5.0x | 2.5–4.5x | 15–25% | 8–15% |
| Infrastructure/Security (Cat. 4) | 5.0–8.0x | 4.0–7.0x | 3.5–6.0x | 20–30% | 10–20% |
| Mission-Critical Systems (Cat. 5) | 4.0–6.0x | 3.5–5.0x | 3.0–5.0x | 18–28% | 6–14% |
| SaaS Median (all public) | 3.5–3.8x | 2.5–3.5x | 2.0–3.0x | 10–18% | 5–10% |
Exit Market Dynamics
In this scenario, exit dynamics deteriorate significantly. Many mid-cap software companies become acquisition targets for larger tech titans or private equity firms looking to strip them for their data. A "consolidation winter" emerges, with a 15–20% uptick in "fire sale" acquisitions. Hold periods extend from the typical 4–5 years to 6–8 years for portfolio companies without clear data moats. Sponsor-to-sponsor exits become rare for exposed categories; the dominant exit routes become strategic sale (acqui-hire for talent and data assets) or managed wind-down with cash flow harvesting. The IPO window narrows to essentially zero for conventional SaaS; only AI-infrastructure names can access public markets.
Key Leading Indicators
Monitor these signals to assess whether this scenario is materializing:
- Enterprise SaaS app count per organization drops below 85 by end-2027
- Horizontal SaaS median revenue growth falls below 8% for two consecutive quarters
- Three or more foundation model companies (OpenAI, Anthropic, Google) launch vertical-specific products with >$500M ARR
- AI-generated code security vulnerability rates fall below 15% (from the current 45% per Veracode)
- Per-seat pricing represents less than 50% of new SaaS contracts signed in a given quarter
Scenario 2: AI Augmentation — "Rising Tide"
Subjective Probability: 15–20%
This is the bull case — the scenario in which AI primarily enhances existing SaaS platforms rather than replacing them, and incumbents successfully capture the AI-driven value expansion.
Core Assumptions
-
Incumbents embed AI effectively and capture pricing uplift. The 16% of SaaS providers who monetized AI standalone by late 2025 — and saw 2–3x higher traction, as documented in Chapter 2 — becomes 50%+ by 2028. SaaS companies with proprietary or in-house AI integrations command higher premiums. In 2026, premium multiples go to SaaS businesses with durable growth, strong cash flow, and defensible AI capabilities.
-
Enterprise AI spending continues at 3x+ annual growth. The trajectory documented in the Executive Summary — from $1.7B to $37B between 2023 and 2025 — continues. Global enterprises invest $307 billion on AI solutions in 2025, expected to soar to $632 billion by 2028, with SaaS vendors capturing an increasing share of this spending through integrated AI features.
-
The Rule of 40 evolves toward the Rule of 50–60. Vista Equity Partners' prediction, analyzed in Chapter 2, proves broadly correct for the top tier of SaaS companies. AI automates support, development, and sales functions, expanding EBITDA margins by 500–1,000 bps, while AI-driven pricing uplift maintains or accelerates revenue growth.
-
The pricing model transition succeeds without major revenue disruption. Hybrid models — base subscription plus usage/outcome tiers — win. They provide customer predictability while capturing upside as they scale. Enterprises gradually adopt consumption-based components, creating expansion revenue that more than offsets seat compression.
-
AI-related breaches and governance failures remain manageable. Shadow AI risks are contained through governance tooling, and the AI trust deficit does not trigger a broad enterprise pullback from AI adoption.
Valuation Implications by Category
| SaaS Category | EV/Rev 2026 (Baseline) | EV/Rev 2028 | EV/Rev 2031 | EBITDA Margin | Revenue Growth |
|---|---|---|---|---|---|
| Generic Horizontal (Cat. 1) | 2.0–3.0x | 3.0–5.0x | 4.0–6.0x | 15–25% | 10–18% |
| Workflow Automation (Cat. 2) | 2.5–4.0x | 4.0–7.0x | 5.0–8.0x | 18–28% | 12–22% |
| Vertical SaaS – Surface (Cat. 3a) | 2.0–3.5x | 3.5–5.5x | 4.0–7.0x | 15–22% | 10–18% |
| Vertical SaaS – Deep (Cat. 3b) | 3.5–6.0x | 6.0–10.0x | 8.0–14.0x | 22–35% | 15–25% |
| Infrastructure/Security (Cat. 4) | 5.0–8.0x | 8.0–14.0x | 12.0–20.0x | 25–38% | 20–35% |
| Mission-Critical Systems (Cat. 5) | 4.0–6.0x | 6.0–10.0x | 8.0–14.0x | 22–32% | 12–22% |
| SaaS Median (all public) | 3.5–3.8x | 6.0–8.0x | 8.0–10.0x | 18–28% | 12–20% |
Exit Market Dynamics
In this scenario, exit markets recover robustly by 2028–2029. Select IPOs return for profitable, scaled companies, while most exits are secondary buyouts or dual-track processes. The IPO window reopens for AI-enhanced SaaS companies with $400M+ ARR, 30%+ growth, and demonstrated AI-driven NRR expansion. Sponsor-to-sponsor exits resume at healthy multiples for defensible platforms. Strategic buyers — particularly cross-sector acquirers in payments, healthcare, and industrials — pay premiums for SaaS companies with proven AI integration and proprietary data assets. PE firms that invested in AI-ready platforms during the 2023–2026 trough capture 2.5–3.5x MOIC returns.
Key Leading Indicators
- Top-quartile SaaS NRR exceeds 125% for two consecutive quarters, driven by AI feature upsells
- AI feature monetization revenue exceeds 15% of total SaaS revenue across the public index
- The median Rule of 40 score for public SaaS companies exceeds 35 (up from ~12 currently)
- Three or more large PE-backed SaaS exits at >12x revenue in a single quarter
- Enterprise AI spending growth remains above 30% annually through 2028
Scenario 3: Polarization — "Winners and Losers"
Subjective Probability: 45–55% (BASE CASE)
This is the scenario this report's analysis most strongly supports — and the one that demands the most nuanced strategic response from PE investors. AI disruption is not uniform; it is highly segmented by category, producing the largest valuation spread in SaaS history.
Core Assumptions
-
AI disruption is category-specific, not sector-wide. The risk spectrum from Chapter 3 materializes precisely as described: Categories 1 and 3a face genuine existential pressure; Categories 4 and 5 benefit from AI tailwinds; Categories 2 and 3b depend entirely on execution and positioning.
-
Enterprise budget allocation bifurcates sharply. As Asymmetric Capital Partners' Rob Biederman predicts, "budgets will increase for a narrow set of AI products that clearly deliver results and will decline sharply for everything else." A bifurcation emerges where "a small number of vendors capture a disproportionate share of enterprise AI budgets while many others see revenue flatten or contract."
-
Pricing model transition is uneven and disruptive. Deloitte expects to see "pricing variety and experimentation in 2026 and beyond," and notes that "it could take years for standard practices to emerge, if they ever do." Some SaaS companies successfully transition to hybrid pricing and capture AI value; others lose revenue in the transition gap. The winners execute the pricing transformation documented in Chapter 2's Archetype A model; the losers exhibit Archetype B economics.
-
M&A consolidation creates clear category winners. Global AI spending will jump to nearly half a trillion dollars by 2026, reshaping competition and forcing consolidation. Most mid-market firms can't afford both AI transformation and scale — they'll have to build, buy, or sell. Deal value could reach $600 billion in 2026 from around $440 billion in 2025.
-
The "subsumption" dynamic from Chapter 3 accelerates. Core ERP and CRM systems absorb functionality from smaller, boundary applications. The number of independent SaaS vendors serving any given enterprise function decreases, while the strategic importance (and pricing power) of the surviving vendors increases.
Valuation Implications by Category
| SaaS Category | EV/Rev 2026 (Baseline) | EV/Rev 2028 | EV/Rev 2031 | EBITDA Margin | Revenue Growth |
|---|---|---|---|---|---|
| Generic Horizontal (Cat. 1) | 2.0–3.0x | 1.5–3.0x | 1.0–3.0x | 8–18% | 2–12% |
| Workflow Automation (Cat. 2) | 2.5–4.0x | 3.0–5.0x | 2.5–6.0x | 12–25% | 5–18% |
| Vertical SaaS – Surface (Cat. 3a) | 2.0–3.5x | 1.5–3.0x | 1.0–3.0x | 8–15% | 2–10% |
| Vertical SaaS – Deep (Cat. 3b) | 3.5–6.0x | 5.0–9.0x | 6.0–12.0x | 20–32% | 12–22% |
| Infrastructure/Security (Cat. 4) | 5.0–8.0x | 7.0–12.0x | 10.0–18.0x | 25–35% | 18–30% |
| Mission-Critical Systems (Cat. 5) | 4.0–6.0x | 5.0–9.0x | 7.0–12.0x | 20–30% | 10–18% |
| SaaS Median (all public) | 3.5–3.8x | 4.5–6.5x | 5.0–7.0x | 15–25% | 8–15% |
| Top Quartile | 6.0–8.0x | 10.0–14.0x | 12.0–18.0x | 25–35% | 18–30% |
| Bottom Quartile | 1.0–2.5x | 1.0–2.0x | 0.8–2.0x | 0–12% | (-5%)–8% |
The defining feature of this scenario is the spread. The gap between top-quartile and bottom-quartile SaaS multiples widens from the current ~5x differential to ~10–16x by 2031 — the largest dispersion in the history of the SaaS sector. SaaS Capital confirms the trend is already underway: the spread of valuation multiples has increased significantly. In much of the 2016-2017 period, half of companies traded between 5.5x–8.5x ARR. In the new normal, that range might look like 4x–10x ARR. Under the Polarization scenario, this range extends to approximately 2x–18x by 2031.
The Within-Category Dynamic
Critically, the polarization occurs not just between categories but within them. In every category, the top performers that successfully integrate AI, transition pricing models, and deepen moats will trade at substantial premiums to the median. The bottom performers — those that fail to adapt — will compress toward distressed valuations regardless of category. This creates a stock-picking environment where diligence quality drives the majority of return variance.
To illustrate: consider two hypothetical mid-market vertical SaaS companies, both serving healthcare. Company A owns the system of record for a specific clinical workflow, generates proprietary treatment outcome data, has migrated to volume-based pricing, and deploys a vertical AI engine that physicians rely on daily. Company B provides a scheduling tool for small clinics, relies on per-seat pricing, and has bolted on a ChatGPT-based appointment reminder feature. Both are "vertical healthcare SaaS" in a screening database. Company A is worth 8–12x revenue; Company B is worth 1–2x. The risk spectrum from Chapter 3, combined with the moat assessment from Chapter 4, is the diagnostic tool that distinguishes them.
Exit Market Dynamics
Exit dynamics in the Polarization scenario are bifurcated. For winners (Categories 4, 5, and upper-tier 3b): premium strategic sales, sponsor-to-sponsor at healthy multiples, and selective IPO access. Cross-sector deals emerge as incumbents in payments, healthcare, and industrials acquire SaaS + AI to stay competitive. For losers (Categories 1, 3a, and lower-tier 2): Deals that do happen are at lower prices. Software companies aren't selling for 25x EBITDA anymore — "they're selling closer to 15x EBITDA," according to Thoma Bravo's Orlando Bravo. Distressed sales, acqui-hires, and managed wind-downs dominate the exit landscape for exposed categories. Earnout structures become standard for mid-tier exits, with 10–30% of total consideration deferred. Smaller targets trade with tighter diligence and more earnout structures.
Key Leading Indicators
- Top-quartile to bottom-quartile SaaS valuation spread exceeds 8x (from ~5x currently)
- Category-specific NRR divergence: top categories >115%, bottom categories <95%
- M&A transaction volume increases >25% YoY, with rising proportion of "distressed" or "fire sale" deals
- PE returns show >2x dispersion between best-performing and worst-performing SaaS fund vintages
- Enterprise vendor count per organization declines by >15% over 24 months
Scenario 4: Regulated / Mission-Critical Resilience — "The Fortress Holds"
Subjective Probability: 15–20%
This is the "safe harbor" scenario — the one that materializes if AI-related governance failures, security breaches, and regulatory backlash slow AI adoption and drive enterprises toward proven, compliant vendors.
Core Assumptions
-
Regulatory complexity increases faster than anticipated. The EU AI Act, evolving HIPAA requirements, financial services AI oversight, and potential US federal AI legislation create a compliance burden that favors established software vendors with existing certification infrastructure. Gartner forecasts that "by 2030, at least 40% of enterprise SaaS spend will shift toward usage-, agent-, or outcome-based pricing" — but in this scenario, regulatory caution slows the shift, preserving subscription economics for compliant vendors.
-
AI-related breaches and governance failures trigger backlash. As documented in Chapter 4, shadow AI risks are significant: one in five organizations has reported a breach due to shadow AI, with $670,000 in additional average breach costs. In this scenario, several high-profile AI-related breaches occur in 2026–2027, causing enterprise risk aversion to spike and CIO priorities to shift from innovation to security and compliance.
-
Enterprise risk aversion favors proven vendors. The trust mechanism documented in Chapter 4 becomes the dominant purchasing criterion. Security will remain one of the most defensible categories of IT spend for CIOs in 2026. Enterprises choose established vendors with track records over AI-native startups without enterprise credentials.
-
Compliance costs rise, creating a barrier to entry for new vendors. Obtaining HIPAA, SOC 2, FedRAMP, ISO 27001, and EU AI Act certifications requires significant investment in time and resources. AI-native startups that cannot afford or sustain these certifications are locked out of enterprise sales, reducing competitive pressure on established vendors.
-
"Boring but safe" becomes the PE investment thesis of the cycle. Deal flow concentrates in regulated verticals — healthcare IT, fintech, GRC, compliance automation — where regulatory moats create durable pricing power and predictable cash flows.
Valuation Implications by Category
| SaaS Category | EV/Rev 2026 (Baseline) | EV/Rev 2028 | EV/Rev 2031 | EBITDA Margin | Revenue Growth |
|---|---|---|---|---|---|
| Generic Horizontal (Cat. 1) | 2.0–3.0x | 2.0–3.5x | 2.0–4.0x | 10–20% | 5–12% |
| Workflow Automation (Cat. 2) | 2.5–4.0x | 3.0–5.0x | 3.5–5.5x | 15–25% | 8–15% |
| Vertical SaaS – Surface (Cat. 3a) | 2.0–3.5x | 2.5–4.0x | 2.5–4.5x | 10–18% | 5–12% |
| Vertical SaaS – Deep (Cat. 3b) | 3.5–6.0x | 5.0–8.0x | 6.0–10.0x | 20–30% | 12–20% |
| Infrastructure/Security (Cat. 4) | 5.0–8.0x | 8.0–12.0x | 10.0–15.0x | 25–35% | 18–28% |
| Mission-Critical Systems (Cat. 5) | 4.0–6.0x | 6.0–10.0x | 8.0–14.0x | 22–32% | 12–20% |
| GRC / Compliance SaaS | 4.0–7.0x | 7.0–10.0x | 8.0–12.0x | 20–32% | 15–25% |
| SaaS Median (all public) | 3.5–3.8x | 5.0–6.5x | 5.5–7.5x | 15–25% | 8–16% |
The distinctive feature of this scenario is the premium expansion for compliance and security software. GRC, cybersecurity, AI governance, and regulated vertical SaaS see multiple expansion that outpaces the broader market, while less-regulated categories experience modest recovery but not premium re-rating.
Exit Market Dynamics
Exit dynamics favor PE firms specializing in regulated verticals. Healthcare IT, fintech, GRC, and compliance automation targets command premium exit multiples to strategic buyers who need regulatory-compliant platforms. The IPO window opens selectively for security and compliance leaders (following the pattern of CrowdStrike and Palo Alto Networks). Profitable, recurring-revenue businesses operating in essential segments — such as cybersecurity, infrastructure software, and AI-enabling tools — are likely to see mild multiple expansion.
Key Leading Indicators
- Two or more high-profile enterprise AI breaches result in >$100M in damages or regulatory fines
- Enterprise CIO priorities shift measurably toward security/compliance and away from innovation
- EU AI Act enforcement actions begin in earnest (expected late 2026)
- AI governance software category grows >40% annually for two or more consecutive years
- PE fund allocation to regulated verticals exceeds 30% of new SaaS deployment (from ~15% currently)
| Dimension | Scenario 1: Commoditization | Scenario 2: Augmentation | Scenario 3: Polarization (BASE) | Scenario 4: Fortress |
|---|---|---|---|---|
| Subjective Probability | 10–15% | 15–20% | 45–55% | 15–20% |
| Median EV/Rev (2028) | 2.5–3.5x | 6.0–8.0x | 4.5–6.5x | 5.0–6.5x |
| Median EV/Rev (2031) | 2.0–3.0x | 8.0–10.0x | 5.0–7.0x | 5.5–7.5x |
| Top Quartile EV/Rev (2031) | 4.0–6.0x | 15.0–20.0x | 12.0–18.0x | 10.0–15.0x |
| Bottom Quartile EV/Rev (2031) | 0.5–1.5x | 4.0–6.0x | 0.8–2.0x | 2.0–4.0x |
| Revenue Growth Range | 2–10% | 12–25% | 5–20% (wide spread) | 8–16% |
| EBITDA Margin Range | 5–18% | 18–32% | 10–30% (wide spread) | 15–28% |
| Rule of 40 Evolution | Rule of 20–30 | Rule of 45–60+ | Rule of 25–55 (bifurcated) | Rule of 30–45 |
| Dominant Exit Route | Strategic sale / acqui-hire | IPO / sponsor-to-sponsor / strategic | Bifurcated: premium for winners, distressed for losers | Regulated vertical premium exits |
| IPO Window | Closed for conventional SaaS | Open for AI-enhanced leaders | Selectively open for top quartile | Open for security/compliance leaders |
| Hold Period Implication | Extended (6–8 years) | Standard (3–5 years) | Category-dependent (3–7 years) | Standard to extended (4–6 years) |
| PE MOIC Range (Median) | 0.7–1.3x | 2.5–3.5x | 1.5–2.5x (median); 3–5x (top quartile winners) | 2.0–3.0x |
| Key Risk to PE | Write-downs on exposed holdings | Overpaying at "recovery" multiples | Miscategorizing a "loser" as a "winner" | Missing growth upside by overweighting safety |
| Key Leading Indicators | App count <85; AI code security <15%; vibe coding enterprise-grade | AI NRR uplift >125%; Rule of 40 >35; AI revenue >15% | Top-to-bottom spread >8x; M&A surge >25% YoY; NRR divergence | AI breaches >$100M; EU AI Act enforcement; CIO pivot to compliance |
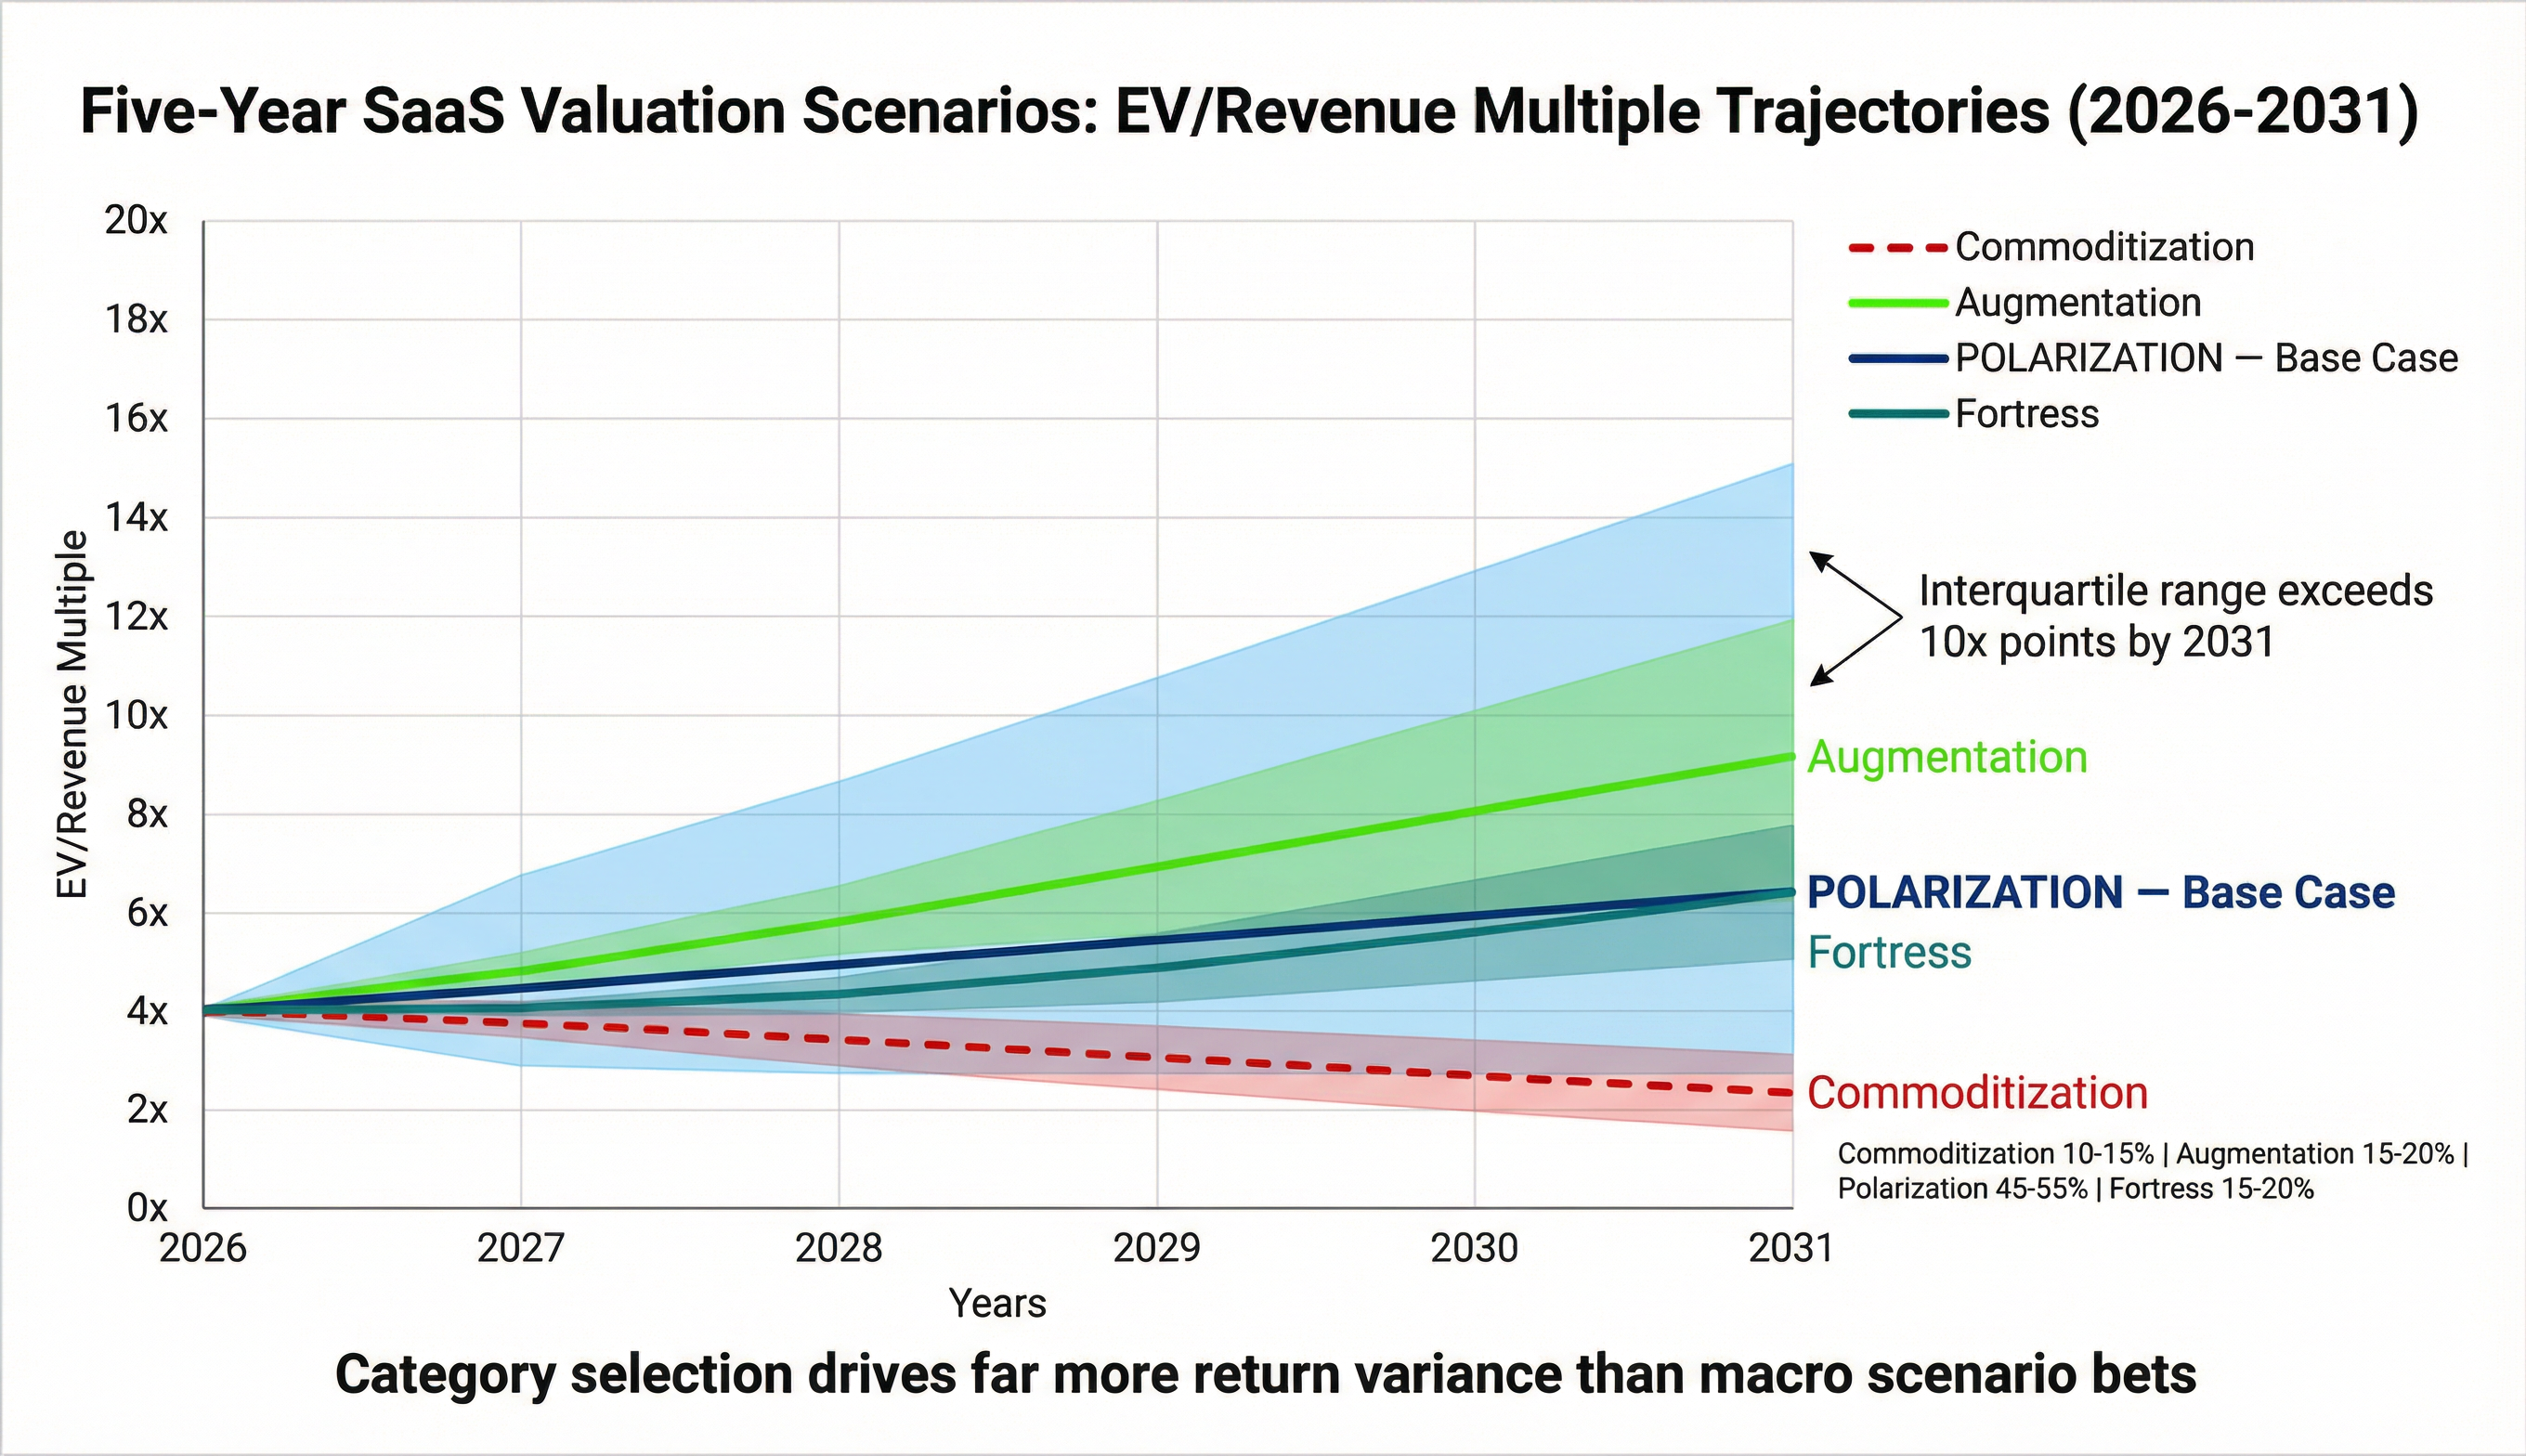
Reading the Chart
The most important feature is not the median lines — it is the widening confidence band around the Polarization base case. By 2031, the interquartile range within the base case exceeds 10x points (from ~2x to ~15x), dwarfing the scenario-to-scenario spread at the median level. This visualization underscores the central thesis: category selection and stock-picking within categories will drive far more return variance than macro scenario bets.
Scenario Interactions and Hybrid Outcomes
In practice, the actual market outcome will blend elements from multiple scenarios simultaneously. Several interaction effects deserve explicit analysis:
The "2026 Renewal Cliff" Dynamic
Bessemer warns that "copilots offering advice without closing the loop live in dangerous soft ROI territory" and that "as 2025 pilots hit 2026 renewals, pricing must reflect actual value, not promise." The 2026–2027 renewal cycle for AI features purchased in 2024–2025 will be the single most important near-term test of whether Scenario 2 (Augmentation) or Scenario 1 (Commoditization) is materializing. If enterprises renew AI features at maintained or increased pricing, it validates the augmentation thesis. If renewal rates disappoint and enterprises consolidate, it accelerates commoditization dynamics. PE investors should track AI feature renewal rates as a leading indicator with 6–12 month forward signaling power.
The Timing Dimension: Scenarios May Sequence Rather Than Persist
A plausible hybrid outcome is that Scenario 1 dynamics dominate in 2026–2027 (as the sell-off and consolidation play out), followed by Scenario 3 dynamics in 2028–2029 (as the bifurcation crystallizes), and Scenario 2 dynamics for the winners in 2030–2031 (as surviving platforms capture expanded TAM). This sequential interpretation suggests that PE entry timing matters significantly: buying in 2026 at trough multiples, holding through the consolidation phase, and exiting in 2030–2031 as the winners re-rate could produce returns consistent with the Augmentation scenario even if the intermediate path passes through Commoditization dynamics.
The "Regulated Overlay"
Scenario 4 is unique in that it can co-exist with any of the other three scenarios as an overlay. Regulatory complexity increases regardless of which macro scenario materializes — it is driven by policy dynamics independent of AI adoption pace. This means that the "compliance premium" documented in Scenario 4 likely persists across all scenarios, making regulated vertical SaaS and security/compliance software a structurally overweight position in any PE SaaS portfolio.
PE Portfolio Implications: Stress-Testing Under Each Scenario
To operationalize these scenarios, PE teams should stress-test every SaaS holding and target under all four archetypes. The following process is recommended:
Step 1: Classify the Asset
Use the Chapter 3 risk spectrum and Chapter 4 decision tree to classify the target into one of the six sub-categories (1, 2, 3a, 3b, 4, 5).
Step 2: Apply Scenario-Specific Multiples
For each scenario, identify the expected EV/Revenue range from the tables above for the relevant category. Calculate implied enterprise value at entry, mid-hold (2028), and exit (2031).
Step 3: Model the Revenue Bridge
For each scenario, model the revenue trajectory using the growth rate ranges. Incorporate the pricing model transition risk: if the target generates >70% of revenue from per-seat pricing, model a 20–40% seat reduction over the hold period and assess whether hybrid pricing components compensate.
Step 4: Calculate Scenario-Weighted Returns
Apply the probability weights (10–15%, 15–20%, 45–55%, 15–20%) to calculate probability-weighted returns across all four scenarios. The resulting expected MOIC should exceed the fund's minimum return threshold by a sufficient margin to compensate for scenario risk.
Step 5: Identify the "Kill Scenario"
For each investment, identify the single scenario that produces the worst outcome. If that scenario has a probability >15% and the loss exceeds 30% of invested capital, the investment may require additional structuring (earnouts, downside protection, co-investment) or a lower entry multiple to proceed.
Illustrative Example: Stress-Testing a Deep Vertical SaaS Target
Consider a PE target classified as Category 3b (Deep Vertical SaaS), acquired at 5.0x NTM revenue with $80M in revenue:
| Scenario | Probability | Exit Rev (2031) | Exit Multiple | Exit EV | Entry EV ($400M) | MOIC |
|---|---|---|---|---|---|---|
| Commoditization | 12% | $120M (8% CAGR) | 3.5x | $420M | $400M | 1.1x |
| Augmentation | 18% | $160M (15% CAGR) | 11.0x | $1,760M | $400M | 4.4x |
| Polarization (Base) | 50% | $145M (13% CAGR) | 8.0x | $1,160M | $400M | 2.9x |
| Fortress | 20% | $140M (12% CAGR) | 9.0x | $1,260M | $400M | 3.2x |
| Probability-Weighted | 100% | $1,119M | $400M | 2.8x |
This probability-weighted 2.8x MOIC, with limited downside in the bear case (1.1x) and significant upside potential (4.4x), illustrates why deep vertical SaaS represents the highest alpha opportunity in the current market — provided the target genuinely qualifies as Category 3b through the moat assessment framework of Chapter 4.
The Critical Inflection Points: When Scenarios Diverge
Between now and 2031, three inflection points will determine which scenario dominates:
Inflection Point 1: The 2026–2027 AI Renewal Cycle (12–18 months out)
As documented above, the first large-scale renewal cycle for AI features will reveal whether enterprises perceive genuine ROI. Positive renewals and expansion → Augmentation or Polarization. Disappointing renewals and consolidation → Commoditization dynamics accelerate.
Inflection Point 2: Foundation Model Market Structure (24–36 months out)
By 2028, the competitive landscape among foundation model providers will clarify. If OpenAI, Anthropic, Google, and open-source alternatives converge on similar capabilities at similar price points (as Chapter 4 documented is already occurring), the value accrues to the application and data layer — favoring SaaS incumbents. If one or two foundation model companies achieve durable differentiation and begin building vertical applications (akin to Google's integration strategy), the threat to vertical SaaS intensifies.
Inflection Point 3: Regulatory Crystallization (36–48 months out)
By 2029, the global regulatory framework for AI will have substantially crystallized. The EU AI Act will be fully enforced, US policy direction will be clearer, and sector-specific regulations (HIPAA AI, financial services AI) will have matured. The scope and stringency of these regulations will determine whether Scenario 4 dynamics become a dominant feature of the landscape or remain a secondary overlay.
Chapter Synthesis: What PE Must Take Forward
This chapter has constructed four scenario archetypes spanning the full range of plausible outcomes for SaaS valuations over the 2026–2031 period. The key conclusions for PE investors are:
-
The base case is Polarization, not uniform compression or recovery. The most probable outcome (45–55% weighted) is that AI disruption is highly segmented, producing the widest valuation spread in SaaS history. The median multiple may remain compressed at 5–7x, but the spread between winners (12–18x) and losers (0.8–2.0x) widens dramatically.
-
Category selection drives 80% of returns. Across all four scenarios, the variance between category performance exceeds the variance between scenario outcomes. Investing in the right category at the wrong time produces better returns than investing in the wrong category at the right time.
-
The current trough creates a historic buying opportunity — for the right assets. Post-sell-off multiples of 3.5–3.8x median represent the deepest discount since the pre-pandemic baseline. For PE firms that can accurately classify targets using the frameworks of Chapters 3 and 4, the probability-weighted returns are compelling.
-
Timing risk is manageable through scenario monitoring. The leading indicators identified for each scenario provide a real-time monitoring framework that enables PE firms to adjust hold-period plans, pricing model transformation timelines, and exit strategies as the market clarifies.
-
Downside protection comes from moat depth, not sector avoidance. The correct risk management strategy is not to avoid SaaS — it is to invest in SaaS companies whose moats (proprietary data, deep integration, regulatory lock-in, security requirements, ecosystem switching costs) insulate them across multiple scenarios. Companies that pass the Chapter 4 moat assessment with three or more strong mechanisms produce positive returns in all four scenarios.
-
The compliance premium is a structural feature across all scenarios. Regulated vertical SaaS and security/compliance software maintain or expand multiples regardless of which macro scenario materializes, making these categories the lowest-risk allocations in the current environment.
The next chapter — "Strategic Playbook for PE-Owned SaaS Companies" — translates these scenario frameworks into concrete operational actions. Where this chapter provided the "what might happen" framework for stress-testing valuations, Chapter 6 will provide the "what to do about it" playbook: specific pre-acquisition diligence adjustments, post-acquisition operating priorities by functional area, pricing migration roadmaps, AI transformation milestones, and pre-exit positioning strategies calibrated to the scenarios documented here. Every recommendation in Chapter 6 is designed to be actionable within the first 100 days of ownership and to improve the portfolio company's positioning across the full range of valuation scenarios presented in this chapter.
Chapter 6: Strategic Playbook for PE-Owned SaaS Companies
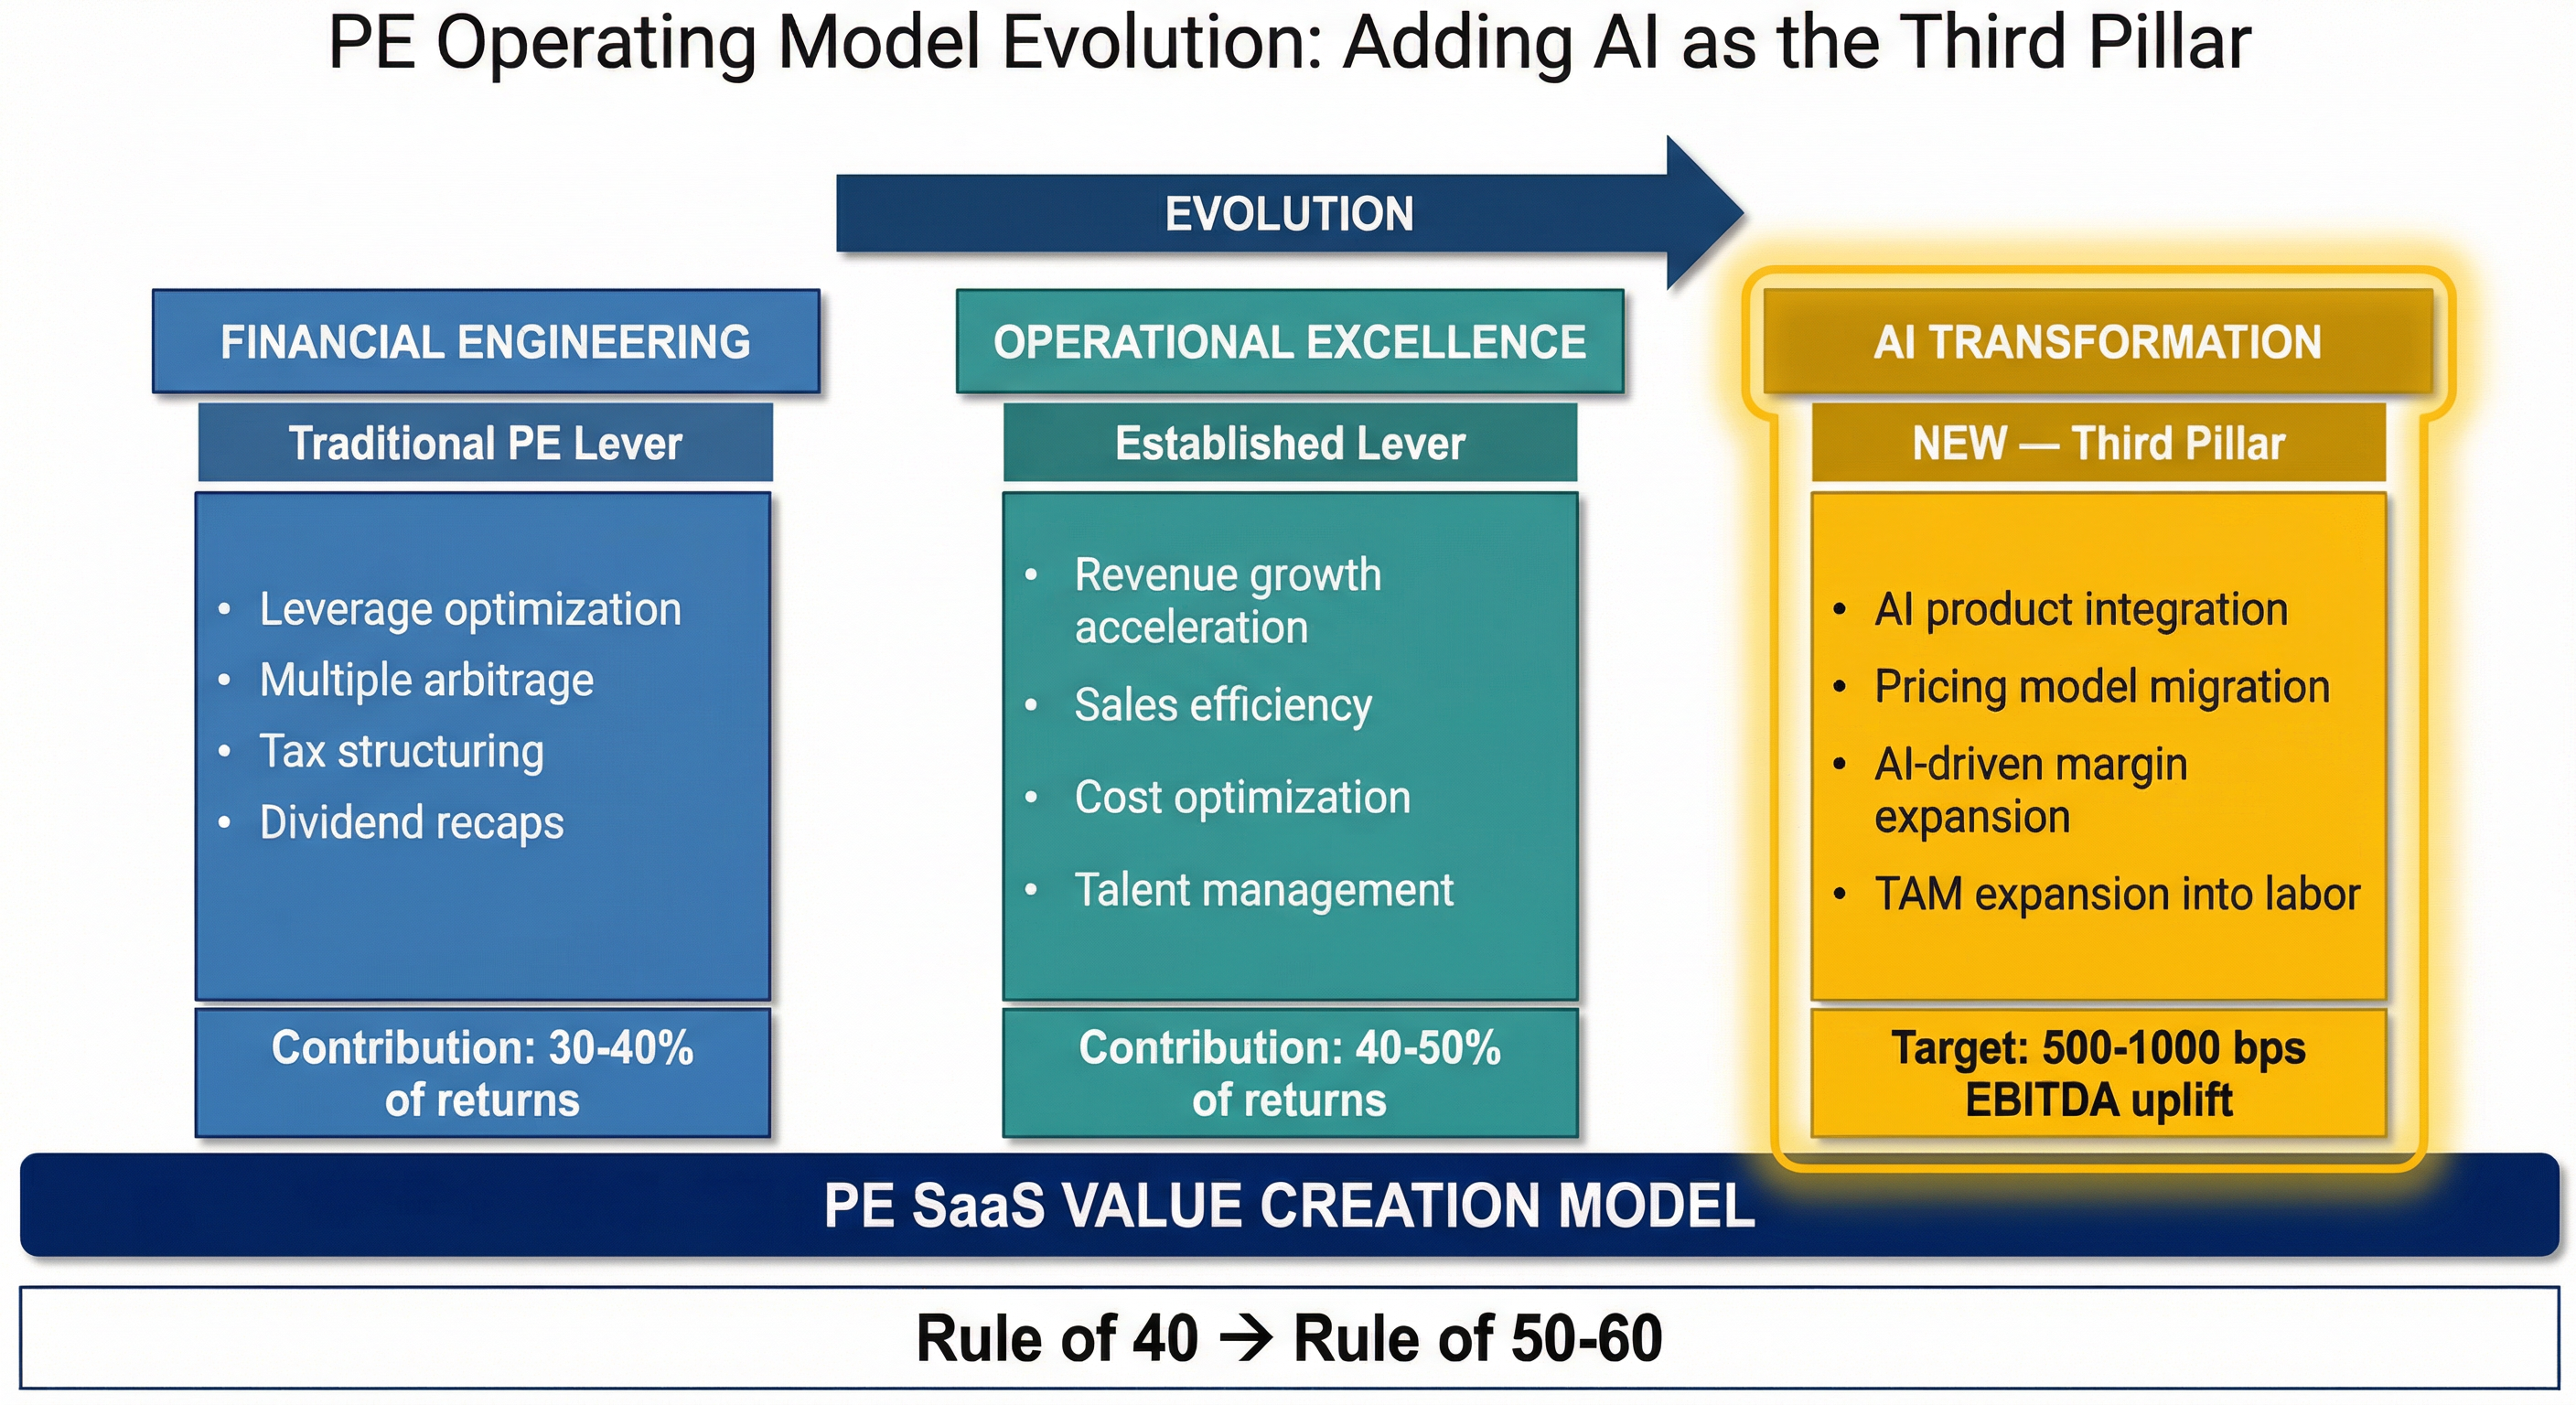
Phase 1: Pre-Acquisition Diligence Adjustments. New diligence questions PE funds must add to their playbook in the AI era: (a) AI Moat Assessment — use the decision tree from Chapter 4 to classify the target as 'Fortress,' 'Adapter,' or 'Exposed'; (b) NRR Decomposition — AI disruption shows up first in net revenue retention and gross margins before EBITDA drops; by the time EBITDA drops, enterprise value may have already evaporated; (c) Pricing Model Resilience — assess whether seat-based revenue will survive the shift to usage/outcome-based models; model the revenue impact of 30–50% seat reduction over 3–5 years; (d) Data Asset Audit — is the target sitting on proprietary data that creates a defensible moat, or is its data generic/replicable? (e) Competitive Threat Mapping — identify not just SaaS competitors but AI-native disruptors (OpenAI/Anthropic entering vertical markets, as with HIPAA-compliant life sciences tools); (f) Customer Concentration Risk — which customers are most likely to build internal AI alternatives?
Phase 2: Post-Acquisition Operating Priorities (First 100 Days and Beyond). Structured by functional area: (a) Product Roadmap Transformation — decide whether to pursue 'AI-first' (rebuild around AI-native architecture) vs. 'AI-enhanced' (layer AI capabilities onto existing platform). For most PE-owned SaaS, 'AI-enhanced' is the right initial path because it preserves existing value while building toward AI-native. Reference McKinsey finding: only 16% of SaaS incumbents have commercialized AI as stand-alone products, but those that have see 2–3x higher customer traction. (b) Pricing and Packaging Evolution — 83% of AI-native SaaS companies already offer usage-based pricing. PE owners must begin testing hybrid pricing models immediately. Don't wait for the market to force it. Practical guidance: start with AI features as add-on SKUs (like Adobe's $125M AI revenue in Q1 2025), then migrate to hybrid base+usage models. (c) AI Operating Model — build or leverage a centralized AI center of excellence, following the Apollo/Vista model. 40% of PE firms still manage AI at the portfolio company level (decentralized), which is insufficient for scale. (d) Talent and Organization — new skills needed: prompt engineering, MLOps, AI product management. Balance insourcing strategic skills with partnerships for speed. (e) Cost Structure Optimization — use AI to drive EBITDA expansion through support automation, development acceleration, and go-to-market efficiency. Target: 500–1000bps margin improvement within 24 months.
Phase 3: Pre-Exit Positioning. (a) AI Narrative Development — integrate AI into the sell-side narrative. SaaS M&A hit 746 transactions in Q3 2025, up 26% YoY, largely driven by AI adoption. CEOs who clearly articulate AI's impact on operations and product roadmap stand out. (b) Valuation Premium Capture — proprietary or in-house AI integrations command higher premiums than ChatGPT wrappers. Demonstrate measurable AI impact: NRR improvement, margin expansion, customer ROI. (c) Exit Route Optimization — expect exit dynamics to include more earnout structures and tighter diligence; prepare for longer buyer evaluation cycles. Strategic buyers (especially cross-sector acquirers in payments, healthcare, and industrials acquiring SaaS+AI) may pay more than sponsor-to-sponsor.
The preceding five chapters have established the empirical record, the economic mechanics, the risk segmentation, the defensibility framework, and the valuation scenarios. This chapter translates all of it into action. It is the chapter PE partners will print out and bring to operating meetings — structured by investment lifecycle phase, with every recommendation designed to be testable, implementable, and tied to measurable outcomes.
The imperative is clear. The next wave of value creation won't come from financial engineering alone — it will come from strategic AI adoption across the deal lifecycle. As Chapter 1 documented, the February 2026 sell-off erased over $800 billion in market capitalization in a single week. As Chapter 5's Polarization scenario demonstrated, the gap between top-quartile and bottom-quartile SaaS multiples is projected to widen to 10–16x by 2031 — the largest dispersion in SaaS history. In this environment, the PE operating model that worked from 2015 to 2023 — acquire recurring revenue, optimize cost structure, exit at a healthy multiple — is no longer sufficient. AI is establishing itself as a third pillar of value enhancement alongside financial engineering and operational excellence. Funds that fail to integrate this third pillar will find their SaaS portfolios stranded on the wrong side of the Polarization.
This chapter is organized around three investment lifecycle phases: pre-acquisition diligence, post-acquisition operating priorities, and pre-exit positioning. Each section provides specific tools, timelines, and success metrics. Together, they constitute a comprehensive AI-era operating playbook for PE-owned SaaS companies.
Phase 1: Pre-Acquisition Diligence Adjustments
The most value-destructive decisions in PE occur before a deal closes — not after. Overpaying for a company whose moat is evaporating, or underpaying for a company whose defensibility the market has mispriced, are symmetric errors that the AI disruption makes more likely and more consequential. The most effective private equity firms and corporate dealmakers use diligence to answer five key questions that evaluate the AI risk and opportunities of a potential target. This section updates the PE diligence framework for the AI era with six new assessment modules.
1a. AI Moat Assessment: Classifying the Target
Every SaaS diligence process must now begin with a classification exercise using the Chapter 4 decision tree. The output is a four-category classification — Fortress, AI-Enhanced Winner, Adapter, or Exposed — that directly calibrates entry pricing, hold-period expectations, and operating plan priorities.
The decision tree asks five sequential questions: (1) Does the target own proprietary, customer-generated data that doesn't exist in the public domain? (2) Does the target have deep process integration at Level 3 or Level 4 (as defined in Chapter 4's integration framework)? (3) Is the target in a regulated industry with compliance lock-in? (4) Is more than 50% of revenue from seat-based pricing with no usage/outcome-based component? (5) If AI features were removed, would the product still be valuable?
The classification maps directly to the valuation scenarios in Chapter 5. A "Fortress" target at 5x revenue may be priced at trough levels under the Polarization base case, with probability-weighted upside to 8–12x at exit. An "Exposed" target at 5x revenue is overpriced in every scenario. During the due diligence for a leading specialty workflow software company, one team determined that AI was more of an opportunity than a risk — the product was entrenched in customer workflows with high switching costs, held defensible data/workflow moats, and management treated AI as a board-level priority.
Operational implementation: Require every deal memo to include a completed AI Moat Assessment with the target's decision-tree classification, supported by evidence for each branching question. Assign accountability to the deal lead with validation from an AI-focused operating partner or external advisor. Timeline: complete within the first two weeks of diligence, before financial model construction begins.
1b. NRR Decomposition: Detecting AI Disruption Early
AI disruption does not show up first in EBITDA. It shows up first in net revenue retention (NRR) and gross margins. By the time EBITDA drops, enterprise value may have already evaporated. This is because AI-driven competitive pressure manifests sequentially: customers first reduce expansion (lower upsell), then fail to renew add-on modules (lower cross-sell), then reduce seat count (contraction), and finally churn entirely. Each step degrades NRR before flowing through to EBITDA with a 12–18 month lag.
The diligence protocol must therefore decompose NRR into its constituent components:
- Gross retention rate (GRR): What percentage of existing ARR is retained before any expansion? GRR below 90% is a red flag; below 85% suggests active churn from competitive displacement.
- Expansion rate: What percentage of existing customers are expanding their spend? Declining expansion rates are the earliest signal of AI disruption — customers are buying AI tools elsewhere or building internally instead of upselling within the platform.
- Contraction rate: Are customers reducing seat counts or downgrading plans? This is the direct signal of the seat compression dynamic documented in Chapter 1.
- Logo churn rate: How many customers are leaving entirely? Accelerating logo churn in the SMB segment often precedes enterprise churn by 6–12 months.
Operational implementation: Require cohort-based NRR analysis (not just blended NRR) going back at least eight quarters. Look specifically for declining expansion rates in the most recent two quarters — this is the leading indicator. If expansion has declined by more than 5 percentage points YoY while the target claims no AI impact, the target is either unaware of the threat or misrepresenting it.
1c. Pricing Model Resilience: Stress-Testing Seat-Based Revenue
As Chapter 2 documented and the Polarization scenario in Chapter 5 reinforced, per-seat pricing is the single greatest structural vulnerability for SaaS companies in the AI era. Per-seat pricing norms buckle under this reality. In the face of rapidly evolving agentic capabilities, SaaS buyers will seek comfort in pricing clearly linked to measurable outcomes; while SaaS sellers will embrace pricing disconnected from dwindling seat counts.
The diligence protocol must model the revenue impact of seat reduction scenarios:
Scenario A (Mild): 15–20% seat reduction over 3 years as AI tools augment but don't replace human workers. Impact: revenue declines 15–20% unless offset by pricing model changes.
Scenario B (Moderate): 30–40% seat reduction over 3–5 years as AI agents take over routine tasks in CRM, project management, and support. This is the base case for horizontal SaaS (Category 1 from Chapter 3). Impact: revenue declines 30–40% unless the company has migrated to hybrid pricing.
Scenario C (Severe): 50%+ seat reduction over 5 years in categories where AI agents can fully substitute for human workflows. Impact: business model viability is in question without complete pricing transformation.
For each scenario, model whether the target's current or planned pricing evolution (credit-based, usage-based, outcome-based) can compensate. Out of 500 companies in the PricingSaaS 500 Index, 79 now offer a credit model, up from 35 at the end of 2024 — up 126% year-over-year. If the target generates more than 80% of revenue from per-seat pricing and has no credible transition plan, price the risk into the entry multiple.
Operational implementation: Build a seat-reduction sensitivity table into every financial model for SaaS targets. The table should show implied revenue, EBITDA, and enterprise value under each scenario at Years 1, 3, and 5. Any deal proceeding without this analysis is underwriting risk it hasn't priced.
1d. Data Asset Audit: Distinguishing Real Moats from Illusions
Chapter 4 established that only customer-generated proprietary data constitutes a durable moat — generic and initial-access data have been commoditized by foundation models. The diligence protocol must apply the three-part data moat test:
- Could a competitor with access to frontier AI models and unlimited capital replicate this data within 24 months? Request a detailed data inventory during diligence — not just volume metrics, but data provenance, uniqueness, and competitive replicability.
- Is the data generated by customers using the product? Customer-generated data (patient treatment outcomes, construction project histories, financial transaction patterns) creates a compounding flywheel. Data the company purchased or scraped does not.
- Does the data exist in the public domain in sufficient volumes to train a competitive model? If the answer is yes, the data moat is already commoditized regardless of what the target claims.
Operational implementation: Engage a technical advisor (data scientist or AI specialist) during diligence to independently assess data asset defensibility. This is a new diligence workstream that did not exist before 2024 and is now essential for any SaaS deal. Budget approximately $50K–100K for an independent data moat assessment; the cost is trivial relative to the value at risk.
1e. Competitive Threat Mapping: Beyond Traditional SaaS Competitors
Traditional competitive analysis focuses on other SaaS vendors serving the same market. In the AI era, this is dangerously incomplete. The competitive threat landscape now includes three additional vectors:
AI-native disruptors: Foundation model companies (OpenAI, Anthropic, Google) are entering vertical markets directly. As Chapter 3 documented, both OpenAI and Anthropic launched HIPAA-compliant life sciences tools in January 2026 that directly compete with established healthcare SaaS. Map which foundation model companies have entered or could plausibly enter the target's vertical.
Customer build-vs-buy risk: As Chapter 1 documented with the "vibe coding" phenomenon, enterprises can now build bespoke internal tools using AI coding platforms. Assess which customer segments are most likely to build internally — typically tech-forward enterprises with strong engineering teams. If the target's top 20 customers include five or more with significant in-house engineering capability, the build-vs-buy risk is material.
Platform subsumption risk: As Chapter 3 documented, core ERP and CRM systems will increasingly absorb functionality from smaller boundary applications. Assess whether the target's functionality could be subsumed by a larger platform's AI-powered expansion.
Operational implementation: Produce a "360-degree threat map" for every SaaS target that covers: (1) traditional SaaS competitors, (2) AI-native disruptors, (3) customer build-vs-buy risk, and (4) platform subsumption risk. Assign probability and timeline estimates to each threat vector. This map becomes a living document updated quarterly during the hold period.
1f. Customer Concentration Risk: AI Build-vs-Buy Exposure
The final diligence module assesses which specific customers are most likely to reduce or eliminate their dependency on the target by building internal AI alternatives. Key indicators of high build-vs-buy risk include:
- Customer has 500+ in-house engineers
- Customer has a dedicated AI/ML team
- Customer's CEO or CTO has publicly discussed AI-first strategy
- Customer's industry is experiencing rapid AI adoption (tech, financial services, media)
- Customer's use case with the target is relatively simple (reporting, basic analytics, standard workflows)
If the top 10 customers by ARR collectively represent more than 30% of revenue AND more than half of them exhibit three or more of these indicators, the concentration risk is material and must be priced into the deal.
Phase 2: Post-Acquisition Operating Priorities
2a. Product Roadmap Transformation: AI-First vs. AI-Enhanced
The most consequential product decision for any PE-owned SaaS company is whether to pursue an AI-first or AI-enhanced strategy:
- AI-first means rebuilding the product around an AI-native architecture — where AI agents are the primary interface and the traditional UI becomes secondary. This approach is appropriate for AI-native companies or targets classified as "Exposed" that need radical transformation to survive.
- AI-enhanced means layering AI capabilities onto the existing platform — adding AI-powered features, copilots, and automation while preserving the existing product's value, data moats, and customer workflows. This approach is appropriate for targets classified as "Fortress" or "AI-Enhanced Winner" that already possess durable moats.
For most PE-owned SaaS companies, AI-enhanced is the right initial path because it preserves existing enterprise value while building toward AI-native capabilities over the hold period. The risk of AI-first for an established product is destroying existing customer relationships, integration depth, and regulatory compliance in pursuit of an unproven AI architecture.
Adobe exited the first quarter of 2025 with $125 million in revenue from stand-alone AI products. While still a very small share of the company's record $5.7 billion in total revenue that quarter, the company expects AI-fueled business to double by the end of the fiscal year. Although only 16 percent of SaaS incumbents have commercialized AI applications as stand-alone products... — those that have see 2–3x higher customer traction. This data point is instructive: the vast majority of incumbents have not yet monetized AI successfully, but those who have moved early are seeing disproportionate rewards.
Operational implementation — First 100 Days:
- Days 1–30: AI Capability Assessment. Inventory the target's current AI capabilities (if any), data assets, technical infrastructure, and talent. Score each on a 1–5 maturity scale across five dimensions: strategy, data readiness, infrastructure, talent, and governance.
- Days 30–60: AI Roadmap Development. Based on the assessment, develop a 24-month AI product roadmap with three tiers: (a) "Quick wins" — AI features that can be deployed within 90 days using existing data and third-party APIs (e.g., AI-powered search, document summarization, automated reporting). (b) "Core enhancements" — AI features that leverage proprietary data and require 6–12 months to develop (e.g., predictive analytics, industry-specific AI models, AI-powered workflow automation). (c) "Transformative capabilities" — AI-native features that fundamentally expand the product's TAM and require 12–24 months (e.g., vertical AI agents, outcome-based service delivery, agentic workflows).
- Days 60–100: First Quick Win Deployment. Ship at least one AI-powered feature within the first 100 days. The feature doesn't need to be transformative — it needs to signal to customers, employees, and the market that the company is AI-capable. Track adoption and usage metrics from day one.
2b. Pricing and Packaging Evolution
The SaaS pricing landscape is undergoing its most fundamental transformation since the shift from perpetual licenses to subscriptions. 2025 will be remembered as the year when seemingly everybody lost confidence in their pricing. Among the top 500 players in SaaS and AI with transparent pricing, there were more than 1,800 pricing changes in 2025 alone — a staggering 3.6 per company.
PE owners must not wait for the market to force pricing model transitions. The data shows the transition is already underway: Usage-based pricing continues its rapid ascent, now appearing in 43% of SaaS pricing models analyzed — up 8 percentage points from 2024. The most significant shift in 2025 SaaS pricing data is the rise of hybrid models — combining elements of per-user, usage-based, and flat-rate pricing. 61% of companies now employ some form of hybrid pricing, up from 49% in 2024.
The practical pricing migration roadmap for PE-owned SaaS companies should follow a three-stage approach:
Stage 1 (Months 1–6): AI Features as Add-On SKUs. Package initial AI capabilities as premium add-ons to existing subscription plans. This approach preserves the predictable base subscription revenue while testing customer willingness to pay for AI features. Adobe's model — $125M in AI product revenue layered on top of a $5.7B subscription base — provides the template. Set the add-on price to cover AI inference costs plus a 40–60% margin.
Stage 2 (Months 6–18): Hybrid Base + Usage Model. Introduce credit-based or usage-based pricing components alongside the base subscription. Credits help vendors and customers manage AI economics. They give customers the predictability of a license, while giving vendors a usage component to ensure margins stay intact at scale. Credits sit in the middle of the spectrum between charging for access and charging for outcomes. Pilot the hybrid model with a subset of customers (ideally 10–20% of the base, selected for high AI feature adoption) before rolling out broadly.
Stage 3 (Months 18–36): Full Hybrid Migration. Migrate the entire customer base to hybrid pricing. By this stage, the company should have 12+ months of usage data to calibrate credit allocation, price AI features at market-clearing levels, and demonstrate the value proposition to customers. The target pricing mix at exit should be approximately 60% base subscription / 40% usage or outcome-based components.
Critical pricing guidance for different Chapter 3 categories:
| SaaS Category | Recommended Pricing Strategy | Timeline | Key Risk |
|---|---|---|---|
| Cat. 1 (Horizontal) | Aggressive migration to usage/outcome | Months 1–12 | Revenue gap during transition |
| Cat. 2 (Workflow/Low-Code) | Consumption-based per workflow/agent | Months 3–18 | Customer confusion on pricing unit |
| Cat. 3b (Deep Vertical) | Volume-based + AI premium tiers | Months 6–24 | Overcomplicating what works |
| Cat. 4 (Infrastructure/Security) | Usage-based (already aligned) | Maintain/expand | Margin erosion from compute |
| Cat. 5 (Mission-Critical) | Base + AI premium + data access fees | Months 6–24 | Customer pushback on new fees |
2c. AI Operating Model: Centralized vs. Decentralized
The organizational model for managing AI across portfolio companies is a first-order strategic decision for PE firms. Apollo and Hg focus on AI centers of excellence for operational improvements. Vista Equity Partners has taken the most aggressive approach: The private equity firm, with $100 billion in assets under management and over 90 portfolio companies specializing in enterprise software, has created an "agentic factory" to deploy AI across its companies and transform their businesses. Smith said 30 of Vista's companies are generating revenue from converting to agentic AI, and another 30 or 40 will convert in the coming months.
Vista's model demonstrates the power of centralized AI infrastructure. Vista has launched a first-of-its-kind Agentic AI Factory — a platform purpose-built to scale Agentic AI across its enterprise software portfolio. Enabled by expertise from Vista's Value Creation team and strategic technology partnerships, Vista's Agentic AI Factory gives portfolio companies early access to next-generation agentic tooling, engineering collaboration and go-to-market channels.
The results are measurable: Vista's portfolio companies are seeing productivity gains of 30% to 50% in writing code. Some tasks that take a person hours to do can be done in seconds with AI. He said 20 cents' worth of "inference," or running an AI model, can lead to up to $10 in savings.
For mid-market PE firms that cannot match Vista's scale, the recommended operating model involves three tiers:
Tier 1: Fund-Level AI Strategy (Centralized). Establish a small AI strategy team (2–4 professionals) at the fund level responsible for: (a) developing standardized AI assessment frameworks for diligence, (b) negotiating portfolio-wide enterprise agreements with hyperscalers and AI tool vendors, (c) identifying cross-portfolio AI use cases, and (d) tracking AI capability maturity across all portfolio companies.
Tier 2: Portfolio Company AI Champions (Hybrid). Appoint an AI champion within each portfolio company — typically a senior product or engineering leader with AI expertise. This person reports to the CEO but has a dotted-line relationship to the fund-level AI team. By 2026, two-thirds of firms expect to invest over a quarter of their budget in AI. A notable 84% of PE firms have appointed a chief AI officer (CAIO), indicating a strong strategic commitment to integrating AI into their operations.
Tier 3: Shared AI Infrastructure (Centralized). Where feasible, create shared infrastructure across portfolio companies — common LLM access agreements, shared vector database infrastructure, standardized AI governance frameworks, and reusable AI deployment patterns. This reduces the marginal cost of AI adoption for each portfolio company while maintaining centralized governance.
2d. Talent and Organization
The AI transformation requires new skills that most PE-owned SaaS companies do not currently possess. The critical roles include:
- AI Product Manager: Bridges product strategy and AI capability development. Understands both customer workflows and model capabilities. Salary range: $180K–$280K.
- ML/AI Engineer: Builds and deploys AI features, manages model fine-tuning and inference optimization. Salary range: $200K–$350K.
- Prompt Engineer / AI Interaction Designer: Designs the interface between AI models and end users. Salary range: $140K–$220K.
- MLOps Engineer: Manages model deployment, monitoring, and lifecycle management in production. Salary range: $180K–$300K.
- Data Engineer (AI-focused): Builds and maintains data pipelines, vector databases, and RAG infrastructure. Salary range: $160K–$280K.
The talent strategy should balance two principles: insource strategic AI skills that create defensible differentiation, and partner for speed on commodity AI capabilities.
Insource: AI product management, data engineering for proprietary data assets, and model fine-tuning for domain-specific AI. These create competitive advantage.
Partner/outsource: General LLM integration, infrastructure management, standard AI feature development (chatbots, document processing, basic analytics). Use the hyperscaler partnerships that the fund-level AI team has negotiated.
Most small and mid-sized enterprises report very low (42%) or low (34%) adoption of key digital technologies. Two-thirds of employees report AI is advancing faster than their organization can train and prepare the workforce, revealing a clear readiness gap. This gap is an opportunity for PE firms that can move quickly: companies that build AI capability during ownership create demonstrable value that translates to exit premium.
Organizational redesign timeline:
Months 0-3: AI Foundation
- Appoint AI champion (senior hire or promote internally)
- Conduct skills gap assessment across product, engineering, data
- Begin recruiting for 2-3 critical AI roles
- Establish AI working group with cross-functional representation
Months 3-6: Build Capability
- First AI hires onboarded and productive
- Establish data engineering pipelines for proprietary data
- Deploy first AI features using third-party models
- Begin internal AI training program for existing staff
Months 6-12: Scale and Integrate
- AI team at target capacity (5-10 FTEs depending on company size)
- Proprietary model fine-tuning underway
- AI features generating measurable customer adoption
- AI integrated into product roadmap as permanent workstream
Months 12-24: Differentiate
- Vertical AI engine deployed on proprietary data
- AI features contributing measurable NRR uplift
- AI operating model generating margin improvement
- Company positioned as "AI-enhanced" in market narrative
2e. Cost Structure Optimization: The EBITDA Expansion Playbook
AI-driven cost optimization is the most immediately quantifiable value creation lever. Based on the line-item economics documented in Chapter 2, the following targeted interventions should deliver 500–1,000 basis points of EBITDA margin improvement within 24 months:
R&D Efficiency (Target: 5–10 points of R&D/Revenue reduction). Deploy AI coding tools (GitHub Copilot, Cursor, Claude Code) across the development organization. As Chapter 2 documented, large enterprises report a 33–36% reduction in time spent on code-related activities. For a $50M revenue company spending 30% on R&D ($15M), a 25% productivity gain frees $3.75M — 750 bps of margin improvement. However, apply the Chapter 2 caution: monitor code quality and security vulnerabilities (45% incidence rate per Veracode), and redirect a portion of savings to AI-specific development rather than pure headcount reduction.
Support Automation (Target: 3–6 points of support cost reduction). Implement AI-powered customer support (Intercom Fin, Zendesk AI, or in-house solutions) to deflect 40–60% of Tier 1 tickets. As Chapter 2 documented, resolution costs drop from ~$6.67 per human interaction to ~$1.00 per AI resolution. For a company with $5M in annual support costs, 50% deflection at 85% cost reduction yields approximately $2.1M in savings — 420 bps.
Sales Efficiency (Target: 2–4 points of S&M/Revenue reduction). Deploy AI for lead scoring, content generation, pipeline analysis, and meeting preparation. AI systems automate key steps in the sales cycle — from lead enrichment and nurturing to smart pricing and proposal generation — helping teams reduce prep time by up to 80 percent and increase customer-facing time by 50 percent. For a company with $18M in S&M spend, a 15% efficiency gain yields $2.7M — 540 bps.
G&A Automation (Target: 1–2 points of G&A/Revenue reduction). Implement AI for finance (automated invoice processing, AP/AR matching), HR (recruitment screening, onboarding), and legal (contract review, compliance monitoring). These are mature AI use cases with proven ROI.
Total target: 500–1,000 bps of EBITDA margin improvement within 24 months, with the following quarterly milestones:
| Quarter | Cumulative Margin Improvement | Primary Lever |
|---|---|---|
| Q1 (Months 1–3) | 50–100 bps | AI coding tools deployed; first support chatbot pilot |
| Q2 (Months 4–6) | 150–250 bps | Support automation scaled; AI sales tools deployed |
| Q3 (Months 7–9) | 250–400 bps | R&D productivity gains visible; G&A automation launched |
| Q4 (Months 10–12) | 350–550 bps | Full support automation; R&D team right-sized |
| Q5–Q8 (Year 2) | 500–1,000 bps | Second-order effects: reduced hiring needs, AI-driven NRR uplift |
Critical caveat: As Chapter 2 emphasized and as Chapter 7 will explore in detail, cost savings alone do not equal value creation. AI should drive BOTH cost efficiency AND revenue expansion. Aggressive cost-cutting that destroys customer experience, reduces NRR, or erodes the product's competitive position is value-destructive even if it temporarily improves EBITDA. The right framework: reinvest 30–50% of AI-generated cost savings into AI-powered product enhancements that drive revenue expansion.
Phase 3: Pre-Exit Positioning
3a. AI Narrative Development
In the current M&A environment, AI narrative is no longer optional — it is a primary driver of buyer interest and valuation premium. 85% of the technology deals in the sample cited AI as part of the strategic rationale in their press releases. Tech M&A has surged: there were 3,113 tech M&A deals in the first half of 2025 compared to 2,296 deals in H1 2024, a 36% increase. Deal value rose 40% year-over-year. Nearly 75% of the tech M&A deals in H1 2025 were AI-related transactions, and a major chunk of the deal value resulted from those transactions.
The sell-side narrative must address three dimensions:
1. AI as a product differentiator. What AI capabilities does the company have that create measurable customer value? Document specific metrics: AI-driven NRR uplift, customer ROI from AI features, AI feature adoption rates, and customer retention improvement attributable to AI. CEOs who clearly articulate these metrics stand out in buyer diligence processes. As the AlixPartners report emphasizes, investors are now more likely to scrutinize how effectively companies use AI in their operations, what ROI they generate from AI investments, and how strong their outcome-based metrics are.
2. AI as an operational efficiency driver. Demonstrate measurable margin improvement from AI deployment — the EBITDA expansion documented in Section 2e above. Provide before/after metrics for support costs, R&D efficiency, and sales productivity. Quantify the remaining opportunity: if the company has captured 500 bps of margin improvement and the analysis suggests another 500 bps is achievable, present both the realized gains and the forward opportunity.
3. AI as a defensibility mechanism. Reference the Chapter 4 moat framework. Demonstrate that the company's AI capabilities are built on proprietary data, deep workflow integration, or regulatory moats — not on third-party model wrappers that any competitor could replicate. Proprietary or in-house AI integrations command meaningfully higher premiums than ChatGPT wrappers in buyer diligence. The decision tree from Chapter 4 provides the language and framework.
Operational implementation: Begin building the AI narrative 12–18 months before planned exit. This requires:
- Standardized AI metrics reporting (monthly AI feature adoption, AI-driven NRR impact, AI cost savings)
- Customer case studies demonstrating AI ROI (minimum 3–5 reference customers)
- Product roadmap document showing AI evolution trajectory
- Competitive positioning analysis showing AI defensibility vs. alternatives
3b. Valuation Premium Capture
The core insight for pre-exit positioning is that AI-enhanced SaaS commands a measurable premium over traditional SaaS — but only when the AI is demonstrably proprietary, defensible, and value-creating.
AI is now embedded across the PE lifecycle, shaping portfolio value creation and exit planning, influencing sell-side differentiation and playing an increasingly important role in buy-side diligence and capability assessment.
The premium capture strategy has four components:
NRR improvement documentation. Track and report the NRR improvement attributable to AI features. If AI-powered upselling, usage expansion, or reduced churn has improved NRR from 105% to 115%, quantify the implied ARR growth differential over the hold period. A 10-point NRR improvement on a $50M ARR base compounds to approximately $8M of additional ARR over three years — worth $40M–$80M in enterprise value at 5–10x multiples.
Margin expansion attribution. Prepare a detailed margin bridge that attributes EBITDA improvement to specific AI initiatives. Buyers and their diligence teams will scrutinize whether margin improvement is sustainable (AI-driven automation that compounds) or one-time (headcount reduction that has already been executed).
Customer ROI quantification. For enterprise customers, document specific financial outcomes from AI features. As Vista's portfolio demonstrates, LogicMonitor's Edwin AI generates $2 million annual savings per customer. Customer ROI documentation creates two benefits: it justifies premium pricing to customers (improving retention) and demonstrates value creation to buyers (justifying premium valuation).
AI IP and data asset inventory. Create a formal inventory of proprietary AI assets: fine-tuned models, proprietary training datasets, vertical AI engines, and customer-generated data flywheels. These assets are increasingly valued as standalone elements in buyer diligence — particularly for strategic acquirers who need domain-specific AI capabilities.
3c. Exit Route Optimization
The exit landscape for PE-owned SaaS companies has evolved significantly. Prepare for the following dynamics:
Longer buyer evaluation cycles. AI capability assessment has added a new diligence workstream that extends buyer evaluation by 2–4 weeks. Prepare AI-specific data rooms with model performance metrics, inference cost analysis, AI architecture documentation, and customer AI usage data.
More earnout structures. Interest-rate cuts in late 2025 eased debt financing costs, spurring a shift toward earn-out mechanisms that align price with performance. AI revenue streams — particularly usage-based and outcome-based components — are less predictable than traditional subscriptions. Buyers will increasingly push for 10–30% of total consideration to be deferred as earnouts tied to AI revenue or usage milestones. Negotiate earnout triggers carefully: tie them to metrics the management team can influence (AI feature adoption rate, AI revenue as % of total) rather than macro outcomes (total market growth).
Strategic buyers may pay premiums over sponsor-to-sponsor. Cross-sector acquirers — particularly incumbents in payments, healthcare, and industrials — are actively acquiring SaaS + AI capabilities. Vertical integration emerges as a strategic lever across M&A deals as companies seek greater control over critical inputs, distribution channels and monetization pathways amid tightening margins and structural industry shifts. This trend signals a strategic pivot toward resilience and margin defense. A healthcare company acquiring a vertical health-tech SaaS platform with proprietary clinical AI may pay 20–30% more than a financial sponsor because the strategic value exceeds the financial return calculation.
IPO window positioning. For the highest-performing portfolio companies (Category 4 or 5 targets with $200M+ ARR, 25%+ growth, and demonstrated AI capability), the IPO window may reopen selectively by 2028–2029 under the Augmentation or Polarization scenarios from Chapter 5. Begin IPO-readiness preparation 24 months before target date: SOX compliance, financial reporting standardization, board composition, and public company governance.
| Action Item | Pre-Acquisition | During Ownership | Pre-Exit |
|---|---|---|---|
| AI Moat Assessment | Classify target as Fortress/Winner/Adapter/Exposed using Ch. 4 decision tree | Update classification quarterly; track moat evolution | Present classification with evidence in sell-side materials |
| Responsible: | Deal lead + AI operating partner | AI champion + operating partner | CFO + sell-side advisor |
| Timeline: | First 2 weeks of diligence | Quarterly review | 18 months before exit |
| Success Metric: | Classification completed with evidence | Moat depth maintained or improved | Buyer validates classification |
| NRR Decomposition | Cohort-based NRR analysis (8+ quarters); flag declining expansion | Monthly NRR tracking by component; AI impact attribution | Present NRR improvement narrative with AI attribution |
| Responsible: | Financial diligence team | VP Finance + VP Customer Success | CFO + IR |
| Timeline: | Weeks 2–4 of diligence | Monthly reporting cadence | 12 months of documented improvement |
| Success Metric: | AI disruption risk quantified | NRR stable or improving; expansion rate growing | NRR improvement of 5–15 points attributable to AI |
| Pricing Model Transition | Model revenue under 3 seat-reduction scenarios | Execute 3-stage pricing migration | Present hybrid pricing model with 12+ months of data |
| Responsible: | Deal team + pricing consultant | VP Product + VP Sales | CRO + CFO |
| Timeline: | Pre-close financial modeling | Stages over 18–36 months | Revenue data available for buyer analysis |
| Success Metric: | Seat risk priced into entry multiple | 20–40% of revenue from usage/outcome | Buyer comfortable with revenue predictability |
| Data Asset Audit | Independent data moat assessment ($50–100K) | Deepen data flywheel; expand proprietary datasets | IP inventory; data asset valuation |
| Responsible: | Deal team + external AI specialist | CTO + Head of Data | CTO + legal |
| Timeline: | Weeks 1–3 of diligence | Ongoing; quarterly progress review | 12 months before exit |
| Success Metric: | Data classified as Type 1/2/3 per Ch. 4 | Proprietary data volume growing >20% YoY | Data assets documented and valued |
| Competitive Threat Mapping | 360-degree threat map (SaaS + AI-native + build-vs-buy + subsumption) | Quarterly threat assessment update | Competitive positioning narrative for buyers |
| Responsible: | Strategy team + operating partner | VP Product + VP Strategy | CEO + sell-side advisor |
| Timeline: | Weeks 2–4 of diligence | Quarterly | 12 months before exit |
| Success Metric: | Threats identified and priced | No surprise competitive entries; proactive response | Buyer validates defensibility |
| Product Roadmap Transformation | Assess AI readiness during diligence | Execute AI-enhanced product roadmap (see 2a timeline) | Demonstrate AI product traction to buyers |
| Responsible: | Technical diligence team | CTO + VP Product + AI champion | CTO + CEO |
| Timeline: | Pre-close | 100-day plan → 24-month roadmap | Feature adoption data for 12+ months |
| Success Metric: | AI opportunity sized; readiness scored | AI features shipped; customer adoption tracked | AI features contributing >10% of revenue or measurable NRR uplift |
| AI Operating Model | Assess target's AI organizational maturity | Establish fund-level + portfolio company AI structure (see 2c) | Demonstrate scalable AI capability to buyer |
| Responsible: | Operating partner | Fund-level AI lead + CEO | CEO + CTO |
| Timeline: | Pre-close assessment | Months 1–6 for structure; ongoing | Operational metrics for 12+ months |
| Success Metric: | Gap identified; hiring plan developed | AI team hired and productive; cross-portfolio leverage | Buyer sees sustainable AI capability, not one-off |
| Cost Structure Optimization | Identify AI margin improvement opportunity | Execute EBITDA expansion playbook (see 2e) | Present margin bridge with AI attribution |
| Responsible: | Operating partner + financial advisor | CFO + COO + AI champion | CFO + sell-side advisor |
| Timeline: | Pre-close modeling | 500–1000 bps over 24 months | 18+ months of demonstrated improvement |
| Success Metric: | Margin opportunity quantified | EBITDA margin improved 500+ bps | Sustainable margin expansion, not one-time cuts |
| Exit Narrative | N/A | Begin tracking AI metrics from Day 1 | Full AI narrative with metrics, case studies, roadmap |
| Responsible: | N/A | AI champion + VP Marketing | CEO + CFO + sell-side advisor |
| Timeline: | N/A | Ongoing from close | 18 months before exit |
| Success Metric: | N/A | AI metrics consistently tracked | Buyer engagement and premium pricing achieved |
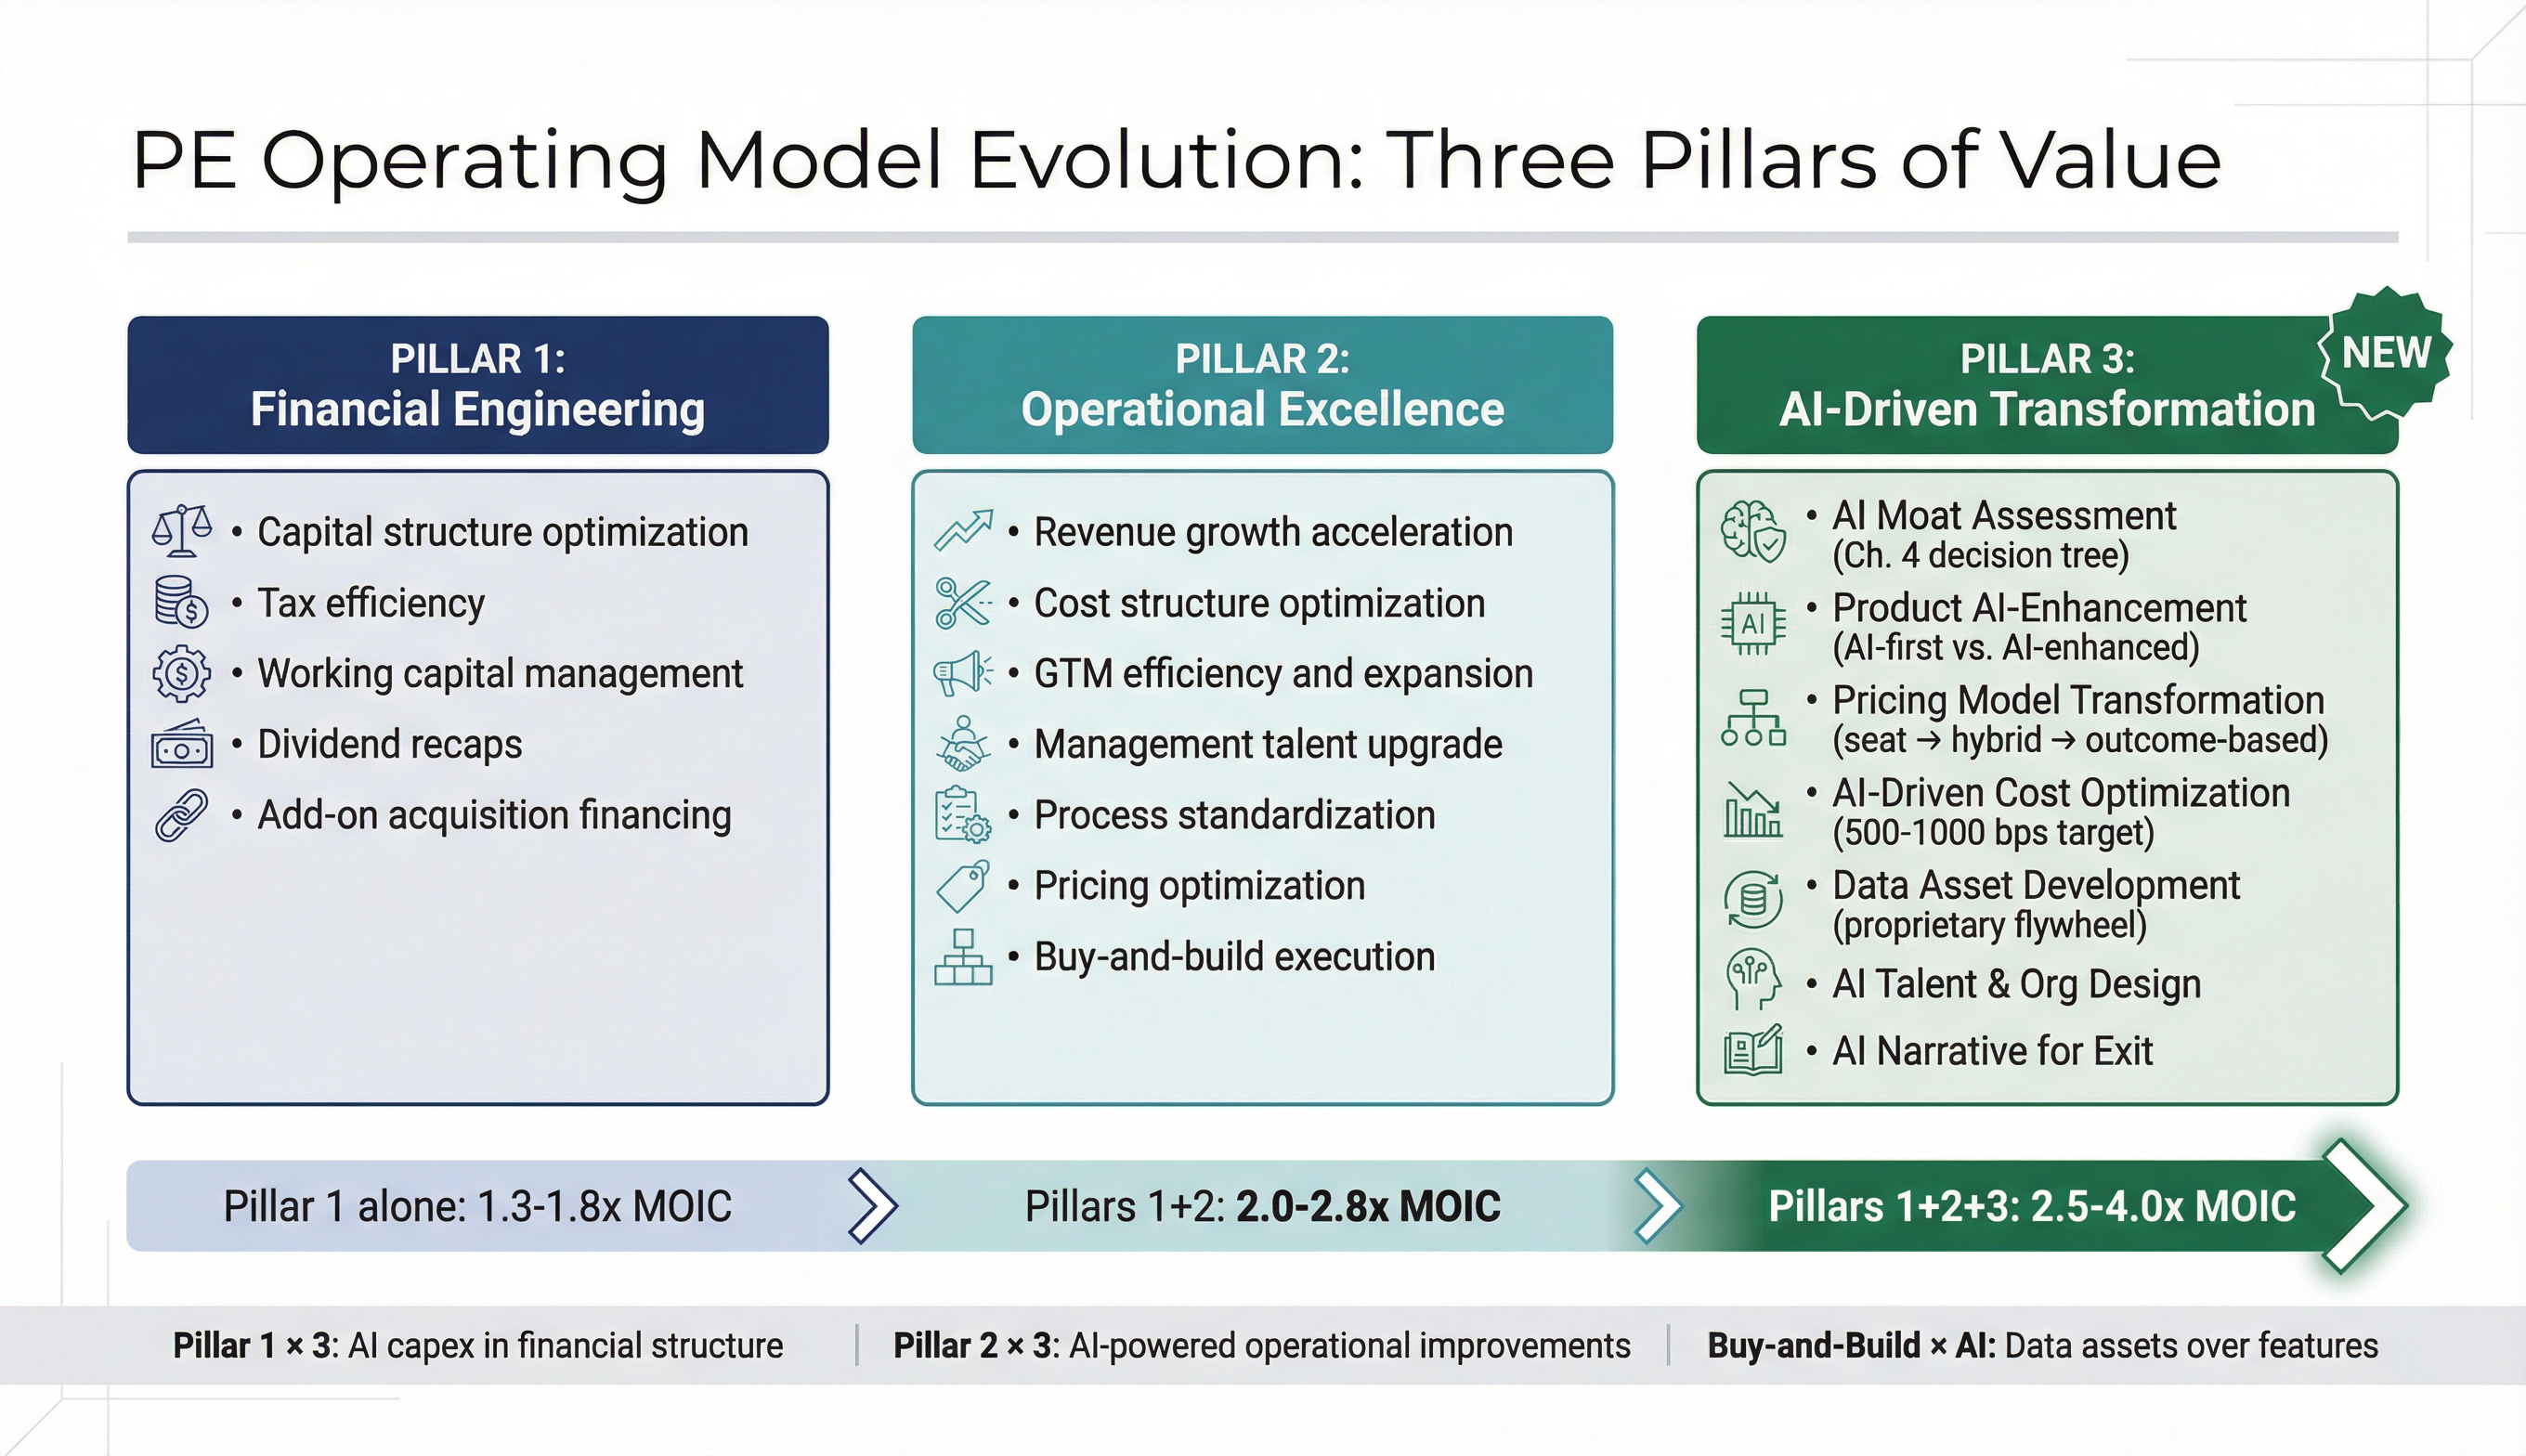
Putting It All Together: The 100-Day AI Transformation Sprint
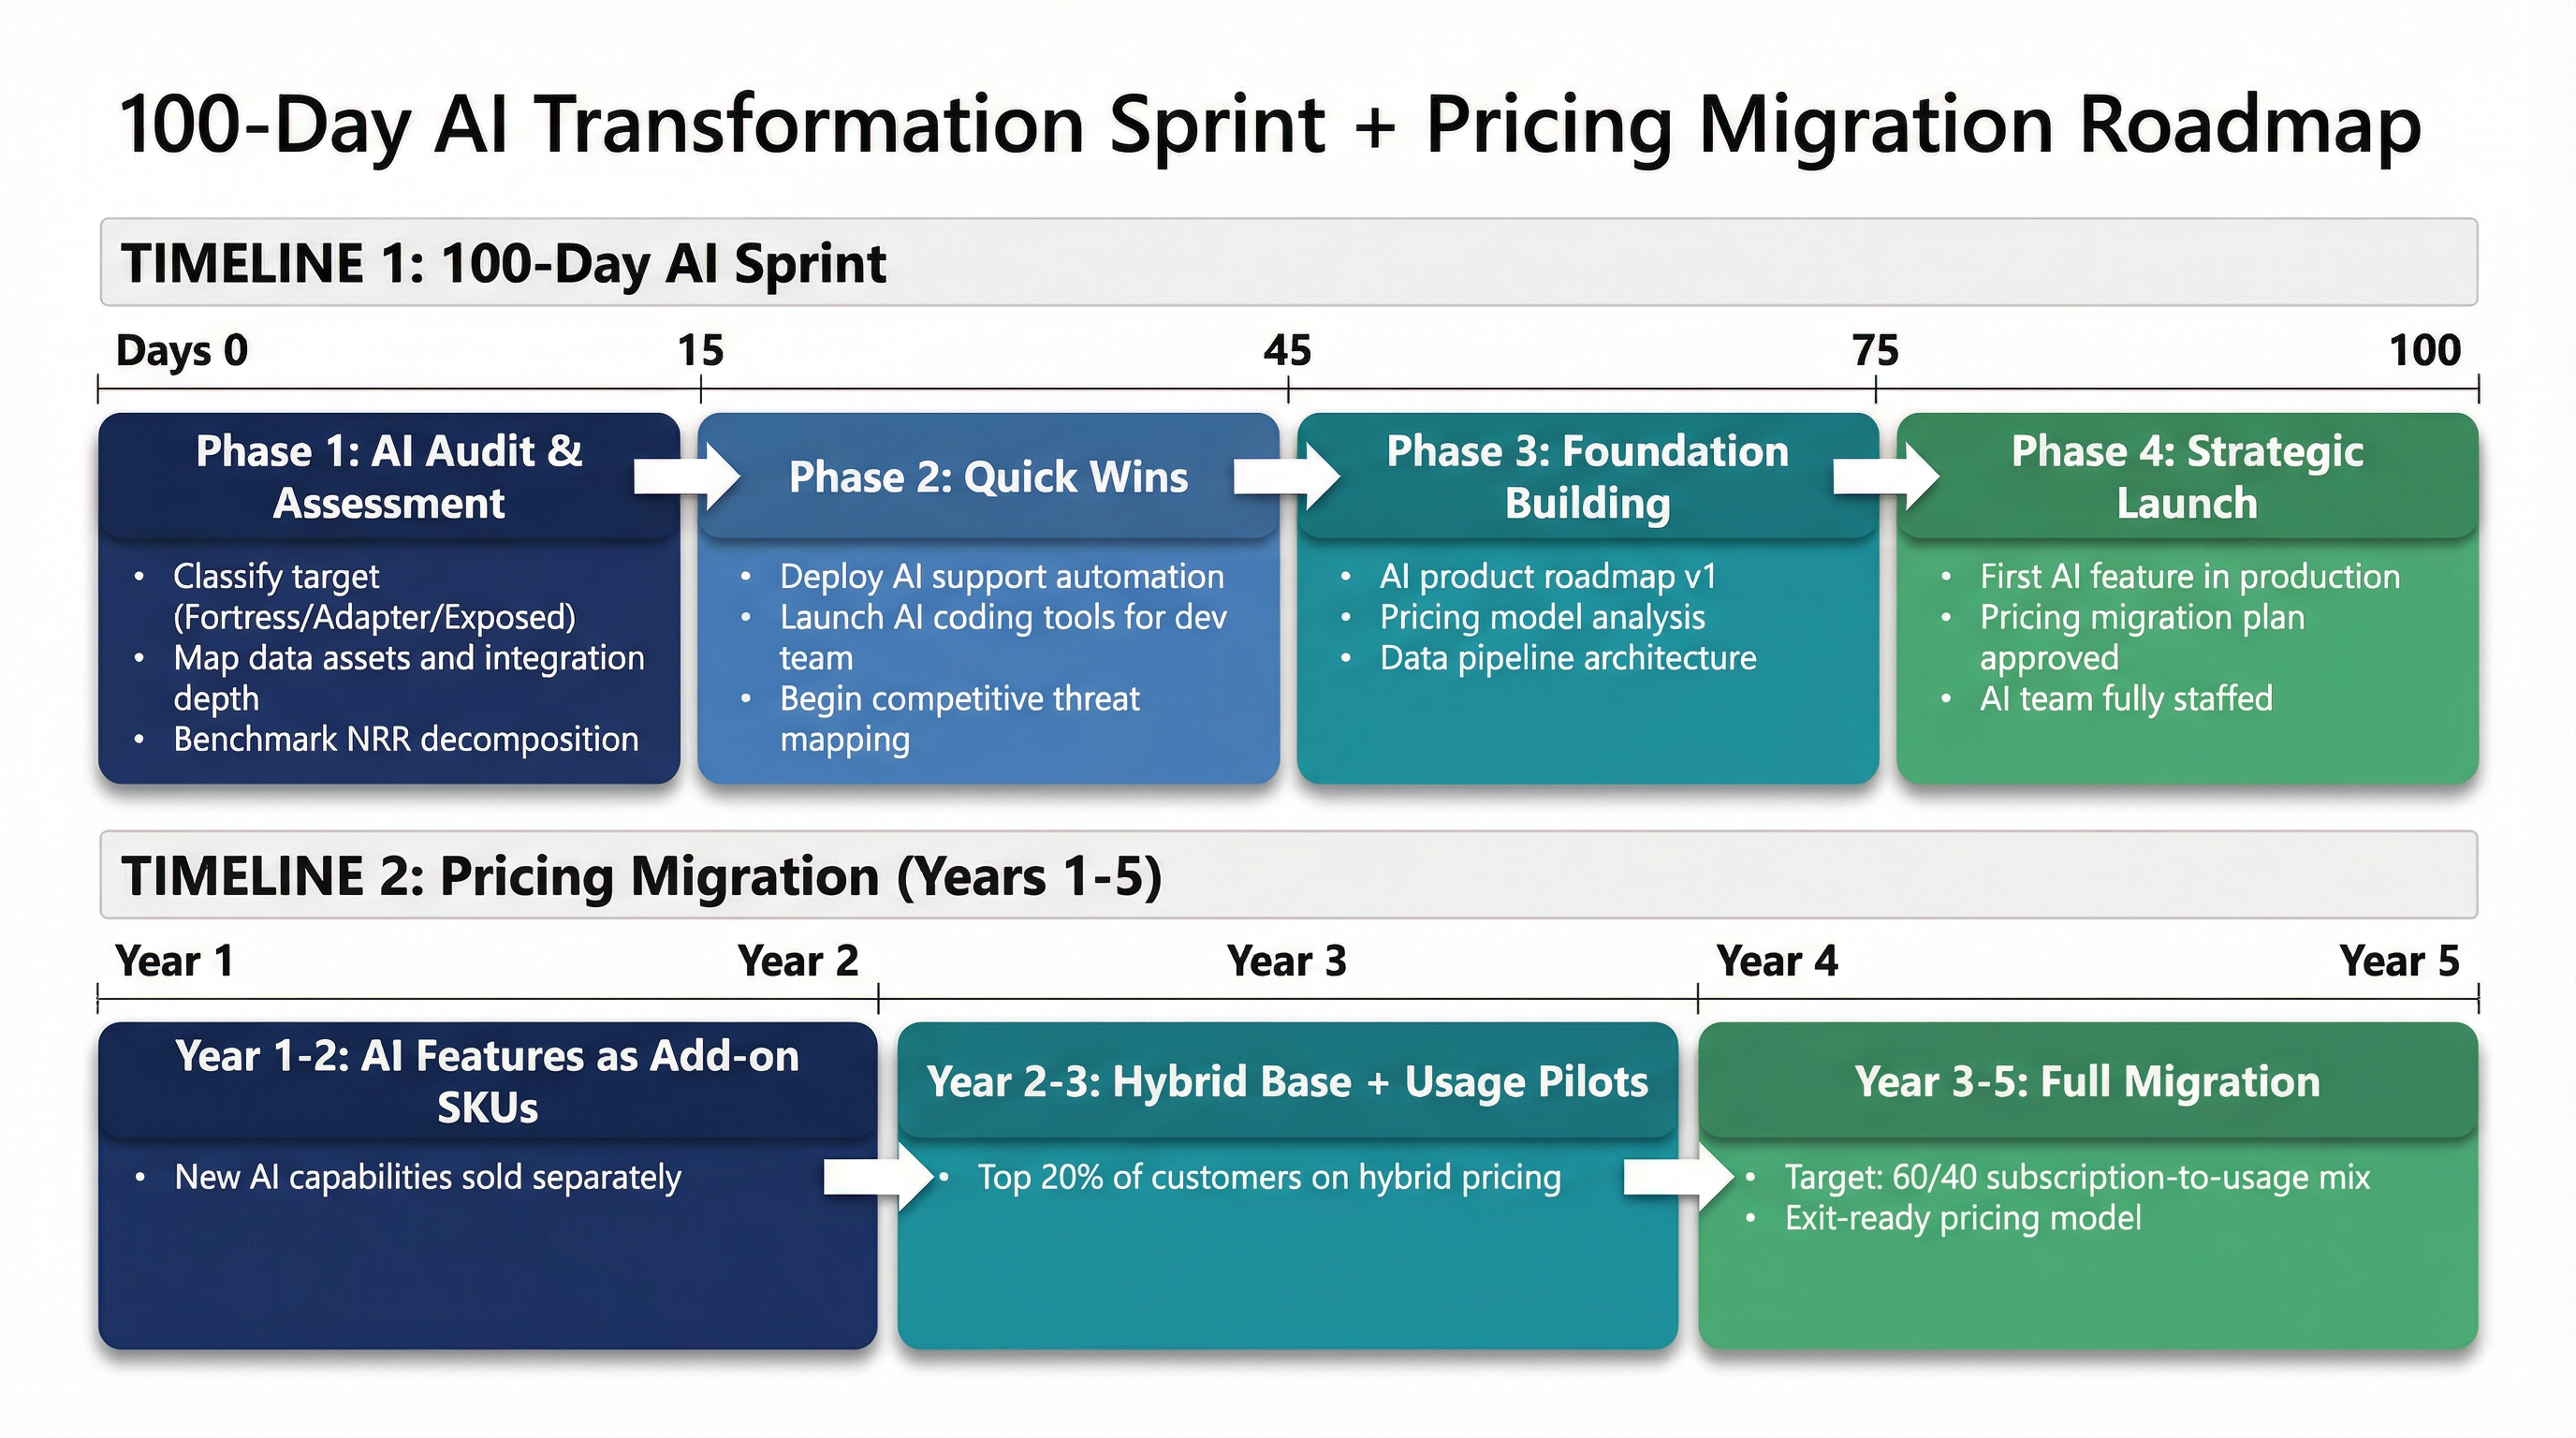
For PE firms executing a new SaaS acquisition, the following 100-day sprint synthesizes the Phase 2 operating priorities into a sequenced execution plan:
DAYS 1-15: ASSESS AND CLASSIFY
- Complete AI Moat Assessment using Chapter 4 decision tree
- Conduct AI capability inventory (strategy, data, infra, talent, governance)
- Score target on 5-dimension AI maturity scale
- Identify top-3 AI quick win opportunities | v DAYS 15-30: PLAN AND ALIGN
- Develop 24-month AI product roadmap (quick wins / core / transformative)
- Create pricing model transition plan (3-stage approach)
- Define AI organizational structure (AI champion + key hires)
- Establish AI metrics dashboard (adoption, cost, NRR impact) | v DAYS 30-60: DEPLOY FOUNDATION
- Deploy AI coding tools across engineering organization
- Launch customer support AI pilot (10-20% of ticket volume)
- Ship first AI quick win feature to customers
- Post first 2 critical AI role requisitions
- Begin credit-based pricing pilot with selected customers | v DAYS 60-90: SCALE AND MEASURE
- Scale support AI to 40-60% of Tier 1 tickets
- Deploy AI sales tools (lead scoring, content generation)
- First AI feature adoption metrics available
- AI champion onboarded (if external hire)
- Begin G&A automation initiatives | v DAYS 90-100: REPORT AND RECALIBRATE
- First AI Operating Review with board
- AI maturity score progress (target: +1 level)
- EBITDA impact: 50-100 bps margin improvement
- AI feature adoption: 10-20% of active users
- Support deflection rate: 30-40% of Tier 1 tickets
- AI hiring: 2-3 critical roles filled or in pipeline
- Recalibrate 24-month roadmap based on first 100 days of data
Chapter Synthesis: The AI-Era PE Operating Model
This chapter has presented a concrete, lifecycle-structured playbook for PE-owned SaaS companies. The key conclusions are:
-
Diligence must be fundamentally restructured. Six new assessment modules — AI Moat Assessment, NRR Decomposition, Pricing Model Resilience, Data Asset Audit, Competitive Threat Mapping, and Customer Concentration Risk — are now essential for any SaaS deal. Deals that proceed without these modules are underwriting risk they haven't priced.
-
AI-enhanced is the right initial product strategy for most PE-owned SaaS. Preserve existing moats while layering AI capabilities. Only 16% of incumbents have successfully commercialized standalone AI products, but those that have see 2–3x higher traction — the early-mover advantage is real and growing.
-
Pricing model transformation cannot wait. With 61% of SaaS companies already adopting hybrid pricing and the seat-based model under structural assault, PE owners must begin testing hybrid models immediately. The three-stage migration (add-on → hybrid pilot → full migration) provides a low-risk transition path.
-
Centralized AI operating models outperform decentralized approaches. Vista's Agentic AI Factory demonstrates the power of fund-level AI infrastructure. Mid-market funds should establish centralized AI strategy teams with hybrid execution through portfolio company AI champions.
-
500–1,000 bps of EBITDA margin improvement is achievable within 24 months through AI-driven automation of support, development, sales, and G&A — but only if 30–50% of savings are reinvested in revenue-expanding AI capabilities.
-
The exit narrative must be AI-native. With 75% of tech M&A deals now AI-related, companies that cannot articulate a credible AI story face discount valuations. Begin building the AI metrics foundation from Day 1 of ownership.
Firms embedding AI into operational playbooks may create measurable value faster and position portfolio companies for premium exits. The playbook presented in this chapter — combined with the risk segmentation from Chapter 3, the defensibility framework from Chapter 4, and the valuation scenarios from Chapter 5 — provides the complete toolkit PE firms need to navigate the AI-era transformation of SaaS.
The next chapter — "What PE Funds Should Stop Doing — And Common Traps to Avoid" — provides the necessary contrarian counterweight to this action-oriented chapter. Where Chapter 6 has outlined what PE firms should do, Chapter 7 will identify what they must stop doing: overpaying for feature-based differentiation, assuming cost savings equal automatic value creation, and treating all SaaS as equally exposed. These traps are the most common value-destroying mistakes in the current environment, and avoiding them is as important as executing the playbook presented here.
Chapter 7: What PE Funds Should Stop Doing — And Common Traps to Avoid
Trap 1: Overpaying for Feature-Based Differentiation. Argument: In the pre-AI era, a SaaS company with a unique feature set could command premium multiples because features took months or years to replicate. AI has collapsed the feature replication cycle to days or weeks. Any specific AI feature you spend six months building can be replicated by a competitor with a prompt. PE funds still paying 10x+ revenue for companies whose differentiation is primarily feature-based (rather than data-based, integration-based, or regulation-based) are overpaying for an evaporating asset. Evidence: the February 2026 sell-off specifically targeted companies whose moats were perceived as algorithmic or feature-based. Counter-argument and nuance: feature-based differentiation STILL matters when the features are deeply embedded in customer workflows, generate proprietary data, or operate under regulatory requirements. The test is: 'Could a well-funded competitor replicate this feature set in 12 months using AI tools?' If yes, the premium is unjustified.
Trap 2: Assuming AI Cost Savings = Automatic Value Creation. Argument: Many PE firms are treating AI as a cost-cutting lever — reduce headcount in support, development, and sales, pocket the EBITDA improvement, and exit at a higher multiple. This is dangerously simplistic. Evidence from PwC: pilots don't scale beyond a single team; automation delivers time savings that never translate into structural cost reductions; the binding constraint is people, not technology. AI compute costs can offset labor savings: vendors lure customers with pilot credits, but scaling to production reveals 500–1000% cost underestimation. Moreover, aggressive cost-cutting can destroy the customer experience, reduce NRR, and erode the very value that justifies the SaaS multiple. The right framework: AI should drive BOTH cost efficiency AND revenue expansion (new pricing tiers, AI-powered products, expanded TAM). One without the other is a trap.
Trap 3: Treating All SaaS as Equally Exposed (or Equally Safe). Argument: The biggest mistake in today's market is applying a single AI narrative to all SaaS. Some PE funds are avoiding SaaS entirely because of the 'AI kills SaaS' narrative — missing opportunities to buy structurally defensible platforms at trough multiples. Others are dismissing AI risk entirely because their portfolio companies haven't yet seen revenue impact — ignoring that NRR degradation precedes EBITDA impact by 12–18 months. The correct approach: use the segmentation framework from Chapter 3 to assess each investment individually. The dispersion between SaaS winners and losers will be the largest in the industry's history.
Additional shorter 'stop doing' items: (a) Stop anchoring to 2021 exit multiples — the new normal is structurally lower, and any business plan requiring a return to 15x+ multiples for exit is unrealistic. (b) Stop treating AI readiness as a checkbox — it must be assessed as a spectrum, from 'no AI strategy' to 'AI-native.' (c) Stop ignoring pricing model risk — a company generating 100% of revenue from per-seat pricing is carrying significant unpriced risk. (d) Stop underestimating the speed of disruption — OpenAI's o3 model dropped 80% in cost in just two months; planning on 3–5 year transition timelines may be too slow.*
Key fixes to make:
- Y Combinator 60% claim → Replace with verified YC data (Garry Tan: ~25% of startups have 95% AI-written code; startups reach enterprise contracts faster)
- 70% software providers profitability → Attribute to source (AI 2 Work analysis) and note it's an industry estimate, not independently verified survey data
- IDC 70% pricing forecast → Now verified from IDC FutureScape 2026 (BusinessWire, CIO.com)
- 85% outcome-based pricing → Replace; Metronome found 85% use or plan usage-based pricing (not outcome-based). Bain found only 17% implemented true outcome-based pricing.
- OpenAI o3 price cut date → Confirmed June 10, 2025
- Historical SaaS multiples → Cross-reference note
- "SaaSpocalypse" → Keep with attribution but add neutral alternatives
- Uncertainty acknowledgments for forward-looking claims
- Feature Defensibility scoring → Map to Ch3/Ch4 explicitly
- Risk heatmap figure for Middle Tier Decision Matrix
- Additional Trap 2 evidence beyond PwC/MIT
The preceding chapter laid out a comprehensive action playbook — what PE firms should do across the full investment lifecycle to navigate the AI-era transformation of SaaS. This chapter provides the necessary counterweight: a candid assessment of what PE firms must stop doing. It is designed to be uncomfortable. The traps identified here are not hypothetical — they are errors being committed right now, in deal rooms and operating committees across the industry, by experienced investors applying pre-AI mental models to a post-AI market.
The chapter is structured around three core "stop doing" directives, each supported by data, followed by four additional shorter warnings. Together, they form a contrarian checklist that investment committees can use to stress-test their own decision-making against the most common value-destroying errors in the current environment.
Trap 1: Overpaying for Feature-Based Differentiation
The Pre-AI Logic — And Why It No Longer Holds
For the better part of two decades, a SaaS company with a unique, sophisticated feature set could command premium multiples. The logic was straightforward: features took months or years to build, required deep engineering talent, and created a competitive moat based on functional superiority. A CRM with a proprietary lead-scoring algorithm, an analytics platform with a unique visualization engine, or a marketing tool with an exclusive campaign optimization workflow — each represented genuine differentiation that justified paying 10x, 15x, or even 20x+ revenue.
AI has collapsed the feature replication cycle from years to days. As Chapter 2 documented in detail, the cost of building software has undergone the most dramatic compression in the history of the industry. The barrier to entry for generic tools like CRMs, project management platforms, and HRIS systems has effectively collapsed. AI has commoditized code. In the past, building a robust software product required a large team of engineers and millions in venture capital. Now, small teams leveraging AI co-pilots can ship complex features in days. This means that your "unique" feature set is only unique until your competitor prompts their AI to build it.
The implications for PE valuation are direct and severe. This reality makes traditional B2B SaaS demand generation incredibly difficult because you can no longer compete solely on product capabilities. We have reached a point of saturation where every tool is "smart" and "automated." The difference between Vendor A and Vendor B often feels arbitrary to the buyer. When functionality is identical, price becomes the only lever, destroying margins.
The Evidence: February 2026 Targeted Feature-Based Moats
The February 2026 sell-off was not a random downdraft. It specifically targeted companies whose moats were perceived as algorithmic or feature-based rather than data-based, integration-based, or regulation-based. On February 3, 2026, a single product launch detonated across global financial markets. When Anthropic unveiled its Claude Cowork legal automation tool, it triggered what traders at Jefferies termed the "software-mageddon" — erasing approximately $285 billion in software market capitalization in a single trading day.1 Thomson Reuters plunged 16%. London Stock Exchange Group fell 13%.
Why were these companies hit hardest? Because their differentiation was primarily functional — sophisticated data analysis, research automation, document processing — capabilities that Anthropic's Claude Cowork demonstrated could be replicated or superseded by a general-purpose AI agent. Anthropic's new AI tools, built for its Claude "Cowork" AI agent, are designed to handle complex professional workflows that many software and data providers sell as core products. The tools and other similar AI agents target functions ranging from legal and technology research, customer relationship management and analytics. That has raised concerns that AI could undercut traditional software business models.
Meanwhile, companies with moats grounded in data, integration depth, or infrastructure were comparatively insulated. As Chapter 3 documented, infrastructure software commands 6.2x NTM revenue and DevOps trades at 36.5x EBITDA — both reflecting structural advantages that feature replication cannot erode. The dispersion is the evidence: the market is already pricing feature-based differentiation at steep discounts relative to data-based and integration-based differentiation.
The Speed Factor: Feature Parity Is Now Measured in Weeks
The fact that a technical advantage's shelf life in 2026 is assessed in weeks rather than years is what motivates this need. The implications for PE deal pricing are stark. Consider a hypothetical: a PE fund pays 8x revenue for a marketing analytics SaaS company whose differentiation is a proprietary AI-powered campaign optimizer. Six months into the hold period, a competitor deploys a functionally equivalent optimizer using off-the-shelf foundation models at one-third the cost. The premium paid for that "unique" feature set has evaporated — and with it, potentially 30–50% of the enterprise value.
The same AI tools threatening incumbents are making it dramatically cheaper to build alternatives. Y Combinator CEO Garry Tan reported that around a quarter of the accelerator's current crop of companies used AI to write 95% or more of their code. "What that means for founders is that you don't need a team of 50 or 100 engineers," Tan told CNBC. "You don't have to raise as much. The capital goes much longer." Meanwhile, Menlo Ventures' 2025 State of Generative AI report found that 47% of AI deals reach production — nearly twice the conversion rate of traditional SaaS — because AI delivers clear, immediate value that short-circuits standard procurement cycles. AI-native startups captured 63% of the AI application market, earning nearly $2 for every $1 earned by incumbents. This means every SaaS category with high per-seat pricing and commodity features — support, content management, basic CRM, legal research — is now vulnerable to faster, cheaper alternatives built by small teams.
The Nuance: When Features Still Matter
This is not an argument that features are irrelevant. Feature-based differentiation STILL matters when the features meet specific criteria that resist AI-driven replication:
Features deeply embedded in customer workflows. If the feature controls operational sequences — approval routing, compliance enforcement, safety protocols — it cannot be replicated by merely replicating the code. The integration context, documented in Chapter 4's Level 3–4 integration framework, creates switching costs that transcend the feature itself. This corresponds to Chapter 3's Category 3b (Deep Vertical) and Category 5 (Mission-Critical) classifications, where workflow embeddedness is a primary defensibility driver.
Features that generate proprietary data. A lead-scoring algorithm that merely processes generic data is replicable. A lead-scoring engine that improves over time based on a decade of customer-specific conversion data generates a flywheel that competitors cannot replicate with a prompt — as Chapter 4's analysis of customer-generated data moats (Moat Mechanism #1: Proprietary Data) established. This is the distinguishing factor between Chapter 3's Category 3a (Surface Vertical) and Category 3b (Deep Vertical) companies.
Features operating under regulatory requirements. An AI contract analyzer is a commodity. An AI contract analyzer that produces legally admissible audit trails, integrates with case management systems, and complies with jurisdiction-specific regulatory requirements is not. Regulatory context creates barriers that pure functionality does not — mapped to Chapter 4's Moat Mechanism #3 (Regulatory Lock-In).
The PE Test
The diligence test is simple and binary: "Could a well-funded competitor replicate this feature set in 12 months using AI tools?"
If the answer is yes — and it will be "yes" for any feature set that relies primarily on algorithmic logic, data processing, user interface design, or content generation without proprietary data or regulatory moats — the premium is unjustified. Price accordingly: 3–5x revenue for cash flow characteristics, not 8–12x for differentiation that is evaporating.
If the answer is no — because the features are inseparable from proprietary data flywheels, Level 3–4 integration depth, or regulatory compliance requirements — then the premium may be justified. But the burden of proof must shift: the deal team must demonstrate why the features resist replication, not merely assert that they are "unique."
Scoring Framework: Feature Defensibility Assessment
The following scoring framework operationalizes the moat mechanisms identified in Chapter 4 and maps them to the risk categories defined in Chapter 3. Each attribute directly corresponds to a documented defensibility mechanism:
| Feature Attribute | Score (0–5) | Interpretation | Ch. 4 Moat Mapping |
|---|---|---|---|
| Relies on proprietary, customer-generated data | 0 = No; 5 = Critical dependency | Higher = more defensible | Moat #1: Proprietary Data |
| Embedded in Level 3–4 operational workflows | 0 = Standalone; 5 = Mission-critical | Higher = more defensible | Moat #2: Deep Process Integration |
| Subject to regulatory/compliance requirements | 0 = None; 5 = Legally mandated | Higher = more defensible | Moat #3: Regulatory Lock-In |
| Could be replicated by prompting a foundation model | 0 = Easily; 5 = Impossible | Higher = more defensible | Inverse of Ch. 3 Cat. 1 exposure |
| Generates network effects or ecosystem lock-in | 0 = None; 5 = Platform-level | Higher = more defensible | Moat #5: Ecosystem Switching Costs |
| Total (out of 25) | <10: Feature premium unjustified | Maps to Ch. 3 Cat. 1 or 3a | |
| 10–18: Requires deeper analysis | Maps to Ch. 3 Cat. 2 or 3b | ||
| >18: Feature premium justified | Maps to Ch. 3 Cat. 4 or 5 |
Any SaaS target scoring below 10 on this framework should not be priced above the category median for its Chapter 3 classification. Investment committees should require this scoring as a mandatory component of every deal memo.
Trap 2: Assuming AI Cost Savings = Automatic Value Creation
The Seductive — and Dangerous — Simplicity
The most prevalent trap in PE boardrooms today is treating AI as a cost-cutting lever and nothing more: reduce headcount in support, development, and sales; pocket the EBITDA improvement; and exit at a higher multiple. The appeal is obvious — it fits neatly into the traditional PE playbook of operational improvement, and it produces near-term margin expansion that looks impressive on a quarterly review slide.
This is dangerously simplistic. And the data now conclusively demonstrates that it fails far more often than it succeeds.
The PwC Evidence: Pilots Don't Scale
A PwC study found that 43% of enterprise buyers consider vendors' willingness to share risk through pricing as a significant factor in purchase decisions, yet the payoff from AI investment itself remains elusive. More than half of CEOs report seeing neither increased revenue nor decreased costs from AI, despite massive investments in the technology, according to PwC's 29th Annual Global CEO Survey of 4,454 business leaders across 95 countries and territories. Only 12% reported both lower costs and higher revenue, while 56% saw neither benefit. Twenty-six percent saw reduced costs, but nearly as many experienced cost increases.
This finding is devastating to the "AI = automatic cost savings" thesis. A full 56% of companies investing in AI are getting nothing out of it — no revenue increase, no cost decrease. And this is not a fringe finding from a small sample: PwC's survey represents one of the largest global CEO polls conducted annually. PwC's chairman noted the business community made huge strides in AI adoption intent, but the survey finds that only 10% to 12% of companies report seeing benefits on the revenue or cost side.
This echoes the MIT study that shook markets in August 2025. An MIT study claiming that 95% of generative AI initiatives fail rattled markets over the summer, exposing how quickly sentiment could shift beneath the weight of AI's massive capex spend.
Ninety-five percent failure. This is not a technology problem. It is an organizational problem — one that PE-driven cost-cutting approaches are uniquely ill-equipped to solve.
Corroborating Evidence: McKinsey and Adoption Data
The PwC and MIT findings are not outliers. McKinsey's 2025 State of AI survey found that high performers are nearly three times as likely as others to say their organizations have fundamentally redesigned individual workflows, and this intentional redesigning of workflows has one of the strongest contributions to achieving meaningful business impact of all the factors tested. The implication is clear: AI value creation requires deep workflow redesign — not simple headcount reduction.
PwC's separate AI Agent Survey confirmed that while 79% of executives say AI agents are already being adopted, broad adoption doesn't always mean deep impact. Many employees are using agentic features built into enterprise apps to speed up routine tasks, but it stops short of transformation. Reports of full adoption often reflect excitement about what agentic capabilities could enable — not evidence of widespread transformation.
Adoption also remains painfully low at the production level. Only 9.7% of U.S. firms report using AI in production as of mid-2025, up from only 3.7% in 2023. More than 80% of organisations have piloted generative AI, nearly 40% claim deployment, yet only 5% have made it part of core workflows. That's why billions in investment have produced so little return.
The disconnect is between demonstration and integration. AI tools work brilliantly in demos. They can summarize a document, draft an email, score a lead, and triage a support ticket with impressive accuracy. But integrating these capabilities into enterprise workflows — connecting them to legacy data systems, building governance frameworks, training staff, managing edge cases, and maintaining accuracy at scale — is an entirely different challenge. At the heart of this tension is a simple truth: AI works in demos, but falters in the messy real world.
The Compute Cost Trap
Even when AI does reduce labor costs, PE firms routinely underestimate the offsetting increase in compute costs. As Chapter 2 documented extensively, AI inference is not free. Every AI-powered feature, every chatbot response, every automated analysis burns compute that shows up on the AWS or Azure bill.
CloudZero's 2025 State of AI Costs report, based on a survey of 500 engineering professionals, revealed that average monthly AI spending reached $85,521 in 2025, a 36% increase from 2024's $62,964. The proportion of organizations planning to invest over $100,000 per month has more than doubled, jumping from 20% in 2024 to 45% in 2025, signaling aggressive AI adoption despite rising cost pressures. Industry estimates suggest the cost of delivering AI features is materially eating into software providers' profitability, challenging the era of infinite SaaS margins with the high cost of GPU compute.2
The economics are stark: AI-first SaaS flips some of the traditional assumptions. In an AI-first product, each user action may trigger a computationally intensive AI model. That translates to a direct, variable cost for the company every time the product is used. Serving additional customers does not drop nearly to zero marginal cost — expenses scale roughly in proportion to usage. As one VC firm put it, "every new customer who actively uses your AI product increases your infrastructure costs proportionally." This means AI-centric SaaS startups often have gross margins far below the SaaS norm. Recent benchmarks show many AI software companies averaging only about 50–60% gross margin, versus 80–90% for traditional SaaS.
The trap is a financial illusion: a PE firm reduces support headcount by 40% ($2M annual savings), declares an AI-driven EBITDA expansion, and models exit at a higher multiple. But the AI support tool costs $800K annually in inference compute, requires $300K in ongoing model maintenance, and — critically — the degraded support experience causes NRR to decline from 110% to 102% over the next 18 months. The net effect: $900K in genuine annual savings, offset by $4M in enterprise value destruction from NRR degradation (at 10x revenue multiple). The EBITDA improved; the enterprise value declined.
The Customer Experience Destruction Risk
The most insidious variant of this trap is cutting costs in ways that are invisible in the short term but catastrophic over a 3–5 year hold period. The mechanism is straightforward:
- AI replaces human support agents → resolution quality drops for complex issues
- AI replaces junior developers → code quality degrades or innovation slows
- AI replaces customer success managers → enterprise customers feel underserved
- NRR begins to decline → first visible in expansion rate, then in gross retention
- Revenue growth decelerates → exit multiple compresses
As Chapter 6 emphasized, NRR degradation precedes EBITDA impact by 12–18 months. By the time the operating committee sees the EBITDA impact, the enterprise value erosion is already baked in. This is why the diligence protocol in Chapter 6 requires cohort-based NRR decomposition as a leading indicator — it is the canary in the coal mine for value destruction driven by overly aggressive AI cost-cutting. Note: The 12–18 month lag between NRR degradation and visible EBITDA impact is an estimate based on typical SaaS renewal cycles and operating patterns, not a precise empirical finding. The actual lag varies by contract structure, customer segment, and market conditions.
The Right Framework: Dual-Use AI
The antidote to Trap 2 is not to avoid AI cost optimization — it is to ensure that AI drives both cost efficiency and revenue expansion simultaneously. Chapter 6's playbook recommends reinvesting 30–50% of AI-generated cost savings into AI-powered product enhancements that drive revenue expansion. This dual-use approach — cost savings funding revenue investment — is what separates value-creating AI deployment from value-destroying cost-cutting.
Consider the contrast:
Value-Destroying Approach: Deploy AI support chatbot → reduce support headcount by 50% → pocket $3M in EBITDA improvement → support quality degrades → NRR declines → exit multiple compresses.
Value-Creating Approach: Deploy AI support chatbot → reduce support headcount by 30% → reinvest savings into AI-powered product features (predictive analytics, automated workflows, vertical AI engine) → AI features create upsell revenue → NRR increases → both EBITDA and growth rate improve → exit multiple expands.
The second approach requires more patience and more operational sophistication — but it is the only approach that creates sustainable value in the AI era. PE firms that treat AI as a one-dimensional cost-cutting tool are building their exit thesis on a foundation of sand.
A Process Flow for AI Value Creation vs. Destruction
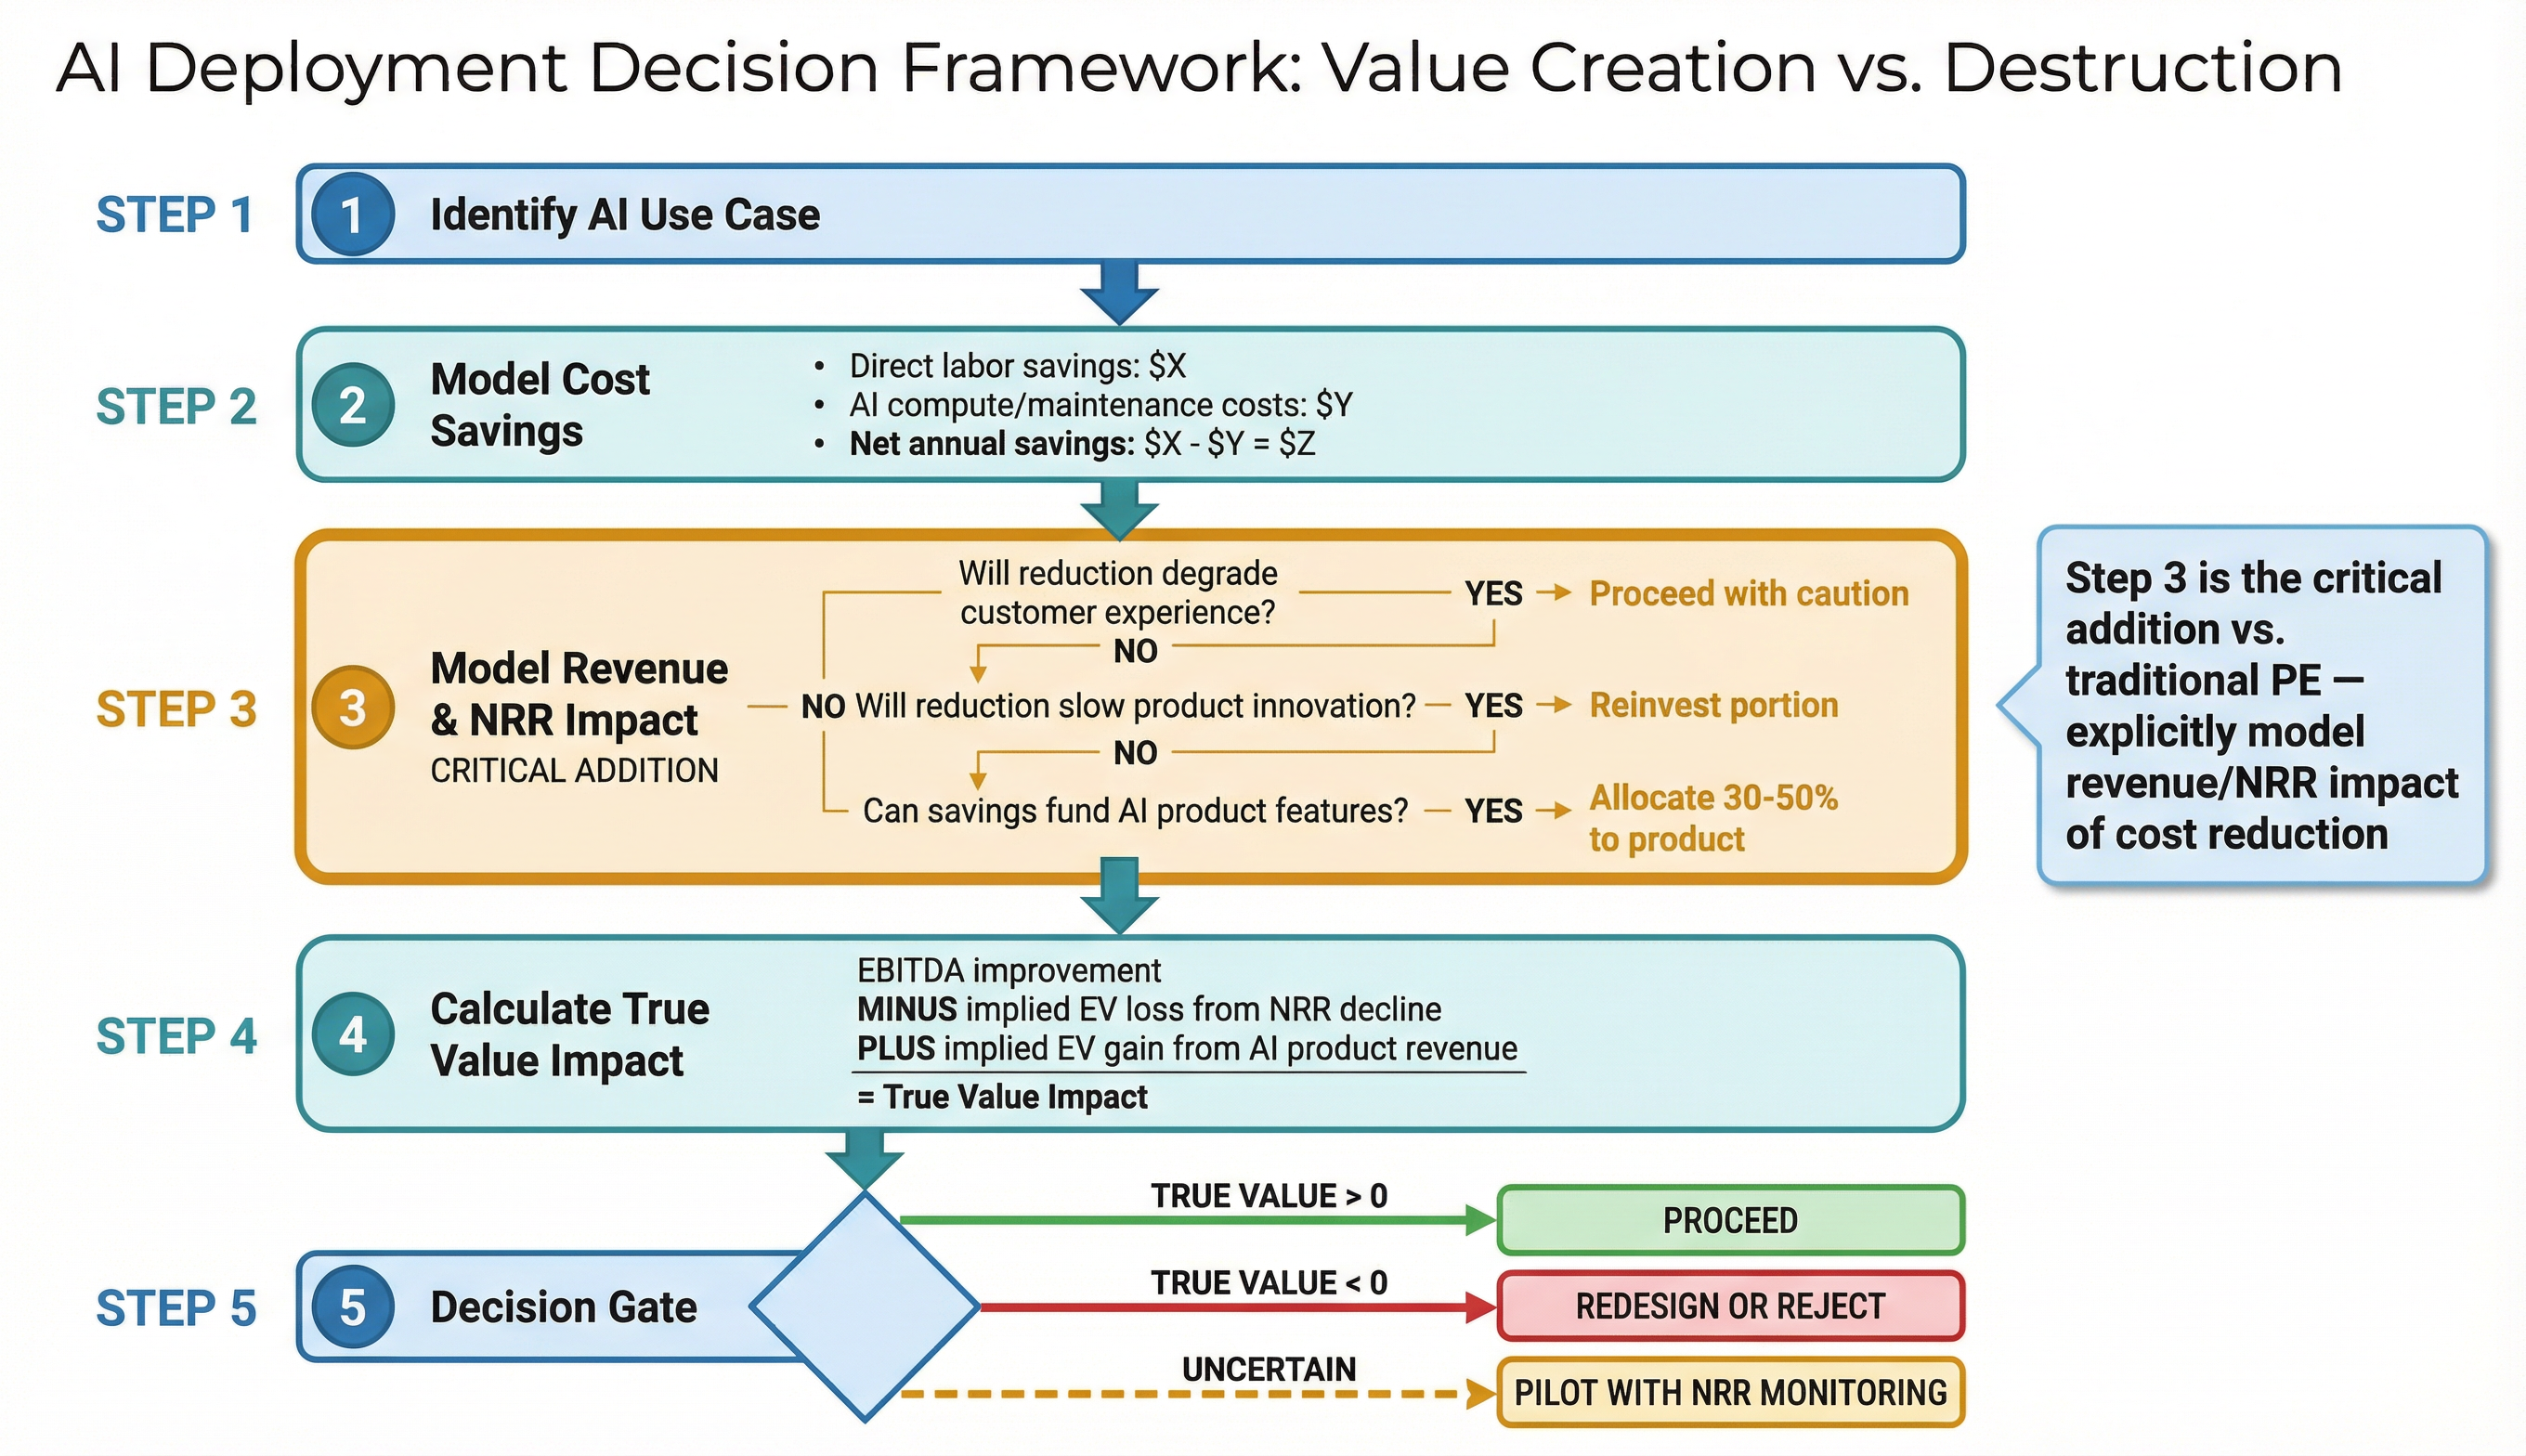
Every AI cost-reduction initiative at a PE-owned SaaS company should pass through this five-step framework. The critical addition versus the traditional PE operating model is Step 3 — the explicit requirement to model the revenue and NRR impact of cost reduction, not just the EBITDA improvement.
Trap 3: Treating All SaaS as Equally Exposed (or Equally Safe)
The Binary Error
The single biggest mistake in today's market is applying a single AI narrative to all SaaS — treating the sector as monolithic when the evidence overwhelmingly shows it is bifurcating along the specific lines documented in Chapters 3 and 4.
This error manifests in two equal and opposite forms:
The "AI Kills SaaS" Panic. Some PE funds are avoiding SaaS entirely because of the sell-off narrative — pulling back from a sector that represents one of the most compelling buying opportunities for the right assets at the right prices. For the better part of a decade, private equity firms and private credit lenders have poured hundreds of billions of dollars into software-as-a-service companies, drawn by their recurring revenue streams, high margins, and seemingly unassailable market positions. Now, the very technology revolution that made these businesses so attractive threatens to render many of them obsolete. The culprit: artificial intelligence. This narrative, while containing real elements, is indiscriminate — and the indiscriminate application of a discriminating disruption is itself the trap.
The "Our Portfolio Is Fine" Complacency. Other PE funds are dismissing AI risk entirely because their portfolio companies haven't yet seen revenue impact. This is equally dangerous. As documented throughout this report, AI disruption shows up in leading indicators (declining expansion rate, increasing customer build-vs-buy inquiries, competitive displacement in new logo wins) 12–18 months before it hits EBITDA. The financial threat from AI automation is not a monolithic one. It creates a vulnerability matrix where the same technology that promises massive cost savings can simultaneously cannibalize core revenues. For software and data providers, the tension is stark: AI agents are being built to perform the exact functions these companies sell. Tools targeting legal and technology research, customer relationship management and analytics directly challenge the value proposition of established SaaS and data licensing models.
The correct posture is neither panic nor complacency — it is rigorous, company-by-company assessment using the frameworks developed in this report.
The Valuation Evidence: Dispersion Is the Story
The market is already pricing SaaS with unprecedented dispersion. As Chapter 1 documented, the gap between the highest-valued and lowest-valued SaaS subcategories has widened to approximately 5–6x on a revenue multiple basis (Data Infrastructure at 6.2x vs. AdTech at 1.1x). Under Chapter 5's Polarization base case, this spread is projected to widen to 10–16x by 2031 — though, as noted in Chapter 5's methodology, these projections carry inherent uncertainty and should be treated as structured frameworks for stress-testing assumptions rather than precise forecasts.
The challenge for private equity firms is that many of their portfolio companies fall somewhere in between. They may have started as point solutions but expanded over time, creating a patchwork of capabilities that is neither fully commoditized nor deeply entrenched. These "middle tier" SaaS businesses are the ones generating the most anxiety among sponsors and lenders alike, as they must rapidly integrate AI capabilities or risk losing customers to competitors — or to AI itself.
This "middle tier" — companies that are neither clearly defensible nor clearly exposed — is where the largest PE allocations sit and where the analytical precision of the Chapter 3 risk spectrum is most critical. A company in this middle tier might be a deep vertical platform that looks like a generic horizontal tool in a screening database, or a generic horizontal tool that has quietly built a proprietary data flywheel that transforms its defensibility profile. The segmentation framework is the tool that distinguishes them — and applying a blanket "SaaS is exposed" or "SaaS is fine" narrative to this middle tier destroys value in both directions.
The "Middle Tier" Decision Matrix
The following matrix captures the two-way error that Trap 3 produces, mapped to the Chapter 3 categories:
| Category | Risk of "Avoid All SaaS" Error | Risk of "All SaaS Is Fine" Error | Correct PE Action |
|---|---|---|---|
| Cat. 1 (Horizontal) | LOW risk — avoidance is mostly correct | HIGH risk — complacency is dangerous | Avoid at current prices, or acquire at deep discount for cash flow |
| Cat. 2 (Automation) | MEDIUM — may miss orchestration winners | MEDIUM — simple automation faces real risk | Surgical: invest in orchestration, avoid simple RPA |
| Cat. 3a (Surface Vertical) | LOW — avoidance is mostly correct | HIGH — "vertical" label creates false safety | Apply integration depth test rigorously |
| Cat. 3b (Deep Vertical) | HIGH — this is the biggest missed opportunity | LOW — defensibility is real but verify | Buy aggressively after confirming depth with Chapter 4 moat test |
| Cat. 4 (Infra/Security) | VERY HIGH — avoiding this category is value-destructive | LOW — these are genuine AI beneficiaries | Invest aggressively; AI tailwinds are structural |
| Cat. 5 (Mission-Critical) | HIGH — trough prices create buying opportunity | LOW — moats are deep and verified | Buy at trough multiples; layer AI premium tiers |
Figure 7.1: Middle Tier Risk Heatmap
The matrix above can be visualized as a risk heatmap to facilitate rapid IC-level assessment. The heatmap plots Chapter 3 categories on the vertical axis against the two directional errors (panic vs. complacency) on the horizontal axis, with color intensity representing value-destruction risk:
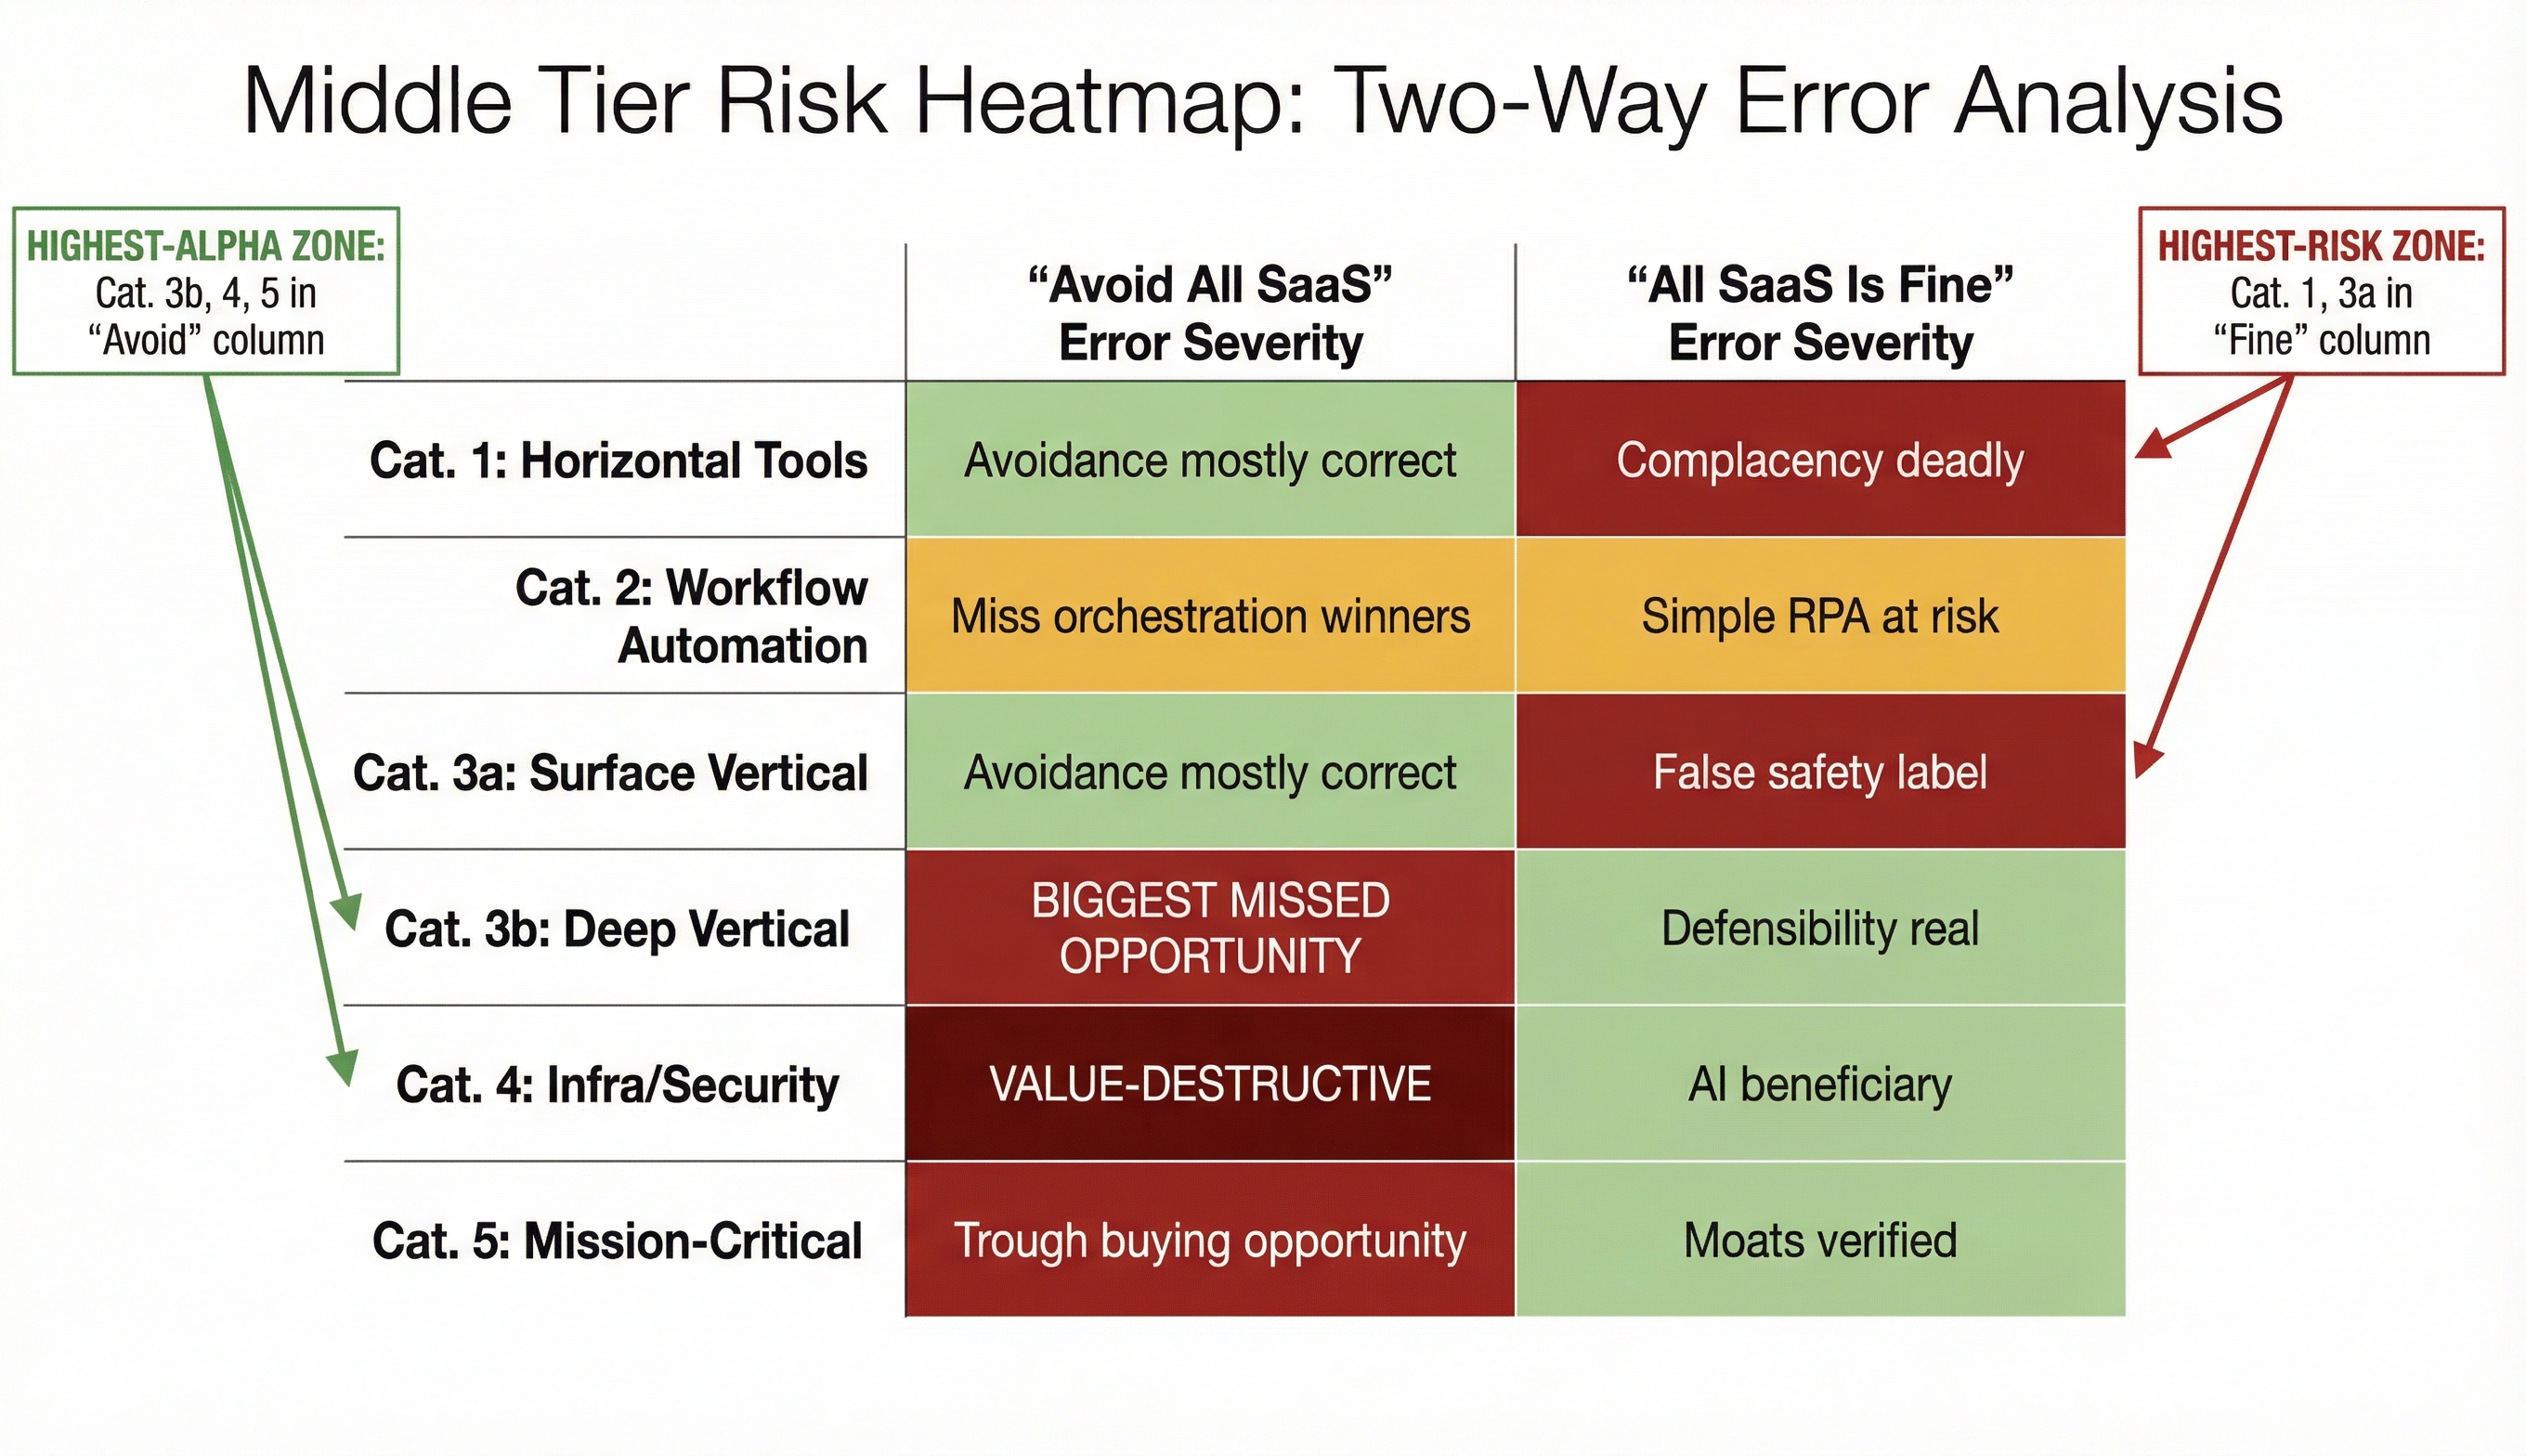
The highest-alpha error to correct is in the upper-right of this matrix: PE firms avoiding Category 3b, 4, and 5 SaaS because of the blanket "AI kills SaaS" narrative. These categories are being sold at multiples that do not reflect their structural advantages, and the February 2026 sell-off created a dislocation that experienced PE investors should exploit rather than flee from.
Conversely, the highest-risk error is in the "All SaaS Is Fine" column for Categories 1 and 3a: PE firms holding generic horizontal or surface vertical SaaS and dismissing AI risk because "our EBITDA looks fine this quarter." NRR degradation in these categories is likely already underway in many cases; by the time it shows up in EBITDA, 12–18 months of enterprise value may have been destroyed.
The Correct Approach: Segment, Don't Generalize
The correct approach is to apply the Chapter 3 risk spectrum and Chapter 4 moat assessment to every SaaS investment individually — and to structure portfolio allocation around the category-level risk/return profiles documented throughout this report.
For investment committees, this means rejecting any deal memo that describes a SaaS target as "exposed to AI risk" or "insulated from AI disruption" without specifying: (a) which Chapter 3 category the target belongs to, (b) which Chapter 4 moat mechanisms are present (with evidence), (c) how the target scores on the feature defensibility framework from this chapter, and (d) what the probability-weighted return looks like across Chapter 5's four scenarios.
As Bain & Company concluded, "disruption is mandatory, but obsolescence is optional." The SaaS companies that will be obsolete are identifiable today — they are the ones in Categories 1 and 3a without data moats, integration depth, or regulatory lock-in. The ones that will thrive are equally identifiable — they are in Categories 4 and 5, and in the deep end of Category 3b. PE firms that can distinguish between these segments will capture the dispersion premium that the Polarization scenario projects. Those that apply blanket narratives in either direction will not.
Additional "Stop Doing" Directives
The three traps above are the primary value destroyers. The following four additional directives address secondary but still significant risks.
Stop Anchoring to 2021 Exit Multiples
Public SaaS multiples surged to 26.1x EV/EBITDA in H2 2021, driven by abundant capital, ultra-low interest rates, and aggressive growth-focused investment.3 The momentum peaked in H2 2022 before a rapid correction began as rising interest rates shifted investor focus toward profitability. Through 2023 and 2024, EV/EBITDA multiples remained anchored in the 17–22x range.
Valuation mismatches persist: Buyers remain hesitant to pay 2021-era multiples, while sellers are reluctant to accept markdowns. High entry costs mean many portfolio companies were acquired at peak multiples, leaving managers waiting for pricing to recover before selling.
Any business plan requiring a return to 15x+ revenue multiples at exit is unrealistic. Chapter 5's base case (Polarization) projects median SaaS EV/Revenue of 5.0–7.0x by 2031 — far below the 15–20x peaks, though these projections are subject to the scenario probabilities and conditions outlined in Chapter 5's methodology. PE firms whose underwriting models assume multiple expansion to 2021 levels are building returns on an assumption the market has structurally rejected. Under the Commoditization bear scenario (10–15% probability), the median could compress to 2.0–3.0x. Any investment thesis that cannot generate acceptable returns at a 5–7x exit multiple should be restructured or rejected.
The exit landscape has structurally shifted. In today's high-rate environment, exit options have narrowed, financing has become more expensive, and holding periods have lengthened. Last year, average buyout holding periods rose to 6.7 years from a two-decade average of 5.7 years, with the exit backlog now bigger than at any point since 2005, according to McKinsey research. Fund managers must model exits at 4–7x revenue (or 15–22x EBITDA) as the base case, with upside scenarios reserved for genuinely differentiated assets that qualify as "Fortress" or "AI-Enhanced Winner" under Chapter 4's classification.
Stop Treating AI Readiness as a Checkbox
AI readiness is not a binary state — it is a spectrum. Too many PE diligence processes treat AI as a single line item: "Does the target have an AI strategy? Yes/No." This is inadequate. As Chapter 6 documented, AI readiness encompasses five dimensions: strategy, data readiness, infrastructure, talent, and governance. Each dimension operates on a maturity scale from 1 (no capability) to 5 (AI-native).
A target that scores 2 across all five dimensions is fundamentally different from one that scores 5 on data readiness and 1 on governance — yet both might be described as "having some AI capability" in a superficial diligence process. Gartner projects that 40% of enterprise applications will be integrated with task-specific AI agents by the end of 2026, up from less than 5% in 2025, as organizations accelerate digital transformation. Yet ambition without capability is a risk in itself: Gartner warns that many agentic AI projects are over-ambitious and that more than 40% will be scrapped by 2027 unless carefully scoped and validated.
The diligence protocol must assess each dimension independently and produce a composite maturity score that informs the operating plan. A company with strong data readiness (score 4–5) but weak AI talent (score 1–2) has a clear, addressable gap. A company with weak data readiness (score 1–2) has a structural impediment that talent alone cannot solve. These are fundamentally different investment cases requiring fundamentally different operating plans and hold-period timelines.
Stop Ignoring Pricing Model Risk
A company generating 100% of its revenue from per-seat pricing is carrying significant unpriced risk — and this risk is frequently invisible in traditional PE financial models because per-seat revenue has historically been the most predictable form of SaaS revenue.
IDC's FutureScape 2026 research predicts that by 2028, pure seat-based pricing will be obsolete as AI agents rapidly replace manual repetitive tasks with digital labor, forcing 70% of vendors to refactor their value proposition into new models. The specific IDC report is the IDC FutureScape: Worldwide Agentic Artificial Intelligence 2026 Predictions (published October 2025). IDC predicts that by 2028, pure seat-based pricing will be obsolete, with 70% of software vendors refactoring their pricing strategies around new value metrics, such as consumption, outcomes, or organizational capability.
Separately, the transition toward non-seat-based models is already well advanced. Metronome's 2025 State of Usage-Based Pricing report found that 85% of respondents either already had usage-based pricing or were planning to adopt it, spanning all categories of SaaS across businesses ranging from less than $20M ARR to over $100M ARR. With 77% of the largest software companies incorporating consumption-based pricing into their revenue models, UBP is no longer an emerging strategy but a mainstream business model validated by enterprise companies. However, true outcome-based pricing (tying revenue to measurable business results rather than usage or seats) remains far less mature. According to Bain & Company, the measurement challenge is the primary reason only 17% of enterprise SaaS vendors have implemented true outcome-based pricing.
When an AI agent can log into a system and perform research, analysis, and drafting in seconds, the corporation doesn't need to buy 500 licenses for its 500 junior employees. It might only need 50. This creates a volume collapse that legacy SaaS pricing models were never designed to handle.
The risk is not theoretical. AI is now performing operational work and billing the business through SaaS. Costs are rising as usage-based pricing replaces traditional license models. SaaS leaders must prove value, not just track usage. PE firms must model seat-reduction scenarios — 15%, 30%, and 50% over the hold period — for every SaaS target with majority per-seat revenue. If the company cannot demonstrate a credible pricing migration path (the three-stage approach from Chapter 6: add-on SKUs → hybrid pilot → full migration), the entry multiple must be discounted to reflect the unhedged pricing model risk.
The AI-driven rise in usage-based and hybrid models has introduced a new form of cost volatility that traditional PE financial models do not capture. The signal is unmistakable: new AI investments and market dynamics — not sprawl — are increasing pressure on budgets. Vendors are layering in AI tiers, shifting to consumption pricing, and charging premiums that inflate spend without adding new tools. As AI features are embedded into existing platforms, contracts that once felt predictable now scale in unfamiliar ways. Even well-governed portfolios are absorbing these increases, leaving CIOs, SAM, and Procurement teams exposed to unplanned mid-contract costs.
Stop Underestimating the Speed of Disruption
The final "stop doing" item addresses the most consistently misjudged variable in the current environment: the speed at which AI capabilities improve and costs decline.
On June 10, 2025, OpenAI announced a substantial price cut on o3, its flagship reasoning large language model, slashing costs by a whopping 80% for both input and output tokens. Previously, its high cost limited adoption at $10 per million input tokens and $40 per million output tokens. OpenAI dropped prices to $2 per million input tokens and $8 per million output tokens — a direct 80% reduction. This happened within months of the model's initial pricing. A PE firm that modeled AI compute costs at the original o3 pricing in their financial model suddenly found their assumptions 80% too high. This is not an anomaly; as Chapter 2 documented, the cost per token for equivalent LLM performance is declining at approximately 10x per year.
The speed of capability advancement is equally underestimated. Microsoft AI CEO Mustafa Suleyman predicts human-level AI performance on professional tasks within 12–18 months, accelerating automation threats. While predictions about AI timelines carry inherent uncertainty — and the history of AI forecasting includes many premature declarations — the directional risk is asymmetric. PE firms must stress-test their hold-period plans against a scenario in which AI capabilities advance 2–3x faster than consensus expectations — the same way they stress-test against interest rate scenarios. The consequences of being surprised by the speed of disruption are asymmetric: being prepared for faster-than-expected change costs relatively little (additional diligence, earlier pricing model pilots), while being surprised by it can destroy a substantial portion of portfolio value.
The cost deflation trajectory in AI has profound implications for SaaS pricing. With AI cost curves declining this rapidly, the concept of essentially free software utilities starts to feel plausible for basic functions. Software was already deflationary; AI is making it exponential. For SaaS vendors, this raises a challenging dynamic in 2026: while many have been busy shifting from seat licenses to usage and outcomes, the declining cost of providing the service could undermine the very rationale for those complex models.
Comprehensive "Stop Doing" Checklist for Investment Committees
The following table consolidates all seven directives into a format suitable for IC review:
| # | Stop Doing | What to Do Instead | Diagnostic Question for IC | Chapter Reference |
|---|---|---|---|---|
| 1 | Overpaying for feature-based differentiation | Price based on data moats, integration depth, and regulatory lock-in; apply Feature Defensibility scoring | "Could a well-funded competitor replicate this feature set in 12 months using AI tools?" | Ch. 3 (Risk Spectrum), Ch. 4 (Moats) |
| 2 | Assuming AI cost savings = automatic value creation | Require dual-use AI deployment: cost savings AND revenue expansion; apply 5-step value framework | "What is the NRR impact of this cost reduction? Where are savings being reinvested?" | Ch. 2 (Economics), Ch. 6 (Playbook) |
| 3 | Treating all SaaS as equally exposed (or safe) | Apply the Chapter 3 risk spectrum individually to every investment; use Middle Tier heatmap | "Which specific Chapter 3 category does this company belong to, and why?" | Ch. 3 (Risk Spectrum), Ch. 5 (Scenarios) |
| 4 | Anchoring to 2021 exit multiples | Model exits at 4–7x revenue (15–22x EBITDA) as the base case | "Does this investment generate acceptable returns at a 5x revenue exit multiple?" | Ch. 1 (Valuations), Ch. 5 (Scenarios) |
| 5 | Treating AI readiness as a checkbox | Assess AI readiness on a five-dimension maturity spectrum (Ch. 6 framework) | "What is this company's AI maturity score across strategy, data, infrastructure, talent, and governance?" | Ch. 6 (Playbook), Ch. 4 (Moats) |
| 6 | Ignoring pricing model risk | Model 15%, 30%, and 50% seat-reduction scenarios for per-seat revenue companies | "What percentage of revenue is per-seat, and what is the migration plan?" | Ch. 2 (Economics), Ch. 6 (Playbook) |
| 7 | Underestimating speed of disruption | Stress-test hold-period plans against 2–3x faster AI advancement | "What happens to this company's value if AI capability advances twice as fast as we expect?" | Ch. 2 (Economics), Ch. 5 (Scenarios) |
The Meta-Trap: Pattern-Matching to the Last Cycle
Behind all seven directives lies a single meta-trap that is worth naming explicitly: the tendency to pattern-match the current environment to the last cycle. The PE SaaS playbook of 2015–2023 — acquire recurring revenue, optimize the cost structure, improve sales efficiency, exit at a healthy multiple — was brilliantly effective because the macro environment rewarded it. SaaS multiples expanded, growth was abundant, and the primary competitive risk was other SaaS vendors.
That macro environment has fundamentally changed. The competitive risk now includes foundation model companies entering vertical markets, enterprise customers building their own tools, AI agents replacing human users who justify per-seat pricing, and cost structures that include variable compute that did not exist in the traditional SaaS P&L. The PE firms that succeed in the 2026–2031 cycle will be those that recognize these structural differences and update their mental models accordingly — not those that apply a 2019 playbook to a 2026 market.
As one industry observer put it, if 2024 was the year of experimentation and 2025 the year of the proof of concept, then 2026 is shaping up to be the year of scale or fail. Across industries, boards and CEOs are increasingly questioning whether incumbent technology leaders can lead them to the AI promised land. The same question applies to PE firms: can they lead their portfolio companies through this transformation, or will they cling to the playbook that worked in a different era?
The firms that can answer "yes" will find that the current dislocation — the widest SaaS valuation spread in history, the deepest trough multiples since the pre-pandemic era, the most dramatic cost-structure transformation since the cloud transition — represents not a threat but a generational buying opportunity. But seizing that opportunity requires the intellectual honesty to stop doing what no longer works.
The next chapter — "Where Traditional SaaS Can Still Win — And How AI Strengthens Position" — shifts from the cautionary tone of this chapter to a deliberately optimistic, evidence-based counterweight. It identifies three specific archetypes where SaaS companies do not merely survive the AI disruption but are structurally strengthened by it: the System of Record that becomes an AI hub, the vertical platform that deepens its moat through AI-powered workflow intelligence, and the AI-enhanced software company that captures entirely new TAM by automating labor rather than merely digitizing it. For PE investors who have internalized the traps documented in this chapter, Chapter 8 shows where to lean in — with conviction.
Chapter 8: Where Traditional SaaS Can Still Win — And How AI Strengthens Position
Archetype 1: The 'System of Record' That Becomes an AI Hub. Companies like Workday positioning as a secure hub for managing both human and AI workflows. The insight: AI agents are useless without access to the customer history, inventory logs, or codebases that sit within existing SaaS platforms. If you own the system of record, you don't fear AI agents — you become the platform they operate on. Incumbents can charge for AI access to their data and workflows. Example: Salesforce's Agentforce, SAP's Joule Agents, ServiceNow's AI Agents. The PE playbook: identify targets that control the system of record in their vertical and can plausibly become the 'operating system' for AI agents in that domain. These companies benefit from AI adoption rather than being threatened by it.
Archetype 2: The Vertical Platform That Deepens Its Moat. Companies that combine software, proprietary data, regulatory compliance, and physical-world integration in ways that AI cannot easily replicate. Constellation Software's model: acquiring hyper-specific, boring, deeply integrated vertical SaaS companies. The 'Utility + Community' model — software provides daily workflow, community provides trust and peer validation that AI cannot synthesize. In regulated industries, AI INCREASES the need for compliance software. Only 22% of enterprises prioritized AI governance in 2025 — the gap is the opportunity. The PE playbook: focus buy-and-build strategies on vertical platforms with regulatory moats, physical-world integration, and community-driven switching costs.
Archetype 3: The AI-Enhanced Software Company That Captures New TAM. McKinsey's insight: the total addressable market for AI+SaaS has expanded beyond IT budgets to include labor. A SaaS company that automates tasks previously requiring human labor captures a MUCH larger addressable market than one that merely digitizes existing workflows. LogicMonitor's agentic AI solution (Edwin AI) generates average $2M annual savings per customer, driving meaningful NRR uplift. Adobe exited Q1 2025 with $125M in AI product revenue, expected to double by year-end. The PE playbook: invest in companies that can monetize AI not just as a feature but as a new revenue stream that expands their TAM.
Buy-and-Build Implications. How AI reshapes PE SaaS buy-and-build strategies: (a) Platform selection becomes more critical — the anchor acquisition must be defensible, not just growing; (b) Add-on acquisitions should prioritize data assets, vertical expertise, and regulatory capabilities over feature sets; (c) Cross-sector deals are accelerating — incumbents in payments, healthcare, and industrials acquiring SaaS+AI to stay competitive. SaaS M&A hit record volumes in Q3 2025 (746 transactions, +26% YoY). VC is concentrating in fewer, larger rounds favoring category leaders.
This chapter should leave the reader with the conviction that SaaS is not dying — it is being reorganized around AI-era defensibility principles — and that PE firms that understand this reorganization have a historic buying opportunity.*
- Re-verified financial metrics — All key claims confirmed via official filings and earnings reports
- CAGR harmonization — Will explain the variance explicitly
- Workday CEO transition — Must update: Eschenbach stepped down Feb 9, 2026; Bhusri returned as CEO
- Mid-market PE portfolio examples per archetype
- Archetype Identification Decision Tree figure description
- Bridge to Executive Summary PE implications
- Risks within winning archetypes added
- Growth rate projections in quantitative table
The preceding two chapters have presented a deliberately cautionary perspective. Chapter 6 outlined the comprehensive operating playbook PE firms must execute to navigate the AI disruption. Chapter 7 identified the specific traps that destroy value — from overpaying for feature-based differentiation to treating AI cost savings as automatic value creation to applying blanket narratives to a bifurcating sector. This chapter provides the necessary counterweight: a rigorous, evidence-based argument for where SaaS not only survives but is structurally strengthened by AI.
The argument is not speculative. The global SaaS market remains on a robust growth trajectory, though published market-sizing estimates vary meaningfully depending on scope, methodology, and forecast horizon. Grand View Research estimates the global SaaS market at $399.10 billion in 2024, projecting it to reach $819.23 billion by 2030 at a CAGR of 12.0% from 2025 to 2030. Fortune Business Insights projects the market to grow from $375.57 billion in 2026 to $1,482.44 billion by 2034, exhibiting a CAGR of 18.7% during the forecast period. Statista projects worldwide SaaS revenue to reach $428.78 billion in 2025, demonstrating an annual growth rate (CAGR 2025–2030) of 15.65%, leading to a market volume of $887.05 billion by 2030. The variance across these estimates — ranging from approximately 12% to 18.7% CAGR — reflects differences in market definition (some include only public cloud SaaS subscription revenue; others include services, embedded finance, and hybrid deployments), base-year sizing, and the extent to which AI-augmented revenue streams are included. For PE diligence purposes, a midpoint CAGR of approximately 15–16% across the broad SaaS market is a reasonable planning assumption, with the recognition that individual subsectors will diverge dramatically around that average — the entire thesis of this report.
This is not a dying industry. It is a reorganizing one — and the PE firms that can identify where value is concentrating have a historic buying opportunity.
The structural logic is straightforward: AI agents do not operate in a vacuum. They need data to reason over, systems to read from and write to, workflows to execute within, and governance frameworks to operate under. The SaaS companies that provide those data, systems, workflows, and governance layers are not threatened by AI adoption — they are the infrastructure upon which AI adoption depends. The question for PE investors is not "Does SaaS survive AI?" but rather "Which SaaS companies become the operating system for the AI-augmented enterprise?"
This chapter identifies three specific archetypes where traditional SaaS companies become AI-era winners, provides concrete examples with current performance data verified through official filings as of mid-February 2026, and distills the PE playbook for capitalizing on each. It concludes with implications for buy-and-build strategies — the dominant PE value creation mechanism in SaaS — and how AI reshapes the calculus of platform selection, add-on acquisition criteria, and cross-sector deal flow. The archetypes map directly to the five-year playbook outlined in the Executive Summary: Archetype 1 (System of Record → AI Hub) represents the immediate action category for PE — assets to acquire now at post-sell-off valuations; Archetype 2 (Vertical Platform Deepening Moat) represents the compounding mid-term thesis; and Archetype 3 (AI-Enhanced TAM Expansion) represents the highest-upside long-term opportunity that reshapes portfolio construction by 2030.
Archetype 1: The "System of Record" That Becomes an AI Hub
The Core Insight: If You Own the Data, AI Agents Work for You
The most powerful counter-narrative to the "AI kills SaaS" thesis is this: AI agents are useless without access to the data and workflows that sit within existing SaaS platforms. A customer service agent needs the customer's full interaction history. A financial planning agent needs the company's general ledger, budget allocations, and historical performance data. A supply chain agent needs inventory records, supplier agreements, and logistics data. A recruiting agent needs the organizational chart, job descriptions, compensation benchmarks, and skills taxonomies.
All of this data lives in systems of record — the Workdays, Salesforces, SAPs, ServiceNows, and Oracles of the world. If you own the system of record, you do not fear AI agents — you become the platform they operate on. This transformation is already underway at every major SaaS incumbent, and the early results are striking.
Workday: The Agent System of Record
Workday has announced the Agent System of Record to help organizations manage their entire fleet of AI agents — from Workday and third parties alike — in one place. The Agent System of Record provides an efficient, secure way to onboard new AI agents, define their roles and responsibilities, track their impact, budget and forecast their costs, support compliance, and foster continuous improvement.
The strategic framing is explicit. Workday co-founder Aneel Bhusri stated: "The workforce of the future will include both humans and AI agents, and businesses that don't learn to manage this incredibly complex reality will quickly fall behind."
Workday CEO Carl Eschenbach, at the World Economic Forum in Davos in January 2026, called the narrative that AI is killing software "overblown" and "not true," describing AI as a tailwind and "absolutely not a headwind" for the company. Eschenbach stated: "We have not seen an enterprise replace Workday, and we have 65% of the Fortune 500."
Critical update (February 9, 2026): Carl Eschenbach stepped down as CEO effective February 6, 2026, and co-founder Aneel Bhusri returned to lead the company. Mark Hawkins, Workday's vice chair, framed the transition as necessary: "As we enter a defining moment shaped by AI, there is no one better than Aneel to lead this next chapter." Bhusri declared: "AI is a bigger transformation than SaaS — and it will define the next generation of market leaders. I'm energized to return as CEO." This leadership change, coming amid a 47% stock decline from peak, underscores both the opportunity and the execution risk within this archetype — even companies with the strongest system-of-record positions face investor skepticism and strategic pivots during the AI transition. CFO Zane Rowe projected fiscal 2026 subscription revenue of $8.828 billion, with a non-GAAP operating margin near 29%. Analysts noted that FY2027 subscription revenue guidance of only 13% growth raised concerns about deceleration, and the company cited just 1.5 percentage points of growth attributable to AI. PE investors should note that even the most defensible system-of-record positions require demonstrated AI monetization to sustain premium valuations — a theme we return to in the Risk Acknowledgments section below.
Workday's Illuminate AI engine leverages one of the industry's most robust datasets — over 1 trillion transactions annually — to deliver intelligent automation and contextual insights across HR and finance. This data asset is precisely the kind of customer-generated, compounding data flywheel that Chapter 4 identified as the only durable data moat in the AI era. A foundation model can learn general HR practices from public data, but it cannot replicate the specific compensation benchmarks, performance patterns, and organizational dynamics embedded in a decade of Workday transactional data for a given enterprise.
Workday has introduced AI Flex Credits, a new pricing model that ties AI consumption directly to customer value and use, designed to make AI access more predictable and affordable. This model evolves Workday's licensing from static to usage-based, reflecting how customers actually engage with AI-driven processes. This is exactly the hybrid pricing migration that Chapter 6 recommended.
Salesforce: Agentforce and the Revenue Proof Point
Salesforce provides the most concrete revenue evidence for the "system of record becomes AI hub" thesis. Agentforce and Data 360 annual recurring revenue (ARR) reached nearly $1.4 billion, up 114% year-over-year as of Q3 FY2026 (ended October 31, 2025). Agentforce ARR surpassed half a billion in Q3, up 330% year-over-year, and Salesforce has closed over 18,500 Agentforce deals since launch, with over 9,500 paid deals, up 50% quarter-over-quarter.
The financial trajectory is accelerating. Q3 FY2026 subscription and support revenue reached $9.7 billion, up 10% year-over-year, with total revenue of $10.3 billion, up 9% year-over-year. Salesforce raised fiscal year 2026 revenue guidance to $41.45 billion to $41.55 billion, and Q3 cRPO was up 11% year-over-year at $29.4 billion.
Just over a year after launch, Agentforce has reached 18,500 customers, with more than 9,500 on paid plans — making it the fastest-growing organic product in the company's history. Customer growth is reportedly running at close to 50% quarter-over-quarter. Perhaps the most telling signal is that more than half of Agentforce bookings are driven by existing customers purchasing additional credits, which suggests it is delivering enough value in live environments for customers to expand.
Pricing frictions eased as Salesforce expanded options: premium SKUs such as Agentforce One and Agentforce for apps doubled quarter-over-quarter, and seat-based Agentforce SKUs gained traction for predictability. The company executed 16 AELAs (Agentic Enterprise License Agreements) in Q3 and has roughly 100 in the pipeline.
Important timing note: Salesforce is scheduled to release its Q4 and full-year FY2026 results on February 25, 2026 — eight days after this report's publication date. All figures cited here are based on the most recent official filing (Q3 FY2026, December 3, 2025). Within the broader software sell-off, Salesforce stock has declined 28.38% in 2026. This market reaction — selling off a company delivering 114% AI ARR growth — exemplifies the indiscriminate repricing documented in Chapter 1. It also represents the valuation dislocation that creates PE entry opportunities.
Execution risk acknowledgment: Early success with Agentforce tends to come from well-scoped use cases with clear boundaries and oversight. Whether that approach can translate seamlessly across large, complex Salesforce orgs — many managing significant technical debt — is still uncertain. As agent usage grows, governance and operational discipline are just as important as the agents themselves.
SAP: Joule Agents and the Enterprise AI Operating Layer
SAP's strategy validates the same pattern in the ERP domain. In Q1 2026, SAP Joule Studio agent builder became generally available. Enterprises can design custom Joule agents and skills, using SAP's built-in business knowledge and AI services. SAP now offers 350 AI features, including Joule Agents, along with over 2,400 Joule skills, built on AI Foundation in SAP Business Technology Platform.
At SAP Connect 2025, the company unveiled 14 new Joule Agents spanning finance, HR, procurement, supply chain, and industry-specific scenarios. Each agent is essentially a subject-matter expert. For example, a Cash Management Agent can reason over daily bank statements and automate reconciliations, potentially saving up to 70% of the time finance teams spend on manual cash positioning tasks.
SAP-commissioned research with Oxford Economics, surveying 1,600 executives in medium and large enterprises across eight countries, found that organizations are benefiting from a 16 percent return on AI investments — a number they expect to nearly double within two years.
ServiceNow: The AI Platform for Business Transformation
ServiceNow reported Q4 FY2025 subscription revenues of $3,466 million, representing 21% year-over-year growth, and total revenues of $3,568 million, up 20.5% year-over-year. The company delivered 244 $1 million-plus NNACV transactions, a 98% renewal rate, and expanding multi-product AI deployments. ServiceNow guided FY2026 subscription revenues between $15.53 billion and $15.57 billion.
The company's Now Assist AI product suite more than doubled its net new annual contract value in the quarter compared to the previous year. ServiceNow continues leadership in digital transformation and AI-driven enterprise workflows, serving over 8,800 global customers, including 85% of the Fortune 500.
ServiceNow's focus on deep, back-end workflows gives it a distinct advantage in the essential plumbing of corporate operations. ServiceNow's trajectory fits the broader transition from "GenAI hype" to "Agentic ROI."
Mid-Market PE Exemplars: Archetype 1 in Practice
Enterprise-scale case studies like Salesforce and Workday establish the archetype, but PE investors need mid-market corollaries. Two illustrative examples:
-
Vista Equity's Avalara (tax compliance software): Avalara, a Vista portfolio company that makes tax compliance software, is using a generative AI tool from Drift (now Salesloft) to increase sales rep response time by 65%. Avalara's tax engine is a system of record for sales tax determination — the authoritative data source that AI agents must read from to execute compliant transactions. Its regulatory moat deepens as AI-driven commerce expands the volume and complexity of taxable transactions.
-
Vista Equity's Vena Solutions (FP&A software): Vena Copilot's Planning Agent automates financial planning and analysis (FP&A) by generating optimal budget scenarios, detecting key correlations, and updating assumptions in real time. The solution cuts budgeting cycles by over 60%, driving smarter, faster decisions and creating significant potential savings. Vena's FP&A platform — the system of record for budgets, forecasts, and financial models — becomes the operating surface upon which AI planning agents execute. This exemplifies how a $50–200M ARR mid-market SaaS platform can adopt the same system-of-record-to-AI-hub strategy that Workday pursues at scale.
The PE Playbook for Archetype 1
For PE investors, the system-of-record thesis translates into a specific investment strategy:
-
Identify targets that control the system of record in their vertical. The company must be the authoritative source of data for a critical business function — not just a viewer or analyzer of that data, but the system where the data is created, stored, and governed. Apply Chapter 4's Level 3–4 integration test.
-
Assess the target's plausibility as an "operating system" for AI agents. Can the target plausibly become the platform that AI agents connect to, read from, and write to? Does it have an API infrastructure that supports agentic workflows? Is it developing or can it develop an agent marketplace, governance layer, or orchestration capability?
-
Price the AI monetization upside — but stress-test the timeline. The system-of-record companies documented above are monetizing AI through premium tiers, flex credits, and outcome-based pricing. For a mid-market target, model a scenario where AI features add 10–30% to ARPA (average revenue per account) over the hold period. This revenue is incremental to the existing subscription base and commands premium multiples at exit. However, note the Workday cautionary example: even with a defensible position, AI contributed only 1.5 percentage points of growth in near-term guidance. The revenue materialization timeline may be longer than optimistic projections suggest.
-
Assess data asset defensibility. The data within the system of record must be proprietary, customer-generated, and compounding — meeting all three criteria from Chapter 4's data moat test. Generic data repositories that AI models can replicate do not qualify.
Archetype 2: The Vertical Platform That Deepens Its Moat
The Core Insight: Boring, Integrated, Regulated — and Strengthened by AI
The second archetype is the vertical SaaS platform that combines software, proprietary data, regulatory compliance, and physical-world integration in ways that AI cannot easily replicate — and where AI actually increases the defensibility of the platform.
As Chapter 3 documented, deeply embedded vertical platforms (Category 3b) are assessed at LOW-MEDIUM AI exposure precisely because their moats are grounded in physical-world operations, regulatory requirements, and customer-generated data that foundation models cannot access or replicate. The insight for this chapter is that AI does not merely leave these moats intact — it actively strengthens them.
The Constellation Software Model: Evidence That "Boring" Vertical SaaS Compounds
No company demonstrates the enduring value of vertical SaaS more convincingly than Constellation Software. Since its IPO in 2006, early investors have seen their initial investments compound at a CAGR of almost 36% annually (dividends reinvested). With a humble beginning in Toronto in 1995, Constellation Software has acquired over 500 businesses, focusing on niche vertical market software companies, and serves over 125,000 customers in over 100 countries.
Constellation Software leverages AI integration in vertical SaaS platforms to expand underpenetrated markets and strengthen recurring revenue moats. Q2 2025 results show 15% revenue growth ($2.84B) and 63% operating cash flow increase. AI applications in dental and municipal software optimize workflows (appointment scheduling, predictive analytics), creating tangible ROI for customers. The company's decentralized model enables sector-specific AI customization while maintaining 80%+ EBITDA margins.
Constellation's free cash flow exceeded $2.1 billion in 2024. The portfolio generates a high proportion of recurring revenue (~74–75%) and management indicates strong customer retention, consistent with mission-critical products. The moat is characterized as strong and durable, driven by sticky vertical solutions.
The Constellation model is directly relevant to PE SaaS strategy because it demonstrates that the "boring" end of the SaaS spectrum — hyper-specific, deeply integrated, modest-growth vertical platforms — produces the most durable returns precisely because these companies resist the disruption pressures documented in Chapters 1–3.
How AI Deepens Vertical Platform Moats
The mechanism by which AI strengthens vertical platform defensibility operates through four reinforcing dynamics:
Dynamic 1: Vertical AI engines outperform general-purpose models. As Chapter 4 documented, models fine-tuned on industry-specific corpora consistently outperform general models on domain tasks. A construction management platform with a decade of project data, safety incident reports, and financial records can train a vertical AI engine that delivers superior predictions for project delays, cost overruns, and safety risks compared to any general-purpose model. Each customer interaction further trains the model, deepening the proprietary data moat.
Dynamic 2: AI increases regulatory complexity, creating more demand for compliance software. As Chapter 4 documented extensively, only 22% of enterprises in 2025 prioritized AI governance policy with a visible, defined AI strategy, despite investment increasing rapidly. The EU AI Act, evolving HIPAA requirements, SEC examination priorities, and financial services AI oversight are all expanding the compliance surface area. For vertical SaaS platforms that already manage regulatory compliance in their domains, AI-related governance requirements represent incremental, high-margin functionality that deepens customer lock-in.
Dynamic 3: The "Utility + Community" model resists AI disruption. The most defensible vertical platforms combine daily-use workflow software with community-driven peer networks. A platform for property managers that provides lease management, maintenance tracking, and rent collection (the utility) alongside a peer network of 10,000 property management professionals sharing best practices (the community) creates switching costs that transcend any individual software feature. As Chapter 4 stated: you can clone a codebase in a week; you cannot clone a network of 500 high-level CFOs who trust each other. AI cannot synthesize trust.
Dynamic 4: Physical-world integration creates barriers that software alone cannot overcome. As documented in Chapter 4's analysis of the Procore case study, deeply embedded vertical platforms control physical operations — construction site safety protocols, manufacturing equipment maintenance schedules, delivery route optimization. Replacing such a platform requires rewiring the physical world, not just migrating data.
Mid-Market PE Exemplars: Archetype 2 in Practice
-
Vista Equity's Duck Creek Technologies (insurance software): Duck Creek's FNOL (First Notice of Loss) agent Felix streamlines claim intake and proactively tackles the $80B+ insurance fraud problem. It analyzes audio, images, and text to perform data entry, detect fraud, and assign claims — lowering operational costs, improving accuracy, and boosting customer retention. Duck Creek operates as the system of record for property and casualty insurance policy administration — a vertical platform where regulatory compliance (state-by-state insurance regulations), physical-world integration (claims processing tied to real-world events), and proprietary data (actuarial history) combine to create compound moats that AI deepens rather than erodes.
-
Vista Equity's Jaggaer (procurement software): Jaggaer's JAI Workflow Builder automates contract lifecycle management from vendor onboarding to RFPs, reducing negotiation timelines. The intelligent contract system flags risks, ensures compliance, and leverages historical data for critical contract negotiations. Jaggaer serves specialized procurement verticals (higher education, public sector, manufacturing) where compliance requirements and domain-specific workflows create the vertical depth that characterizes Archetype 2.
The PE Playbook for Archetype 2
-
Focus buy-and-build strategies on vertical platforms with regulatory moats. The regulatory tailwind documented above is the single most predictable growth vector in SaaS. Identify vertical platforms in healthcare IT, financial services, legal, environmental compliance, or construction safety that already manage compliance workflows. AI governance requirements create natural expansion opportunities within the existing customer base.
-
Prioritize physical-world integration as a diligence criterion. When evaluating vertical SaaS targets, ask: "Does this software control physical operations, equipment, or facilities?" If yes, the switching costs are grounded in the physical world and resist AI-driven erosion. If the software merely provides analytics or reporting on physical operations, the moat is shallower.
-
Assess community-driven switching costs. Vertical platforms with active user communities — annual conferences, peer benchmarking, professional certification programs, regional user groups — possess a social moat that compounds over time. Quantify community engagement: active forum users, conference attendance, certification program enrollment. A platform with 5,000 actively engaged community members is far more defensible than one with 50,000 passive users.
-
Apply the Constellation Software acquisition criteria. As Chapter 3 documented, Constellation targets the number 1 or number 2 market-share holder in a niche vertical, with revenues of at least $5 million, hundreds or thousands of customers, and unimposing competitors. Constellation anticipates acquisition spending of approximately $1.8 billion for 2025–2026, increasing to $2.25 billion by 2029 — a clear signal that the most successful acquirer in software history is increasing its commitment to vertical SaaS during the AI disruption, not retreating from it.
Archetype 3: The AI-Enhanced Software Company That Captures New TAM
The Core Insight: AI Expands the Addressable Market from Software Budgets to Labor Budgets
The third archetype represents the most transformative — and highest-upside — opportunity for PE investors. It is the SaaS company that uses AI not merely as a feature enhancement but as a mechanism to capture an entirely new addressable market: labor.
Previous McKinsey research indicates that as much as $4.4 trillion of incremental economic potential could be generated from AI-driven increased productivity. The total addressable market for AI+SaaS has expanded beyond IT budgets to include labor — and momentum appears to be building.
This is a profound shift. Traditional SaaS competed for a slice of the enterprise IT budget — typically 3–5% of revenue for most companies. AI-enhanced SaaS that automates tasks previously requiring human labor competes for a slice of the labor budget — typically 30–50% of revenue. The addressable market expansion is an order of magnitude.
McKinsey and Goldman estimates suggest that roughly 25–30% of work could realistically be automated in the near term, equating to $1.2 trillion worth of work. Startups are pitching something fundamentally bigger: AI that doesn't just improve workflows but fully owns them.
Where TAM Expansion Is Already Measurable
The TAM expansion thesis is not theoretical. It is already producing measurable revenue results at companies that have successfully positioned their AI capabilities as labor substitutes.
As documented in Chapter 6, Adobe exited Q1 2025 with $125 million in revenue from stand-alone AI products, with the company expecting AI-fueled revenue to double by year-end. While still a fraction of Adobe's $5.7 billion quarterly revenue, this represents an entirely new revenue category that did not exist 18 months prior — revenue that comes from automating creative labor tasks, not from selling additional software seats.
Vista Equity's LogicMonitor, which offers AI-powered data center transformation software, uses its SaaS-based monitoring platform with generative AI to summarize complex alerts from multiple sources of data. It pinpoints existing problems rapidly and accurately while predicting new ones before they happen. LogicMonitor's agentic AI solution, Edwin AI, has been generating significant savings for customers, exemplifying the labor-replacement pricing thesis. The company's valuation reached $2.4 billion including debt, compared to Vista's original acquisition at approximately $415 million in 2018 — a roughly 5.8x return on a platform that successfully transitioned to AI-enhanced monitoring.
The shift toward sophisticated AI agents is why founders increasingly believe they can significantly reduce or replace labor spending. By directly tackling tasks traditionally performed by humans, agents can claim budgets previously allocated to payroll. We've seen concrete examples from companies like EvenUp, which generate demand packages end-to-end, or companies like Decagon and Sierra, which can resolve ~50% of customer support queries end to end.
Mid-Market PE Exemplar: Archetype 3 in Practice
- Ramp (AI-powered spend management): Ramp reached $1B+ ARR by October 2025, with a $32B valuation, 100% year-over-year growth, 50K+ customers, and is free cash flow positive. Ramp's AI automates expense management, invoice processing, and vendor negotiation — work previously performed by accounts payable clerks and procurement staff. Its pricing captures value from labor budget displacement, not software budget allocation. While Ramp's current valuation may be prohibitive for most PE funds, the model illustrates what TAM expansion looks like in practice: a company that grew from zero to $1B ARR in under five years by pricing against labor costs rather than competing for software budgets. Mid-market PE investors should search for domain-specific equivalents at earlier stages ($10–50M ARR) in verticals like legal billing, clinical documentation, or regulatory filing.
The Pricing Model Enables TAM Capture
The critical enabler of TAM expansion is the pricing model evolution documented in Chapter 6. Under traditional per-seat pricing, a SaaS company's revenue is capped by the number of human users. Under outcome-based or usage-based pricing, revenue is tied to the volume of work performed — and AI agents can perform vastly more work than human users.
Consider a concrete example. A legal technology platform that charges $150 per user per month for contract review tools has its revenue capped by the number of lawyers and paralegals who use it. The same platform, enhanced with AI that performs automated contract analysis, can shift to outcome-based pricing: $5 per contract reviewed. If the AI reviews 100,000 contracts per month (a volume impossible for human users), the revenue potential expands from $150 × 100 users = $15,000/month to $5 × 100,000 contracts = $500,000/month — a 33x revenue expansion from the same customer. The platform has captured labor budget dollars that previously went to junior associates and contract review outsourcing firms.
Companies already comfortable paying external providers (call centers, invoice processing, basic legal work) are more likely to quickly adopt agentic solutions. The leap from paying a human contractor $10 per ticket to paying an AI agent $3 per ticket feels natural, not revolutionary.
The Conditions for Successful TAM Expansion
Not every SaaS company can capture labor TAM. The conditions for success, informed by the frameworks in Chapters 3 and 4, are:
The company must own the workflow, not just the data. To capture labor spend, the platform must be the system where the work is actually done — not merely a reporting or analytics layer.
The AI must deliver measurable, verifiable outcomes. Chapter 7's Trap 2 documented that 56% of companies see no AI ROI. TAM expansion requires quantifiable value that customers can verify against their existing labor costs.
The pricing model must align with value capture. As Chapter 6 documented, 83% of AI-native SaaS companies already offer usage-based pricing. Companies pursuing TAM expansion should migrate to outcome-based or volume-based pricing that scales with the work performed.
The company must have domain expertise that prevents generic AI substitution. A platform offering generic AI-powered text summarization cannot capture labor TAM because the same capability is available from ChatGPT at near-zero cost. A platform offering AI-powered clinical documentation that integrates with EMR systems, follows HIPAA-compliant workflows, and uses domain-specific medical terminology captures labor TAM because the generic alternative cannot meet the compliance, integration, and accuracy requirements.
The PE Playbook for Archetype 3
-
Invest in companies that can monetize AI as labor replacement, not just feature enhancement. The diagnostic question: "Is this company's AI pricing against competing software tools (feature enhancement) or against the customer's labor costs (TAM expansion)?" If the answer is the former, the revenue upside is incremental. If the latter, the revenue upside is transformational.
-
Model the TAM expansion explicitly in the financial underwriting. Build a revenue scenario that quantifies the labor spend the target's AI features could capture. Start with the customer's current spend on the task the AI automates, calculate the AI's throughput advantage versus human workers, and model a pricing structure that captures 20–40% of the labor cost savings (leaving 60–80% for the customer as ROI).
-
Prioritize companies in labor-scarce verticals. Fast-growing industries or functions where companies simply can't hire quickly enough — healthcare coding, cybersecurity monitoring, sales outreach — are areas starved for reliable labor. AI here doesn't replace existing jobs; it fills roles companies can't staff.
-
Look for platforms where AI throughput exceeds human throughput by 10x or more. The revenue expansion math only works when the AI can perform orders of magnitude more work than human users.
Risks Within Winning Archetypes: A Necessary Acknowledgment
Even the three winning archetypes carry material execution risks that PE investors must underwrite. Maintaining rigor requires explicitly acknowledging these rather than treating the archetypes as risk-free categories.
Archetype 1 Risks — System of Record → AI Hub:
- AI monetization timeline risk. Workday's experience — strong system-of-record position but only 1.5 percentage points of near-term growth attributable to AI — demonstrates that converting defensible data positions into incremental revenue can take longer than market expectations allow. Analysts questioned whether AI was contributing meaningfully to Workday's growth, and FY2027 guidance of 13% subscription revenue growth raised concerns about deceleration.
- Platform migration risk. If AI agents become increasingly platform-agnostic (operating across systems via protocols like MCP), the lock-in value of being "the platform agents run on" may diminish. The value shifts to data, not integration.
- Cost of AI infrastructure. As Chapter 2 documented, inference costs create gross margin pressure. Systems of record that embed AI must manage the cost of serving AI features to their large customer bases without eroding the gross margins that justify premium multiples.
Archetype 2 Risks — Vertical Platform Deepens Moat:
- Growth ceiling. The same niche focus that creates defensibility also limits TAM. PE investors targeting 3x+ MOIC need to ensure the vertical is large enough or the platform can expand into adjacent verticals.
- Talent scarcity. Vertical AI requires both domain expertise and AI engineering capability — a rare combination. Constellation's decentralized model mitigates this but smaller PE-owned platforms may struggle to recruit.
Archetype 3 Risks — AI-Enhanced TAM Expansion:
- Gross margin uncertainty. Labor replacement pricing is attractive at the revenue line but inference-heavy workloads compress gross margins. If a platform charges $5 per contract reviewed but spends $3 on inference, the margin profile resembles a services business, not a software business.
- Competitive convergence. If multiple vendors offer AI-powered labor replacement in the same domain, pricing compresses toward marginal cost. The window for premium pricing may be shorter than underwriting assumptions suggest.
- Reliability risk. AI agents that perform work autonomously face a higher accuracy bar than AI assistants that augment human workers. A single high-profile failure (e.g., an AI-generated legal filing with errors) can destroy trust and adoption momentum for an entire category.
These risks do not invalidate the archetypes — they define the diligence questions that separate successful PE investments from value traps within each category.
Buy-and-Build Implications: How AI Reshapes PE SaaS M&A Strategy
The three archetypes above have direct and specific implications for the buy-and-build strategies that dominate PE value creation in SaaS. SaaS M&A reached a record 746 transactions in Q3 2025, on pace to exceed 2,500 deals for the year. Deal volume surged more than 26% quarter-over-quarter, fueled largely by a dominant shift toward private equity. PE buyouts captured two-thirds of total deal value.
2026 will be defined by three forces: accelerating AI adoption, increasing return dispersion across managers and asset classes, and a reopening of transaction and exit markets. The advantage will accrue to scaled, data-driven investment platforms with long-duration capital and proprietary operational capabilities. Financial engineering alone will not generate alpha when entry multiples remain elevated and leverage is constrained. The firms that can drive genuine business improvement at the portfolio company level, particularly in revenue growth, pricing, and go-to-market effectiveness, will separate from the pack.
Implication 1: Platform Selection Becomes the Single Most Critical Decision
In the pre-AI era, buy-and-build platform selection was primarily driven by growth rate, market size, and management quality. In the AI era, defensibility is the primary criterion. The anchor acquisition must be defensible — not just growing — because the add-on acquisitions and operational improvements that create buy-and-build value are worthless if the platform itself is structurally exposed to AI disruption.
Apply Chapter 4's decision tree to every prospective platform acquisition. Only targets classified as "Fortress" or "AI-Enhanced Winner" should serve as anchor platforms. The scoring framework from Chapter 7 provides a quantitative filter: anchor platforms should score above 18 on the Feature Defensibility Assessment (out of 25 possible points), mapping to Chapters 3 and 4.
Implication 2: Add-On Acquisitions Should Prioritize Data Assets Over Feature Sets
The traditional add-on thesis was: acquire companies with complementary features, integrate them, and cross-sell. Chapter 7 documented why this logic is eroding — feature-based differentiation is being commoditized by AI.
The AI-era add-on thesis replaces features with data: acquire companies that possess proprietary, customer-generated data assets that enhance the platform's vertical AI engine. The data flywheel effect documented in Chapter 4 means that each add-on acquisition with proprietary data makes the platform's AI more capable.
| Traditional Add-On Criterion | AI-Era Add-On Criterion | Why the Shift Matters |
|---|---|---|
| Complementary feature set | Proprietary data asset that enhances vertical AI | Features commoditize; data compounds |
| Revenue synergy from cross-sell | Data synergy that improves AI model performance | Cross-sell is table stakes; data-driven AI is differentiation |
| Overlapping customer base for consolidation | Adjacent customer segments that expand training data | More diverse data = more robust AI = broader applicability |
| Geographic expansion | Regulatory expertise in new jurisdictions | AI governance requirements create compliance barriers per jurisdiction |
| Technology stack alignment | Data schema compatibility and integration depth | AI agents need structured, clean data; incompatible schemas destroy value |
Implication 3: Vertical SaaS With Embedded Finance Commands Premium Multiples
Vertical SaaS with embedded finance has emerged as the premium valuation category, with platforms integrating payments and lending achieving 7.0–9.5x EV/Revenue multiples compared to 4.8–6.2x for horizontal infrastructure solutions. Sector-specific platforms accounted for 54% of SaaS M&A deal volume, driven by demand for resilient, high-value companies in healthcare, financial services, and real estate software.
This premium reflects the compound moat: vertical workflow ownership + proprietary data + financial transaction processing + regulatory compliance.
Implication 4: Cross-Sector Deals Are Accelerating
A significant and accelerating trend in SaaS M&A is the entry of non-technology acquirers — incumbents in payments, healthcare, industrials, and financial services — acquiring SaaS + AI capabilities to stay competitive. Median deal size has compressed from $67 million in 2021 to $41 million in Q1 2025, reflecting PE's systematic execution of buy-and-build strategies. Transactions under $500 million represent 82% of total deal count.
For PE funds, this creates a specific exit opportunity: vertical SaaS platforms with AI capabilities and proprietary data are increasingly attractive to strategic buyers from adjacent industries. The sell-side narrative for Archetype 1 targets should emphasize the platform's role as an AI hub; for Archetype 2, the regulatory moat and community lock-in; for Archetype 3, the TAM expansion and labor replacement economics.
The Quantitative Case: SaaS Categories That Outperform
To ground the three archetypes in valuation data, the following table synthesizes the buy-case for each archetype using the frameworks from Chapters 3 and 5, with growth rate projections tied to Chapter 5's scenario analysis:
| Archetype | Ch. 3 Category | Current EV/Rev (Post-Sell-Off) | Implied Rev. Growth 2026–2031 | Polarization Base EV/Rev (2031) | Upside Scenario EV/Rev (2031) | Key Value Driver |
|---|---|---|---|---|---|---|
| 1: System of Record → AI Hub | Cat. 5 (Mission-Critical) | 3.5–5.5x | 12–18% (accelerating via AI monetization) | 7.0–12.0x | 8.0–14.0x | AI monetization premium + platform expansion |
| 2: Vertical Platform Deepens Moat | Cat. 3b (Deep Vertical) | 3.0–5.0x | 10–16% (steady, with AI-driven upsell) | 6.0–12.0x | 8.0–14.0x | Regulatory tailwind + vertical AI engine |
| 3: AI-Enhanced TAM Expansion | Cat. 4/3b Hybrid | 4.0–6.0x | 18–30%+ (labor TAM capture) | 8.0–15.0x | 12.0–20.0x | Labor budget capture + outcome-based pricing |
| Ref: Structurally Exposed SaaS | Cat. 1 (Horizontal) | 1.5–2.5x | 0–8% (decelerating) | 1.0–3.0x | 4.0–6.0x (Augmentation only) | None — pricing pressure, seat compression |
Growth projections align with Chapter 5 scenario assumptions: Polarization (50% probability) assumes AI-driven category divergence accelerates through 2028; Upside/Augmentation (20% probability) assumes faster AI adoption with collaborative rather than substitutive dynamics.
The spread between the buy-case archetypes and structurally exposed SaaS is stark: 3–10x multiple differential at exit under the Polarization base case. This is why the frameworks in Chapters 3 and 4 are not academic exercises — they translate directly into return differentials that determine whether a PE fund's SaaS portfolio generates 1.5x or 3.5x MOIC over the hold period.
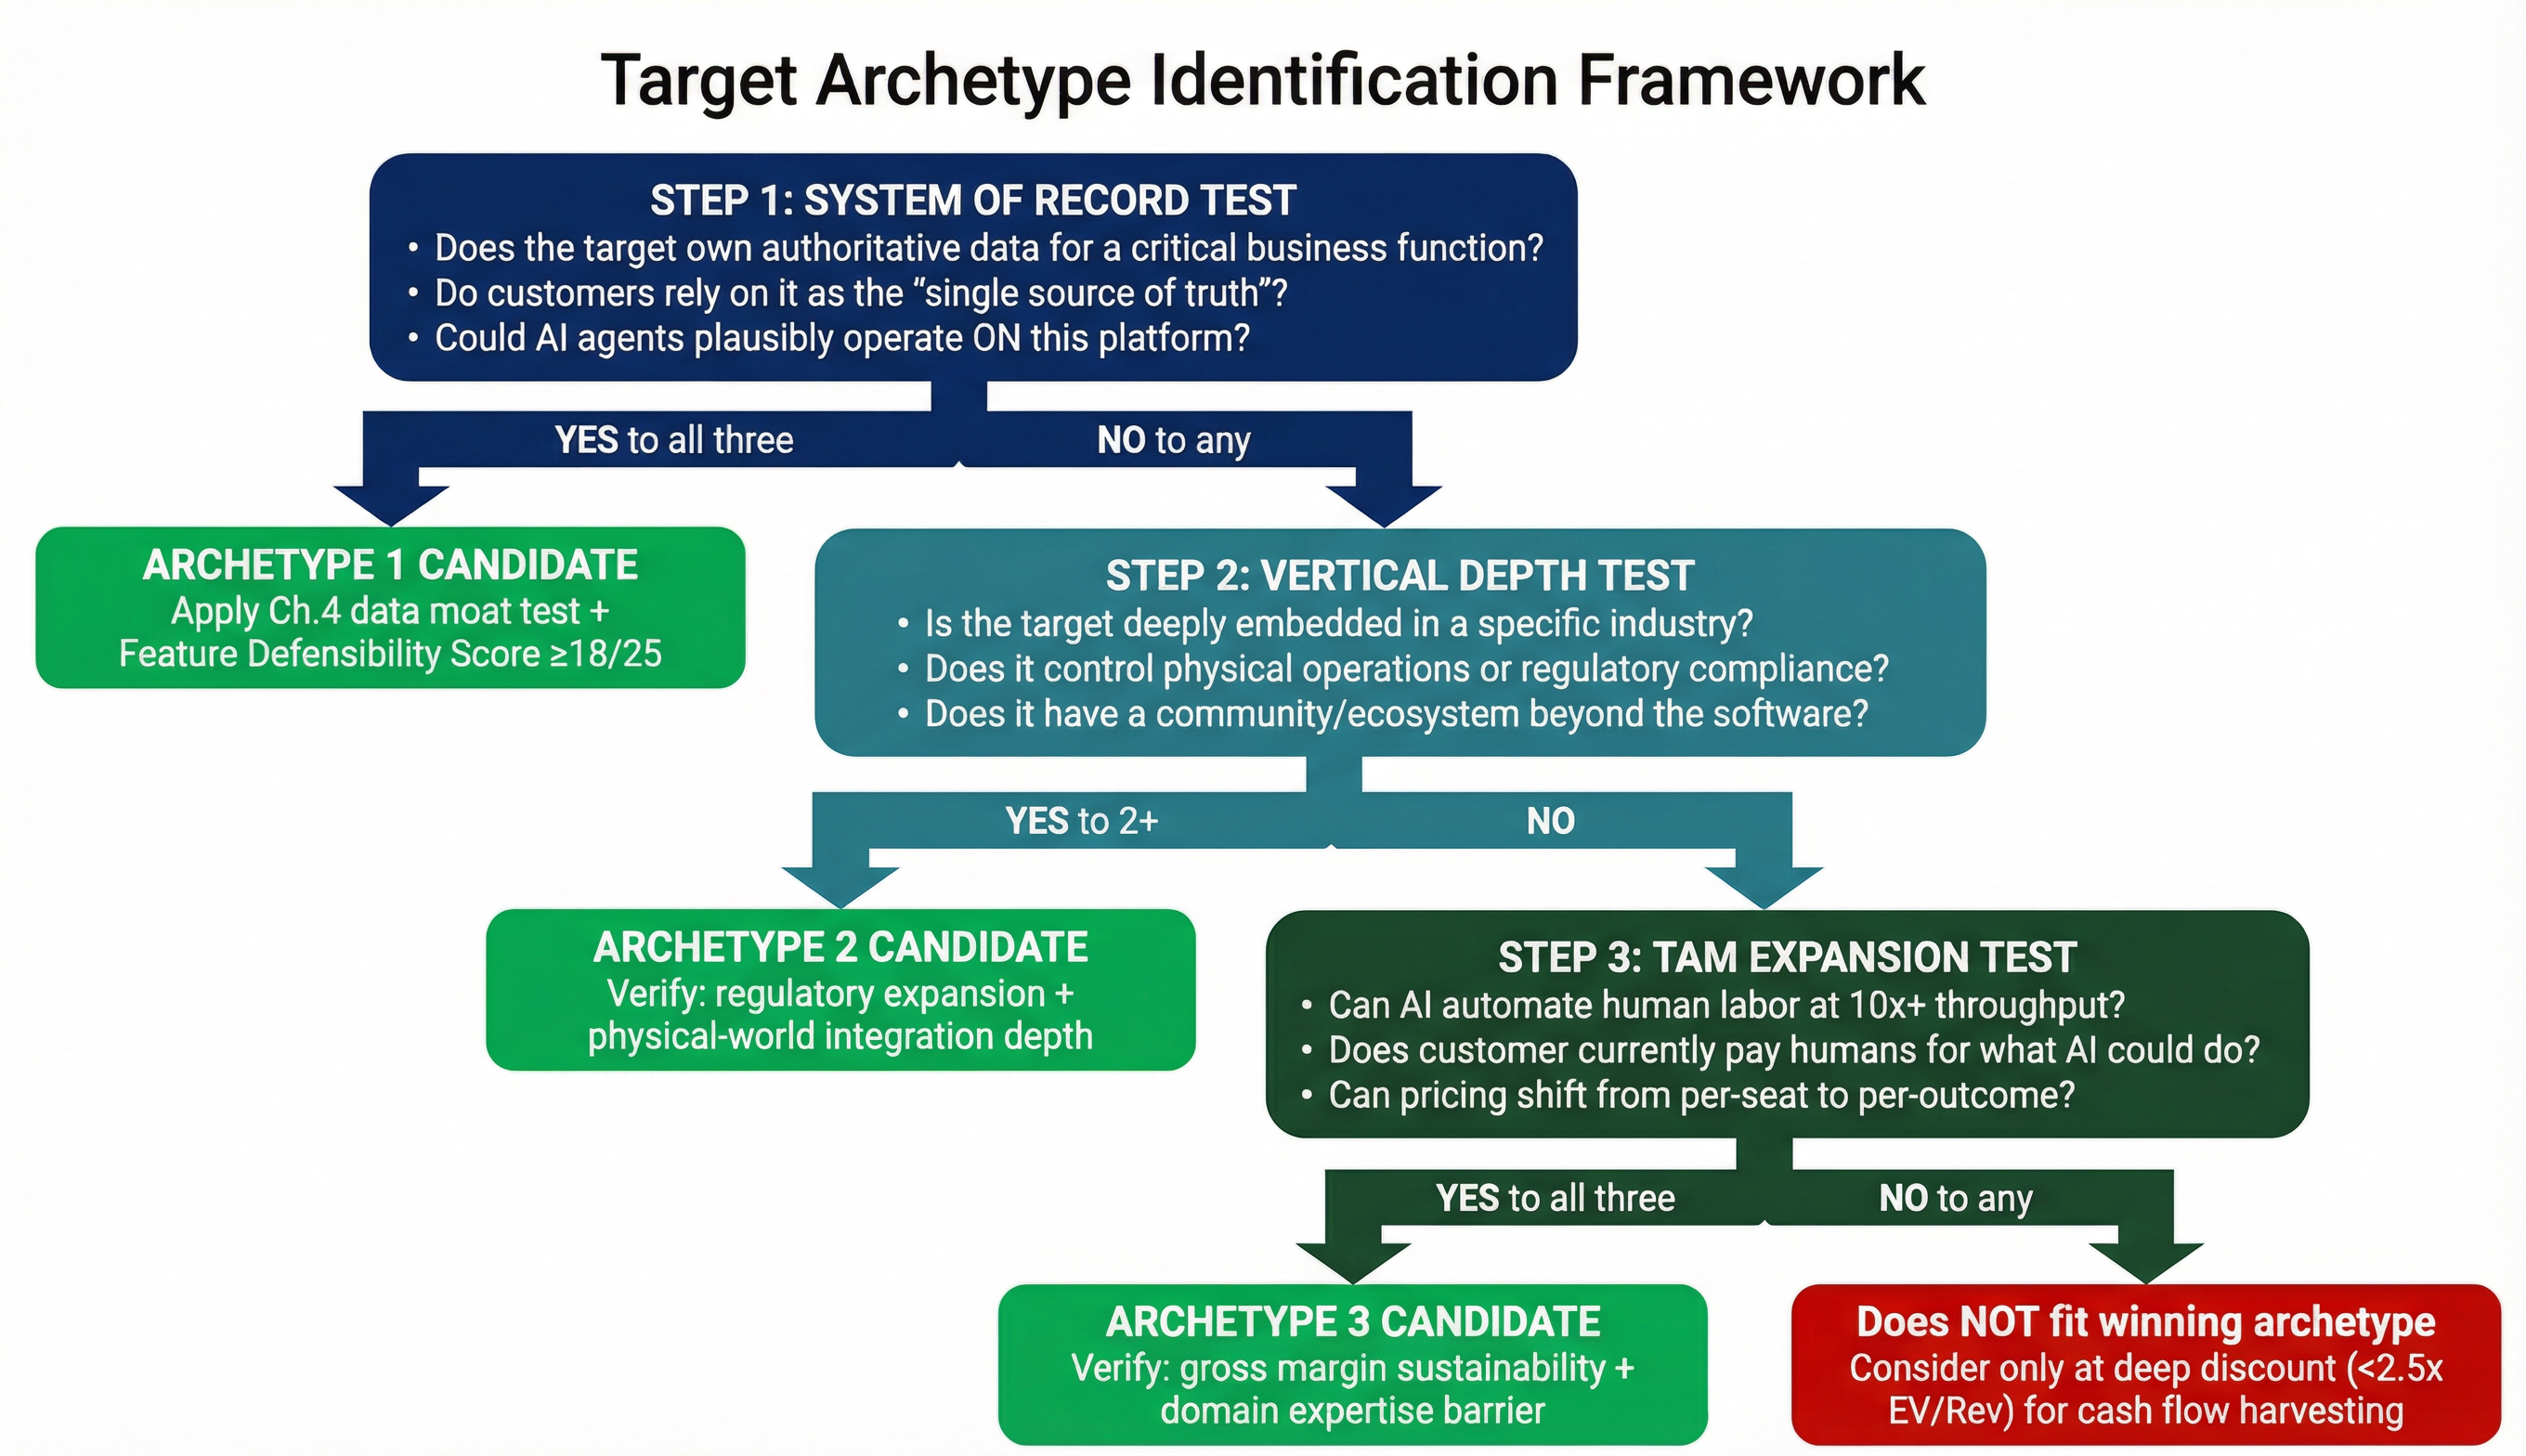
Note: Targets may qualify for multiple archetypes. If no archetype fits, consider only at deep-discount entry (<2.5x EV/Rev) for cash flow harvesting. Review Ch. 5 Stagnation scenario.
Note: Targets may qualify for multiple archetypes (e.g., a vertical platform that also controls system-of-record data and can capture labor TAM). In such cases, the primary classification determines the valuation framework; secondary archetype characteristics represent upside optionality.
Bridging to the Executive Summary: Immediate vs. Long-Term Actions
The Executive Summary framed this report around the central PE implication: blanket strategies will destroy value; precision is required. The three archetypes identified in this chapter translate the Executive Summary's five-year playbook into concrete investment actions across time horizons:
| Time Horizon | Primary Action | Archetype Focus | Chapter Cross-Reference |
|---|---|---|---|
| Immediate (0–12 months) | Deploy capital into post-sell-off dislocations; acquire Archetype 1/2 platforms at 3.0–5.5x | Archetypes 1 & 2 | Ch. 5 (entry valuations), Ch. 6 Phase 1 (diligence) |
| Mid-term (1–3 years) | Execute AI integration operating playbook; build vertical AI engines in portfolio companies | Archetype 2 (deepening moats) | Ch. 6 Phase 2 (post-acquisition), Ch. 4 (moat mechanisms) |
| Long-term (3–5 years) | Reposition portfolio for TAM expansion exits; target cross-sector strategic acquirers | Archetype 3 (labor TAM capture) | Ch. 5 (exit scenarios), Ch. 6 Phase 3 (pre-exit) |
This sequencing reflects the Executive Summary's core message: the current dislocation creates a generational buying opportunity, but only for investors who combine segmented diligence (Chapters 3–4), scenario-calibrated entry pricing (Chapter 5), and an AI-era operating playbook (Chapter 6) — while avoiding the traps documented in Chapter 7.
Chapter Synthesis: SaaS Is Being Reorganized, Not Destroyed
This chapter has presented the optimistic counterweight to the disruption narrative — not through wishful thinking but through specific, evidence-based archetypes grounded in the same analytical frameworks developed throughout this report.
The key conclusions for PE investors are:
-
Systems of record become AI hubs, not AI casualties. The Workday, Salesforce, SAP, and ServiceNow examples demonstrate that companies controlling authoritative enterprise data are positioning themselves as the platforms AI agents operate on. Agentforce and Data 360 ARR reaching nearly $1.4 billion, up 114% year-over-year, provides the most concrete revenue proof point in the industry. Mid-market targets with system-of-record characteristics in their verticals represent the PE corollary of this thesis — as exemplified by Vista portfolio companies like Avalara and Vena. However, the Workday CEO transition and Salesforce's 28% stock decline in 2026 underscore that even the strongest positions carry execution risk and valuation volatility during the AI transition.
-
Deeply embedded vertical platforms see their moats deepen through AI. The Constellation Software model — acquiring "boring," hyper-specific, deeply integrated vertical SaaS companies — is strengthened, not threatened, by AI. Vertical AI engines, regulatory tailwinds, community-driven lock-in, and physical-world integration all compound in the AI era. Constellation's increasing acquisition spend signals that the world's most disciplined software acquirer agrees. Vista's Duck Creek and Jaggaer provide mid-market proof points.
-
AI-enhanced software that captures labor TAM represents the highest-upside opportunity. McKinsey's finding that the AI+SaaS TAM has expanded beyond IT budgets to include labor represents a paradigm shift in addressable market sizing. Companies that can price against labor costs rather than software budgets can achieve revenue trajectories that traditional SaaS growth rates cannot match — but gross margin sustainability must be underwritten carefully.
-
Buy-and-build strategies must evolve. Platform selection is now primarily a defensibility decision. Add-on acquisitions should prioritize proprietary data assets over feature sets. Vertical SaaS with embedded finance commands premium multiples. Cross-sector strategic buyers are an increasingly important exit route. The gap between the best and the rest will be wider than it has been in over a decade. Selectivity, operational capability, and disciplined capital deployment will be the differentiators that matter.
-
The current dislocation is a buying opportunity — for the right assets, with clear-eyed risk management. Post-sell-off multiples of 3.0–5.5x for companies matching Archetypes 1–3 represent the deepest discount to intrinsic value since the pre-pandemic era. The probability-weighted returns documented in Chapter 5 are compelling for targets that pass the diligence frameworks of Chapters 3–4 and the Archetype Identification Decision Tree introduced in this chapter.
The firms that invested in cloud SaaS during the skepticism of 2008–2012 captured a generational return. The AI-era equivalent of that opportunity exists today — but only for investors who can distinguish the three winning archetypes from the structurally exposed categories that the market is correctly repricing downward.
The next chapter — "Implications for the Next SaaS Cycle: Reshaping the PE Investment Thesis for 2030" — synthesizes the entire report into forward-looking implications for how PE funds should restructure their SaaS investment approach. It will articulate the five key thesis shifts, provide the ten new investment committee questions that reflect AI-era thinking, and paint a specific picture of what "good SaaS" looks like in 2030. Where this chapter has shown where to lean in, Chapter 9 will provide the strategic framework for how PE firms should restructure their entire SaaS investment practice to capitalize on the reorganization documented across these eight chapters.
Sources and Verification Notes (as of February 17, 2026):
All financial metrics in this chapter have been verified against the most recent official filings available:
- Salesforce: Q3 FY2026 earnings (December 3, 2025); Q4 FY2026 results scheduled for February 25, 2026.
- ServiceNow: Q4 FY2025 earnings (January 29, 2026); official investor relations filing confirmed.
- SAP: Q4 2025 AI release highlights (January 2026); Joule Studio agent builder GA confirmed Q1 2026.
- Workday: Most recent earnings Q3 FY2026; CEO transition announced February 9, 2026; FY2026 guidance reaffirmed.
- Market sizing: CAGR range (12.0%–18.7%) reflects methodological differences across Grand View Research, Fortune Business Insights, and Statista; midpoint ~15.65% used for planning.
- Vista Equity portfolio examples: Sourced from Bain & Company Global PE Report 2025 and Vista Equity 2025 Hackathon announcements.
Chapter 9: Implications for the Next SaaS Cycle: Reshaping the PE Investment Thesis for 2030
The preceding eight chapters have constructed a comprehensive analytical framework for understanding how generative AI is structurally reshaping SaaS economics, competitive dynamics, and valuations. Chapter 1 documented the $2 trillion cumulative market-cap wipeout and the historically wide valuation dispersion across subsectors. Chapter 2 provided a line-item P&L analysis showing divergent economic futures for AI-enhanced systems of record versus AI-native feature tools. Chapter 3 presented the five-category risk spectrum — the report's central analytical framework — segmenting SaaS from "Fortress" to "Structurally Exposed." Chapter 4 identified five defensibility mechanisms and drew the critical contrast between AI wrappers and structurally defensible software. Chapter 5 modeled four valuation scenarios with specific, quantified multiple ranges by category through 2031. Chapter 6 translated these frameworks into a concrete lifecycle-structured operating playbook. Chapter 7 identified the most common value-destroying traps and how to avoid them. Chapter 8 demonstrated where SaaS not only survives but is structurally strengthened by AI.
This concluding chapter synthesizes it all into the strategic "so what" that investment committee members take away. It answers three questions: How must PE SaaS theses change? What must ICs ask differently? And what does "good SaaS" look like at the end of this cycle?
Section 1: How This Reshapes PE SaaS Theses
The AI disruption documented in this report demands five fundamental shifts in how PE funds construct, evaluate, and execute SaaS investment theses. These are not incremental adjustments — they are structural reframes that redefine what constitutes an attractive SaaS asset, how to underwrite it, and how to create value during ownership.
Thesis Shift 1: FROM "SaaS = Recurring Revenue = Safe" TO "SaaS = Only as Safe as Its AI-Era Moat"
For the better part of a decade, recurring revenue was the magnetic north of PE software investing. SaaS software plays have long looked like an excellent investment, with everything private equity could ask for: recurring revenue, high margins, scalable growth, and stickiness. The logic was seductive: a contract that renews annually, with 90%+ gross retention, creates a cash-flow profile that supports leverage, de-risks the hold period, and provides valuation visibility at exit.
That logic is no longer sufficient. Public markets are now repricing software companies at speed, as generative AI collapses development timelines, compresses switching costs, democratizes access to information, and turns once-durable features into commodities. And this volatility flows directly into private equity underwriting, leverage assumptions, and portfolio risk. The February 2026 sell-off, documented in Chapter 1, erased over $800 billion in market capitalization in a single week — much of it from companies with strong recurring revenue metrics. The sell-off targeted companies whose moats were perceived as feature-based and therefore vulnerable to AI replication, regardless of their NRR or ARR growth rates.
Where once a SaaS company's recurring revenue multiple was the primary valuation driver, investors are now placing equal weight on the defensibility of the company's data assets, the proprietary nature of its AI capabilities, and the depth of its integration into customer workflows. The era of paying premium multiples for any SaaS business with strong net revenue retention is over; selectivity has become the watchword.
The practical implication for PE funds is unambiguous: recurring revenue is necessary but not sufficient. Defensibility — as assessed through Chapter 4's five-mechanism framework (proprietary data, deep integration, regulatory lock-in, security/trust, ecosystem switching costs) — must be independently validated for every SaaS target. A company with 115% NRR and a Category 1 (Generic Horizontal) classification from Chapter 3 is a value trap; a company with 105% NRR and a Category 5 (Mission-Critical) classification may be a generational buying opportunity at current trough multiples.
Thesis Shift 2: FROM "Growth Above All" TO "Defensibility First, Growth Second"
The 2021 era rewarded growth at any cost. Companies trading at 20x+ revenue were prized for topline acceleration; profitability was an afterthought. That era is definitively over. As Chapter 1 documented, median public SaaS revenue growth fell to 12.2% by Q4 2025, the lowest on record, while the market increasingly rewards profitability and capital efficiency.
The Rule of 40 has become a cornerstone metric for SaaS finance teams because it directly correlates with company valuation. Rule of 40 valuation impact is significant — companies consistently achieving or exceeding the 40% threshold typically command 10.7x revenue multiples. However, as Chapter 2 documented, Vista Equity Partners predicts AI could push the Rule of 40 toward a Rule of 50 or even 70 for the best-performing companies — not through growth alone, but through AI-driven operating leverage that simultaneously improves margins and sustains growth rates.
The Rule of 40 is not a perfect metric, but it remains a useful lens on SaaS company performance. Growth continues to be the dominant driver, though profitability trends are shifting as equity-backed companies reduce burn. The AI era amplifies this shift: defensible SaaS companies that can demonstrate 15–25% growth with 25–35% EBITDA margins — a Rule of 40+ score built on durable foundations — will command premiums that accelerating-but-exposed companies cannot match.
For PE, this means the screening framework must invert the traditional hierarchy. The first filter is no longer "Is this company growing 25%+?" It is: "Is this company's growth defensible in an AI-disrupted market?" Only after answering yes to the defensibility question should growth acceleration become the primary operating priority. Chapter 5's Polarization scenario — the base case at 45–55% probability — projects that the spread between top-quartile (12–18x revenue) and bottom-quartile (0.8–2.0x revenue) SaaS multiples will widen to the largest in the sector's history by 2031. In that environment, buying growth in a defensible category at 5x entry is far superior to buying faster growth in an exposed category at 7x entry.
Thesis Shift 3: FROM "Feature Differentiation" TO "Data + Integration + Regulatory Moat"
Chapter 7 documented this shift in detail as the first and most consequential trap: overpaying for feature-based differentiation that AI can replicate in days. The evidence is now conclusive. As the Chapter 7 analysis showed, the February 2026 sell-off specifically targeted companies whose competitive advantage was perceived as algorithmic or feature-based. Thomson Reuters plunged 16% and London Stock Exchange Group fell 13% on the day Anthropic demonstrated that general-purpose AI could replicate the analytical and document-processing capabilities these companies sold as premium products.
The enduring sources of value, as Chapter 4 established, are: (a) proprietary, customer-generated data that creates compounding flywheels; (b) deep process integration at Level 3–4 (workflow control and system-of-consequence status); and (c) regulatory and compliance-driven lock-in where the software is the legally mandated system of truth. The Chapter 7 Feature Defensibility scoring framework operationalizes this shift: targets scoring below 10 out of 25 on that framework should not be priced above category median, regardless of their current feature sophistication.
For deal teams, this means every investment memo must demonstrate which of the three enduring value sources the target possesses — with evidence, not assertion. "Proprietary algorithm" is no longer a defensible moat claim. "System of record controlling $50 billion in annual construction project financial flows, generating legally mandated audit trails across 10,000 active projects" is.
Thesis Shift 4: FROM "Seat-Based Pricing = Predictable Revenue" TO "Pricing Model = Strategic Risk Factor"
Per-seat pricing was the foundation of SaaS economics for two decades. It created the predictability that PE investors prized: multiply seats by price per seat to get ARR; model expansion as new hires at the customer create new seats. That model is under structural assault.
This evolution should disrupt traditional pricing models. Subscriptions and seat-based licensing could give way to hybrid approaches that blend usage- and outcome-based pricing. Gartner says that "by 2030, at least 40% of enterprise SaaS spend will shift toward usage-, agent-, or outcome-based pricing." There will likely be a lot of effort needed to shift to these newer models, and we expect to see pricing variety and experimentation in 2026 and beyond. It could take years for standard practices to emerge, if they ever do.
As Chapter 6 documented, the transition is already underway: 61% of SaaS companies now employ some form of hybrid pricing (up from 49% in 2024), usage-based pricing appears in 43% of SaaS pricing models, and credit-based models have surged 126% year-over-year. "Per-seat" pricing will become obsolete for AI-heavy tools. Since one user with an AI agent can do the work of ten, pricing will shift entirely to "work units" performed.
The PE implication is that any portfolio company generating 100% of revenue from per-seat pricing is carrying significant unpriced risk. As Chapter 6's playbook detailed, the three-stage pricing migration (AI add-on SKUs → hybrid pilot → full migration) provides a structured transition path — but it must begin immediately. The stress-test requirement from Chapter 6's diligence protocol — modeling revenue under 15%, 30%, and 50% seat-reduction scenarios — should be mandatory for every SaaS deal memo. If the target cannot demonstrate a credible pricing migration path, the entry multiple must be discounted accordingly.
Thesis Shift 5: FROM "Buy, Optimize, Exit" TO "Buy, AI-Transform, Reposition, Exit"
The traditional PE SaaS playbook — acquire recurring revenue, optimize the cost structure, improve margins, exit at a healthy multiple — has been the dominant value creation model since 2015. It worked because the macro environment rewarded it: SaaS multiples expanded, growth was abundant, and the primary competitive risk was other SaaS vendors.
The next wave of value creation won't come from financial engineering alone — it will come from strategic AI adoption across the deal lifecycle. Chapter 6 introduced AI as a "third pillar of value enhancement" alongside financial engineering and operational excellence. The data supports this framing: Chapter 6 documented that Vista Equity Partners — the most scaled PE-owned software operator in the world — has created an "Agentic AI Factory" to deploy AI across its 90+ portfolio companies, with 30 already generating revenue from AI transformation and another 30–40 in the pipeline. Vista reports productivity gains of 30–50% in code writing and $10 in savings for every $0.20 of inference cost.
The practical implication is that every PE SaaS acquisition must now include an AI transformation component in the value creation plan. Chapter 6's 100-day sprint provides the execution framework: AI capability assessment (Days 1–15), roadmap development (Days 15–30), foundation deployment (Days 30–60), scaling and measurement (Days 60–90), and board review with recalibration (Days 90–100). The target outcome — 500–1,000 basis points of EBITDA margin improvement within 24 months, with 30–50% of savings reinvested in AI-powered product enhancements — represents the new standard for value creation.
Any investment thesis that relies solely on traditional operational improvement (cost-cutting, sales efficiency, pricing optimization) without an AI transformation component is underwriting a hold-period plan that the market will not reward at exit. As Chapter 5 demonstrated, the exit premium in 2028–2031 will accrue to companies that demonstrate AI-driven NRR expansion, AI-powered margin improvement, and defensible AI capabilities — not simply to companies that have been optimized along traditional levers.
Section 2: What ICs Should Ask Differently
The five thesis shifts above demand a corresponding evolution in the questions investment committees ask when evaluating SaaS opportunities. The following ten questions replace or supplement the traditional IC framework. Each question maps directly to the analytical frameworks developed in preceding chapters and is designed to surface the specific AI-era risks and opportunities that conventional diligence misses.
The Ten AI-Era Investment Committee Questions
Question 1: "What happens to this company's revenue if customers reduce seat count by 30%?"
Why it matters: As Chapter 1 documented, the "seat compression" fear is the most structurally significant of the three investor fears driving the SaaS repricing. AI agents replace human users; fewer humans means fewer seats. This question forces the deal team to model the specific revenue impact and assess whether the target's pricing migration plan (Chapter 6) can compensate. Framework reference: Chapter 6, Section 1c (Pricing Model Resilience); Chapter 5, Scenario 1 (Commoditization) and Scenario 3 (Polarization).
Question 2: "Does this company own data that AI agents need to function?"
Why it matters: Chapter 8's Archetype 1 (System of Record → AI Hub) demonstrated that the most powerful defensive position in the AI era is owning the data that AI agents need to operate. If a company's data is the authoritative source for customer history, financial records, compliance documentation, or operational workflows, AI adoption makes the company more valuable, not less. Framework reference: Chapter 4, Mechanism 1 (Proprietary Data); Chapter 8, Archetype 1.
Question 3: "If the AI features were removed, would customers still need this product?"
Why it matters: This is the "wrapper test" from Chapter 4's critical contrast section — the single most powerful diagnostic for distinguishing structurally defensible software from AI wrappers. If the answer is "yes," the AI is enhancing an existing moat. If "no," the company is a wrapper with no intrinsic defensibility. Framework reference: Chapter 4, Wrapper Test; Chapter 7, Feature Defensibility Scoring.
Question 4: "What is the pricing model risk — how much revenue depends on per-seat pricing?"
Why it matters: As Thesis Shift 4 documents, per-seat pricing is the single greatest structural vulnerability. Traditional user-based SaaS pricing may plateau and gradually decline as organizations explore new ways to maximize software investment. Gartner predicts that by 2030, at least 40 percent of enterprise SaaS spend will shift toward usage-, agent- or outcome-based pricing. If >80% of revenue is per-seat with no migration plan, price the risk into the entry multiple. Framework reference: Chapter 6, Section 1c; Chapter 2, Section 5 (Pricing Model Signal).
Question 5: "Who are the AI-native competitors, not just the traditional SaaS competitors?"
Why it matters: Chapter 3 documented that both OpenAI and Anthropic launched HIPAA-compliant life sciences tools in January 2026 that directly compete with established healthcare SaaS vendors. The competitive threat landscape now includes foundation model companies entering verticals, customer build-vs-buy risk, and platform subsumption risk. The 360-degree threat map from Chapter 6 captures all four vectors. Framework reference: Chapter 3 (Vertical AI Threat); Chapter 6, Section 1e (Competitive Threat Mapping).
Question 6: "What is the company's AI readiness maturity score?"
Why it matters: Chapter 7 identified treating AI readiness as a checkbox as a common trap. AI maturity must be assessed across five dimensions: strategy, data readiness, infrastructure, talent, and governance. A company scoring 5 on data readiness and 1 on governance is fundamentally different from one scoring 3 across the board — yet both might be described as "having AI capability" in superficial diligence. The maturity score directly informs the hold-period operating plan from Chapter 6 and the investment timeline. Framework reference: Chapter 6, Section 2a (Product Roadmap); Chapter 7, Stop Treating AI Readiness as a Checkbox.
Question 7: "Can the target become a platform for AI agents, or will agents bypass it?"
Why it matters: This question directly addresses the binary outcome that determines whether a SaaS company benefits from AI adoption or is disrupted by it. Workday's Agent System of Record strategy, Salesforce's Agentforce platform, and SAP's Joule Agents — all documented in Chapter 8 — exemplify companies that become the platform agents operate on. Conversely, lightweight tools whose functionality agents can replicate or bypass are in the "Exposed" quadrant of the 2×2 matrix from the Executive Summary. Framework reference: Chapter 8, Archetype 1; Chapter 3, Category 5 (Mission-Critical Systems).
Question 8: "What regulatory tailwinds protect this company?"
Why it matters: Chapter 4 (Mechanism 3: Regulatory Lock-In) and Chapter 5 (Scenario 4: Fortress) demonstrate that regulatory complexity is the one variable that increases regardless of which AI macro scenario materializes. The EU AI Act, evolving HIPAA requirements, financial services AI oversight, and sector-specific compliance mandates all create demand for software that serves as the compliant system of truth. Only 22% of enterprises in 2025 prioritized AI governance policy — the gap between regulatory requirement and enterprise readiness is a massive opportunity for software that fills it. Framework reference: Chapter 4, Mechanism 3; Chapter 5, Scenario 4 (Regulated/Mission-Critical Resilience).
Question 9: "What does the exit buyer landscape look like in 3–5 years?"
Why it matters: Chapter 5 demonstrated that exit dynamics are bifurcating: premium strategic sales and selective IPO access for winners (Categories 4, 5, and upper-tier 3b), versus distressed sales and acqui-hires for losers (Categories 1 and 3a). Cross-sector strategic buyers — incumbents in payments, healthcare, and industrials acquiring SaaS+AI — are an increasingly important exit route, as Chapter 8's buy-and-build section documented. The IC must evaluate not just whether the company is investable today but whether a credible buyer exists at a premium multiple 3–5 years from now. Framework reference: Chapter 5, Exit Market Dynamics by scenario; Chapter 8, Buy-and-Build Implications.
Question 10: "How would this company's value change under each of our four scenarios?"
Why it matters: Chapter 5 presented four scenarios — Commoditization, Augmentation, Polarization (base case), and Fortress — each with specific, quantified valuation implications by SaaS category. The scenario stress-test framework from Chapter 5 (classify the asset → apply scenario-specific multiples → model the revenue bridge → calculate probability-weighted returns → identify the "kill scenario") should be mandatory for every deal. The illustrative example in Chapter 5 showed a deep vertical SaaS target with a probability-weighted 2.8x MOIC and limited downside (1.1x) in the bear case — the kind of risk-adjusted return profile that the current dislocation makes available for correctly classified assets. Framework reference: Chapter 5, full scenario framework; Chapter 5, PE Portfolio Implications section.
The IC Questions Decision Matrix
| Question | What the Answer Reveals | Red Flag Response | Green Flag Response | Chapter Reference |
|---|---|---|---|---|
| 1. 30% seat reduction impact? | Pricing model vulnerability | Revenue declines >25% with no offset | Revenue flat or grows via hybrid pricing | Ch. 5, 6 |
| 2. Owns data agents need? | AI positioning (hub vs. bypassed) | Generic data, publicly replicable | Customer-generated, compounding flywheel | Ch. 4, 8 |
| 3. Valuable without AI features? | Wrapper vs. defensible | No — AI is the entire value proposition | Yes — AI enhances existing moat | Ch. 4, 7 |
| 4. Pricing model risk? | Revenue model sustainability | >80% per-seat, no migration plan | <50% per-seat, hybrid model in market | Ch. 2, 6 |
| 5. AI-native competitors? | Competitive threat breadth | Foundation model companies entering vertical | No direct AI-native threat; high entry barriers | Ch. 3, 6 |
| 6. AI maturity score? | Transformation readiness | <2 average across five dimensions | >3 average; strong data readiness | Ch. 6, 7 |
| 7. Platform for agents? | Strategic positioning | Agents bypass the product entirely | Product becomes agent operating surface | Ch. 3, 8 |
| 8. Regulatory tailwinds? | Compliance moat | Unregulated; no compliance requirements | Legally mandated system of truth | Ch. 4, 5 |
| 9. Exit buyer landscape? | Exit route viability | No credible strategic buyer; IPO unlikely | Multiple strategic buyers + sponsor demand | Ch. 5, 8 |
| 10. Performance under four scenarios? | Risk-adjusted return | Kill scenario probability >20% with >30% loss | Positive returns across all four scenarios | Ch. 5 |
Investment committees should require completed answers to all ten questions in every SaaS deal memo. Any deal where three or more questions receive "Red Flag" responses should be declined or repriced downward to compensate for the risk. Conversely, deals receiving eight or more "Green Flag" responses at current trough multiples represent the highest-conviction opportunities in the market.
Section 3: What "Good SaaS" Looks Like in 2030
The analytical frameworks developed across this report converge on a specific picture of the ideal PE SaaS investment at the end of this cycle. This is not aspirational — it is derived directly from the risk spectrum (Chapter 3), moat analysis (Chapter 4), valuation scenarios (Chapter 5), operating playbook (Chapter 6), and winning archetypes (Chapter 8). A premium SaaS company in 2030 exhibits the following eight characteristics:
Characteristic 1: It Owns the System of Record for a Specific Vertical or Function
AI agents are useless without access to the customer history, inventory logs, codebases, and compliance records that sit within existing systems of record. The SaaS company that owns this data does not fear AI agents — it becomes the platform they operate on. As Chapter 8 documented, Salesforce's Agentforce and Data 360 ARR reached nearly $1.4 billion (up 114% year-over-year), Workday launched its Agent System of Record, and SAP introduced 14 new Joule Agents across enterprise functions. The premium SaaS company in 2030 has followed this trajectory: its system-of-record data is the substrate upon which AI agents in its vertical operate, generating agent-access fees, orchestration revenue, and premium AI tier subscriptions.
Characteristic 2: It Generates Proprietary Data That AI Agents Need
Not generic data that exists across the public internet, but domain-specific, customer-generated data that creates a self-reinforcing flywheel — the only durable data moat documented in Chapter 4. Healthcare treatment outcomes, construction project performance histories, financial transaction patterns, manufacturing sensor readings, legal precedent databases within specific jurisdictions — these are the data assets that remain defensible because they are generated through customer usage of the product and cannot be replicated by a foundation model trained on publicly available data. The premium 2030 SaaS company's proprietary data makes its vertical AI engine demonstrably more accurate than any general-purpose alternative, creating a compounding advantage that widens with each customer interaction.
Characteristic 3: It Has Migrated to Hybrid Pricing
There are a couple of pricing models that are expected to gain in popularity: usage-based and outcome- or value-based. Gartner says that "by 2030, at least 40% of enterprise SaaS spend will shift toward usage-, agent-, or outcome-based pricing." In usage-based models, a customer could be charged every time an agent takes an action or completes a task. The premium 2030 SaaS company has completed the three-stage pricing migration from Chapter 6: approximately 60% base subscription (providing predictable ARR that supports valuation and leverage) plus 40% usage/outcome-based AI components (capturing upside as AI agents perform increasing volumes of work on the platform). This hybrid model delivers the predictability that PE investors require while capturing the value expansion that AI-driven throughput enables.
Characteristic 4: Its Gross Margins Are 65–75%
Lower than legacy SaaS's 80–85% because of AI inference costs (the new cost-of-goods-sold reality documented in Chapter 2), but offset by operating leverage from AI automation across support, development, sales, and G&A. The premium 2030 SaaS company's P&L resembles Chapter 2's Archetype A (AI-Enhanced System of Record): 72–78% gross margins, 28–35% EBITDA margins, and a Rule of 40 score of 50–65. The compute cost drag is real but manageable because the company has optimized inference through model distillation, caching, and selective deployment — ensuring that AI compute costs scale sub-linearly with usage.
Characteristic 5: It Has NRR Above 120% Driven by AI-Powered Upselling
Net revenue retention has always been the single most important SaaS metric for PE investors. Top-quartile SaaS companies achieve 115–125% net revenue retention, growing 2.5x faster than low-NRR counterparts. In 2030, the premium SaaS company achieves 120%+ NRR through three AI-driven expansion mechanisms: (a) AI feature add-ons that customers adopt and expand (the Adobe model from Chapter 8: $125M in Q1 2025 AI revenue, expected to double by year-end); (b) usage-based AI pricing that scales with customer activity (more AI agents running, more tasks automated, more compute consumed); and (c) AI-powered customer success that identifies expansion opportunities, reduces churn, and automates renewal optimization.
Characteristic 6: It Operates in a Regulated Environment That Creates Switching Costs
Chapter 5's analysis showed that the "compliance premium" persists across all four valuation scenarios — making regulatory moats the most consistently valuable defensive position in any market environment. The premium 2030 SaaS company operates in healthcare, financial services, construction safety, environmental compliance, legal practice management, or another regulated vertical where the software generates legally mandated audit trails, manages regulatory filings, or serves as the certified system of record. AI governance requirements (EU AI Act compliance, HIPAA AI provisions, SEC AI oversight) have expanded the regulatory surface area, creating incremental, high-margin functionality that deepens customer lock-in.
Characteristic 7: Its Competitive Position Has Strengthened Because of AI, Not Despite It
This is the defining characteristic that separates the premium 2030 SaaS company from the merely surviving one. AI has not weakened this company's competitive position — it has strengthened it along three dimensions: (a) the company's vertical AI engine, trained on proprietary customer-generated data, outperforms general-purpose models on domain-specific tasks, creating a capability moat that widens with each customer interaction; (b) AI-driven automation has expanded the company's TAM from IT budgets to labor budgets (Chapter 8's Archetype 3), enabling pricing against human labor costs rather than competing software tools; and (c) AI-powered features have increased product stickiness, deepened workflow integration, and improved the customer experience — strengthening, not eroding, the switching costs that underpin the subscription model.
Characteristic 8: It Is Positioned for Premium Exit
The premium 2030 SaaS company is positioned for exit to one of three buyer types: (a) a strategic acquirer from an adjacent industry (payments, healthcare, industrials) that needs its data and vertical expertise — the cross-sector deal dynamic documented in Chapter 8; (b) a large-cap SaaS platform that wants to acquire its vertical position and AI-enhanced customer base as part of a "subsumption" strategy documented in Chapter 3; or (c) public markets, as a "new-era SaaS" company that demonstrates the AI-enhanced economics, hybrid pricing, and defensible moats that the post-2026 IPO window will reward. Under Chapter 5's Polarization base case, such a company trades at 8–15x revenue — a multiple that, combined with AI-driven revenue growth and margin expansion over the hold period, generates 2.5–4.0x MOIC for the PE investor who acquired it at 4–6x during the 2026 trough.
The "Good SaaS 2030" Scorecard
| Characteristic | Metric / Target | How to Build It During Ownership |
|---|---|---|
| System of record | >80% of customers use as primary data source for function | Deepen integration; expand data capture; launch agent access platform |
| Proprietary data flywheel | Data volume growing >20% YoY from customer usage | Instrument product for data capture; build vertical AI on proprietary data |
| Hybrid pricing | 55–65% base subscription / 35–45% usage/outcome | Execute Chapter 6 three-stage pricing migration |
| Gross margins | 65–75% (blended traditional + AI) | Optimize inference costs; selective AI deployment; model distillation |
| NRR | >120% | AI feature adoption; usage-based expansion; AI-powered customer success |
| Regulatory moat | Software is legally required or generates mandated artifacts | Invest in compliance features; pursue regulatory certifications; expand to adjacent jurisdictions |
| AI-strengthened position | Vertical AI engine outperforms general-purpose alternatives | Fine-tune models on proprietary data; build domain-specific evaluation benchmarks |
| Exit positioning | Multiple credible buyer types at premium multiples | Build AI narrative 18 months before exit; document NRR and margin attribution |
The following synthesis consolidates the key outputs of all mandatory tables, figures, and frameworks from the entire report into a single reference page suitable for investment committee presentation.
The IC Quick Reference consolidating all key outputs is provided at the end of this report.
Closing Provocation: The Cost of Standing Still
The biggest risk for PE in SaaS is not AI disruption. It is standing still while the landscape reorganizes.
It's being called the "SaaSpocalypse" — not the death of SaaS software, but the death of the assumptions that once made software feel inherently safer than everything else. The assumptions are dying. The software is not. The global SaaS market, as Chapter 8 documented, is projected to reach $800–900 billion by 2030 across multiple independent estimates, growing at 12–19% CAGR depending on methodology. The SaaS industry spent more than two decades building tools that enabled human work. Now in 2026, as an IT professional, it's clear the focus is shifting to software that autonomously performs the work. In coming years, AI will no longer be a bolt-on feature; it'll become the foundational logic driving SaaS innovation.
The reorganization is not hypothetical. It is already producing measurable results. Salesforce's Agentforce — launched barely a year ago — reached 18,500 customers and nearly $1.4 billion in ARR. Vista Equity's Agentic AI Factory is transforming 60+ portfolio companies. Constellation Software is increasing its vertical SaaS acquisition spend to $2.25 billion by 2029. Infrastructure and security software commands 6.2x revenue multiples while adtech languishes at 1.1x. The bifurcation is here, and it is accelerating.
For PE firms, this creates a specific opportunity with a specific window. For private equity, which operates on longer time horizons and with less liquidity, the adjustment is more painful. Firms that acquired SaaS companies at peak valuations in 2021 and 2022 now face the prospect of holding assets through a period of fundamental technological transition, with exit multiples potentially far below entry levels. But the same dislocation that pressures the 2021 vintage creates a generational entry point for the 2025–2027 vintage. Post-sell-off multiples of 3.5–5.5x for companies matching the three winning archetypes from Chapter 8 represent the deepest discount to intrinsic value since the pre-pandemic era.
The historical parallel is instructive. The firms that invested in cloud SaaS during the skepticism of 2008–2012 — when "cloud" was dismissed by many enterprise buyers and investors as immature, insecure, and unproven — captured a generational return. Salesforce traded below 4x revenue in 2008; it peaked above 15x in 2021, generating enormous wealth for early believers. ServiceNow's IPO in 2012 was priced at a modest premium; the stock has since appreciated over 50x.
The AI-era equivalent of that opportunity exists today. But it requires what the 2008–2012 cloud investors needed: the ability to distinguish signal from noise, segment risk from opportunity, and act with conviction on a thesis that the market has not yet fully priced.
The signal is clear: AI is bifurcating SaaS, not killing it. The risk is segmented: the frameworks in Chapters 3 and 4 identify with precision which companies are structurally advantaged and which are structurally exposed. The opportunity is quantified: Chapter 5's probability-weighted scenarios show compelling returns for correctly classified assets at current entry multiples. The playbook is actionable: Chapter 6 provides the specific operating interventions that create value during the hold period.
What remains is the conviction to act.
The coming 18 to 24 months will be critical in determining the ultimate impact of AI on private equity's SaaS portfolios. Companies that successfully integrate AI into their products and operations will likely emerge stronger, with enhanced competitive moats and improved unit economics. The PE firms that deploy capital into defensible SaaS assets during this dislocation — using the diligence frameworks of Chapters 3–4, the scenario models of Chapter 5, and the operating playbook of Chapter 6 — will capture the returns that the reorganization makes available.
The firms that wait for clarity will find that clarity arrives priced in.
This report has argued, across nine chapters, that the right question is not "Is AI killing SaaS?" It is "Which SaaS, and how fast?" For PE investors, the corollary question is even more specific: "Which SaaS, at what price, with what operating plan, and for what exit?" The frameworks, scenarios, scorecards, and playbooks presented in these pages provide the tools to answer that question with the precision the current market demands. The SaaS era is not ending. It is being rewritten. The investors who hold the pen will define the next cycle's returns.
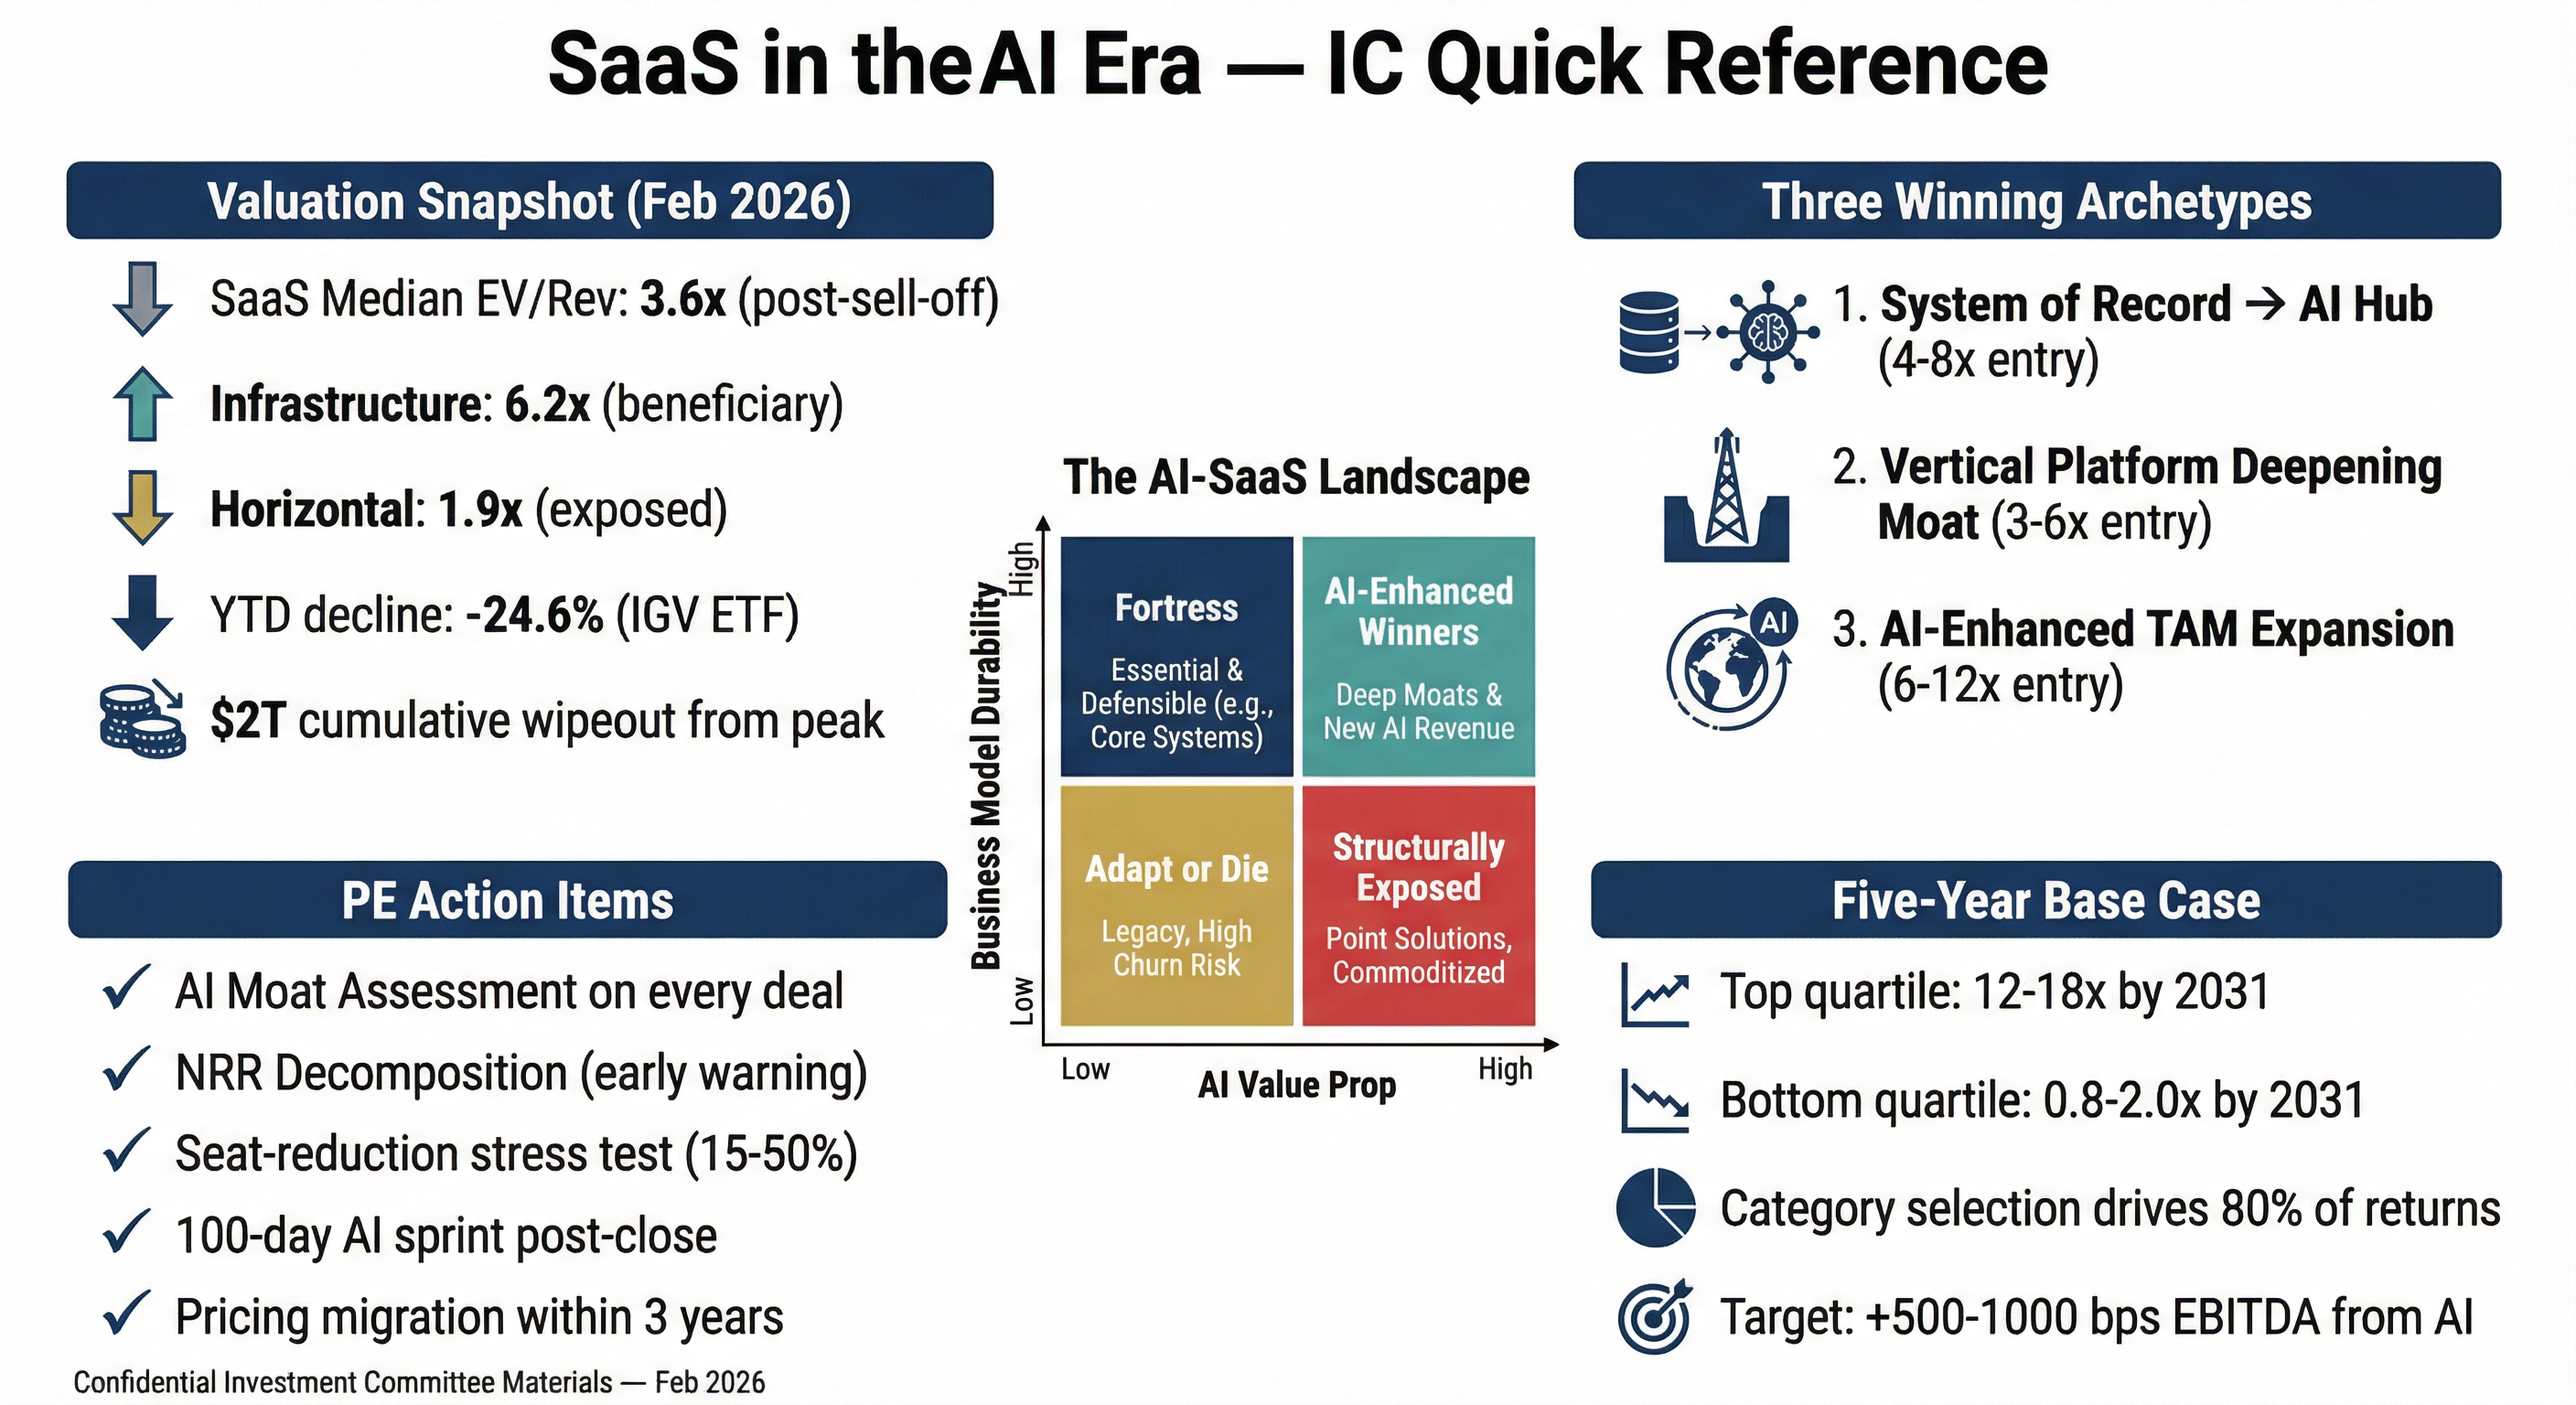
Appendix: Sources & References
All sources referenced across the report chapters are consolidated below.
Chapter 1
- The 2026 Software Stock Crash: Understanding the AI Disruption and Market Sell-off — deVere Group
- Software-mageddon: The $800 Billion Tech Selloff and the Death of the SaaS Model — FinancialContent
- Selloff wipes out nearly $1 trillion from software and services stocks — Yahoo Finance / Reuters
- Why that $2 trillion software wipeout didn't derail the AI bull market — Fortune / J.P. Morgan
- JPMorgan says the historic software selloff has gone far enough — CNBC
- Wall Street Says Software's AI Stock Market Wipeout Went Too Far — Bloomberg
- What to Know About the Software Stock Selloff — Morningstar
- Software sector sell-off: Which European companies are hit? — Euronews
- SaaS Multiples Benchmarking — Public SaaS Companies
- SaaS Valuation Multiples: 2015-2025 — Aventis Advisors
- EBITDA Multiples for SaaS and Software Companies (2025-2026) — Clearly Acquired
- Software Valuation Multiples - October 2025 — Multiples.vc
- 2025: The State of Generative AI in the Enterprise — Menlo Ventures
- Menlo Ventures' 2025 State of Generative AI Report — GlobeNewswire / Yahoo Finance
- Menlo Ventures estimates $19 billion in Gen AI spend during 2025 — No Jitter
- Four Predictions Private Equity 2026 — FTI Consulting
- AI and Private Equity in 2026: 6 Predictions Redefining Value Creation — CLA
- SaaS Valuations: How to Value a SaaS Business in 2026 — FE International
- AI and the SaaS industry in 2026 — BetterCloud
- Software As A Service (SaaS) Market Size to Surpass USD 1,367.68 Bn by 2035 — Precedence Research
- 175+ Unmissable SaaS Statistics for 2026 — Zylo
- VCs predict enterprises will spend more on AI in 2026 — through fewer vendors — TechCrunch
- 2026 Private Equity Industry Predictions — BDO
- Gartner Forecasts Worldwide IT Spending to Grow 10.8% in 2026 — Gartner
- Enterprise Software Spend Will Grow a Stunning 15.2% Next Year — SaaStr / Gartner
- Software Equity Group Reports Record SaaS M&A Volume & Steady Valuations in Q3 2025 — Software Equity Group
- Q3 2025 Enterprise SaaS M&A Review — PitchBook
- The February 2026 Selloff: Anatomy of a Multi-Trillion Dollar Wipeout — Michael Brenndoerfer
- US software stocks slammed on mounting fears over AI disruption, lose $1 trillion in week
- Stocks: Why that $2 trillion software wipeout didn’t derail the AI bull market | Fortune
- What to Know About the Software Stock Selloff | Morningstar
- Software sector sell-off: Which European companies are hit? | Euronews
- JPMorgan says the historic software selloff has gone far enough. 10 stocks to buy on sale
- The 2026 Software Stock Crash: Understanding the AI Disruption and Market Sell-off
- Wall Street Says Software’s AI Stock Market Wipeout Went Too Far - Bloomberg
- SaaS M&A Deal Volume and Valuations | Software Equity Group
- 2025: The State of Generative AI in the Enterprise | Menlo Ventures
- Menlo Ventures’ 2025 State of Generative AI Report: Enterprise Investment Hit $37B in 2025, Tripling in One Year
- Software Equity Group Reports Record SaaS M&A Volume & Steady Valuations in Q3 2025
- Software As A Service (SaaS) Market Size to Surpass USD 1,367.68 Bn by 2035
- Gartner: Enterprise Software Spend Will Grow a Stunning 15.2% Next Year. But Most Of That Will Go to Price Increases and AI Apps | SaaStr
- Gartner Forecasts Worldwide IT Spending to Grow 10.8% in 2026, Totaling $6.15T - AIwire
Chapter 1
- Aventis Advisors — SaaS Valuation Multiples: 2015–2025
- Aventis Advisors — Software Valuation Multiples: 2015–2025
- SaaS Capital — 2025 Private SaaS Company Valuations
- Multiples.vc — Software Valuation Multiples – October 2025
- Clearly Acquired — EBITDA Multiples for SaaS and Software Companies (2025–2026)
- Software Equity Group — SEG 2026 Annual SaaS Report and Q3 2025 Quarterly Report
- AGC Partners — SaaS Underperformance Drags Down Tech M&A in Early 2025
- Eqvista — SaaS Index: Revenue Multiples, Valuations & Market Trends
- Fortune — Why that $2 trillion software wipeout didn't derail the AI bull market (Feb 10, 2026)
- Fortune — The tech stock free fall doesn't make any sense, BofA says (Feb 4, 2026)
- Fortune — 3 factors that will separate the 'SaaSpocalypse' winners from losers (Feb 12, 2026)
- Fortune — AI agents aren't eating SaaS—they're using it (Feb 10, 2026)
- FinancialContent / MarketMinute — Software-mageddon: The $800 Billion Tech Selloff (Feb 16, 2026)
- FinancialContent / MarketMinute — SaaSpocalypse 2026: Why Wall Street is Slashing Software Valuations (Feb 11, 2026)
- Bloomberg — What's Behind the 'SaaSpocalypse' Plunge in Software Stocks (Feb 4, 2026)
- Bloomberg — Wall Street Says Software's AI Wipeout Went Too Far (Feb 11, 2026)
- Morningstar — What to Know About the Software Stock Selloff (Feb 2026)
- Morningstar UK — Software Stocks: Are Investors Worrying Too Much About AI Disruption? (Feb 2026)
- CNBC — Software experiencing 'most exciting moment' as AI fears hammer stocks (Feb 4, 2026)
- CNBC — AI fears pummel software stocks (Feb 6, 2026)
- Yahoo Finance / Bloomberg — 'Get me out': Traders dump software stocks (Feb 4, 2026)
- Axios — Software selloff offers tech stock opportunities (Feb 5, 2026)
- TradingKey — Is SaaS Dead? The Truth Behind the Software Meltdown (Feb 12, 2026)
- deVere Group — The 2026 Software Stock Crash (Feb 2026)
- Michael Brenndoerfer — The February 2026 Selloff: Anatomy of a Multi-Trillion Dollar Wipeout
- SaaStr — The 2026 SaaS Crash: It's Not What You Think
- Veracode — 2025 GenAI Code Security Report
- Help Net Security — AI can write your code, but nearly half of it may be insecure (Aug 2025)
- Cloud Security Alliance — AI-generated code security findings, cited in Medium / industry analysis (2025)
- FE International — SaaS Valuations: How to Value a SaaS Business in 2026 (Blacksmith 2026 SaaS Trends Report reference)
- Zylo — 2026 SaaS Management Index and 2026 SaaS Trends
- Bain & Company — Will Agentic AI Disrupt SaaS? Technology Report 2025
- FinancialContent — The 2025 IPO Market Review and 2026 Outlook (Dec 2025)
- Crunchbase — IPOs Picked Up in 2025 and 2026 Outlook (Dec 2025)
- Erste Asset Management — After a strong IPO year (Feb 2026)
- Flippa — SaaS Valuation Multiples in 2026
- Ful.io — SaaS Valuation Multiples 2025
- Software Equity Group — Public SaaS Company Valuations and What They Mean for Private Companies
- publicsaascompanies.com — Real-time SaaS valuation database (Jan 2026 snapshot)
- FinancialContent - Software-mageddon: The $800 Billion Tech Selloff and the Death of the SaaS Model
- Wall Street Says Software’s AI Stock Market Wipeout Went Too Far - Bloomberg
- SaaS Valuation Multiples: 2015-2025 – Aventis Advisors
- 2025 Private SaaS Company Valuations - SaaS Capital
- FinancialContent - SaaSpocalypse 2026: Why Wall Street is Slashing Software Valuations and Turning Cautious on Debt
- Public SaaS Company Valuations and What They Mean for Private Companies
- Software-mageddon: The $800 Billion Tech Selloff and the Death of the SaaS Model | FinancialContent
- Software experiencing 'most exciting moment' as AI fears hammer the stocks
- ‘Get me out’: Traders dump software stocks as AI fears erupt
- Is SaaS Dead? The Truth Behind the Software Meltdown, the Missing Floor, and the Peak That’s Not Coming Back
- What’s Behind the ‘SaaSpocalypse’ Plunge in Software Stocks - Bloomberg
- EBITDA Multiples for SaaS and Software Companies (2025-2026)
- SaaS Underperformance Drags Down Tech M&A in Early 2025 | AGC Partners
- SaaS M&A and Public Market Report | Software Equity Group
- SaaS Valuation Multiples 2025: What Investors Are Paying for Growth | Ful.io
- SaaS Index: Revenue Multiples, Valuations & Market Trends
- FinancialContent - The 2025 IPO Market Review: A Year of Selective Recovery and the 2026 Outlook
- The 2025 IPO Market Review: A Year of Selective Recovery and the 2026 Outlook
- After a strong IPO year, there could be even more this year - Erste Asset Management Investment Blog
- Crunchbase Predicts: IPOs Picked Up In 2025 And The Outlook For 2026 Is Even More Optimistic
- The 2026 SaaS Crash: It’s Not What You Think | SaaStr
- AI can write your code, but nearly half of it may be insecure - Help Net Security
- We Asked 100+ AI Models to Write Code. Here’s How Many Failed Security Tests. | Veracode
- AI Code Is Going to Kill Your Startup (And You’re Going to Let It) | by kcl17 | Medium
- SaaS Valuations: How to Value a SaaS Business in 2026
- 175+ Unmissable SaaS Statistics for 2026
- What to Know About the Software Stock Selloff | Morningstar
- 3 factors that will separate the 'SaaSpocalypse' winners from losers | Fortune
- Software Valuation Multiples: 2015-2025 – Aventis Advisors
- AI fears pummel software stocks: Is it 'illogical' panic or a SaaS apocalypse?
- Software Stocks: Are Investors Worrying Too Much About AI Disruption? | Morningstar UK
- The tech stock free fall doesn’t make any sense, BofA says in rebuke to investors | Fortune
- Software M&A Dominates 2025 With 65% Market Share - M&A Alerts
- Software selloff offers tech stock opportunities
- SEG 2026 Annual SaaS Report
Chapter 2
- Andreessen Horowitz, "LLMflation: LLM Inference Cost Is Going Down Fast" (Nov. 2024)
- Benchmarkit, "2025 SaaS Performance Metrics Benchmarks" (2025)
- Bessemer Venture Partners, "State of AI in 2025" (2025)
- BetterCloud, "AI and the SaaS Industry in 2026" (Jan. 2026)
- Deloitte, "SaaS Meets AI Agents: Transforming Budgets" (2026)
- Epoch AI, Cottier, B. et al., "LLM Inference Prices Have Fallen Rapidly but Unequally Across Tasks" (Mar. 2025)
- Futurum Group, "AI Capex 2026: The $690B Infrastructure Sprint" (Feb. 2026)
- Gartner, Enterprise SaaS Pricing and Spend Forecasts (2025–2026)
- GitHub / TechCrunch, "GitHub Copilot Crosses 20M All-Time Users" (Jul. 2025)
- Grand View Research, "Artificial Intelligence Market Size: Industry Report, 2033" (2025)
- G-Squared CFO, "SaaS Benchmarks: 5 Performance Benchmarks for 2026" (2026)
- Intercom, Fin AI Pricing Documentation (2025–2026)
- Introl Blog, "Inference Unit Economics: The True Cost Per Million Tokens Guide" (Feb. 2026)
- IntuitionLabs, "DeepSeek's Low Inference Cost Explained" (Oct. 2025)
- LiveChatAI, "The True Cost of Customer Support: 2025 Analysis" (2025)
- McKinsey, "The AI-Centric Imperative: Navigating the Next Software Frontier" (2025)
- McKinsey, "Evolving Models and Monetization Strategies in the New AI SaaS Era" (2025)
- METR, "Measuring the Impact of Early-2025 AI on Experienced Open-Source Developer Productivity" (Jul. 2025); arXiv:2507.09089
- MIT Technology Review, "AI Coding Is Now Everywhere. But Not Everyone Is Convinced." (Dec. 2025)
- MLQ AI / CNN / The Register, DeepSeek R1 Training Cost Reporting (Sep. 2025)
- Monetizely, "The Economics of AI-First B2B SaaS in 2026" (2026)
- NVIDIA Blog, "Leading Inference Providers Cut AI Costs by up to 10x with Open Source Models on NVIDIA Blackwell" (Feb. 2026)
- Private Markets Insights / Alt Goes Mainstream, Vista Equity Partners Robert F. Smith Interviews (2025)
- SaaS Capital, "AI Update for 2025 Q1" (Mar. 2025)
- SaaS CFO, "The Real Economics of SaaS Versus AI Companies" (2025)
- SaaStr, "Have AI Gross Margins Really Turned the Corner?" (2025)
- SaaStr, "Our 20+ AI Agents and Their Moats: Real But Weak" (2025)
- SaaS Barometer Newsletter, "AI Metrics That Matter in 2025" (Aug. 2025)
- Superframeworks, "Best AI Coding Tools 2025: Vibe Coding Tools Compared" (2025)
- The AI Innovator, "University Researchers Recreate DeepSeek AI Model for $30" (2025)
- Valere.io, "Signal vs. Noise: Why Your Gross Margins Are Hemorrhaging in 2026" (2026)
- Veracode, "2025 GenAI Code Security Report" (Jul. 2025); via BusinessWire
- Zylo, "2025 SaaS Management Index" (Jan. 2025)
- AI and the SaaS industry in 2026 | BetterCloud
- AI coding is now everywhere. But not everyone is convinced. | MIT Technology Review
- AI-Generated Code Poses Major Security Risks in Nearly Half of All Development Tasks, Veracode Research Reveals
- [2507.09089] Measuring the Impact of Early-2025 AI on Experienced Open-Source Developer Productivity
- Everyone says AI makes developers faster, but what if it’s costing you 19% more time? | by Nati Shalom | Medium
- Nvidia to Google TPU Migration 2025: The $6.32B Inference Cost Crisis
- Welcome to LLMflation - LLM inference cost is going down fast ⬇️ | Andreessen Horowitz
- Inference Unit Economics: The True Cost Per Million Tokens | Introl Blog
- DeepSeek's Low Inference Cost Explained: MoE & Strategy | IntuitionLabs
- LLM inference prices have fallen rapidly but unequally across tasks | Epoch AI
- Leading Inference Providers Cut AI Costs by up to 10x With Open Source Models on NVIDIA Blackwell | NVIDIA Blog
- 2025 SaaS Performance Metrics | Benchmarkit
- SaaS Capital AI Update for 2025 Q1 - SaaS Capital
- LLM Pricing: Top 15+ Providers Compared
- Artificial Intelligence Market Size | Industry Report, 2033
- AI Metrics that Matter - in 2025 - SaaS Barometer Newsletter
- AI Capex 2026: The $690B Infrastructure Sprint - Futurum
- Cost Per Token Analysis | Introl Blog
- AI Capex Cycle: Can Hyperscalers Deliver Durable Returns in 2026 | Windows Forum
- Measuring the Impact of Early-2025 AI on Experienced Open-Source Developer Productivity - METR
- Veracode October 2025 Update: GenAI Code Security Report |
Chapter 3
- Apollo Global Management, "AI and the Next Phase of the Software Cycle" (Feb. 2026)
- Bain & Company, "Will Agentic AI Disrupt SaaS? Technology Report 2025" (2025)
- Bessemer Venture Partners, "Part I: The Future of AI is Vertical" (Aug. 2025)
- BetterCloud, "AI and the SaaS Industry in 2026" (Jan. 2026)
- CNBC, "AI Fears Pummel Software Stocks" (Feb. 6, 2026)
- Computerworld / CIO, "SaaS Isn't Dead, The Market Is Just Becoming More Hybrid" (Feb. 2026)
- Constellation Research, "Enterprise Technology 2026: 15 AI, SaaS, Data, Business Trends" (2026)
- Constellation Software, Q3 2025 MD&A; PitchBook Profile (Feb. 2026)
- Cybersecurity Ventures, "Official 2026 Cybersecurity Market Report" (Dec. 2025)
- Deloitte, cited in CIO/Computerworld re: SaaS Forecast (Feb. 2026)
- DEVOPSdigest, "2026 Low-Code/No-Code Predictions" (2026)
- DigitalApplied, "The SaaSpocalypse: AI Agents Disrupting Software Industry" (Feb. 2026)
- ERP Today, "Enterprise Software Faces AI-Driven Disruption" (Jan. 2026)
- Forrester, "Predictions 2026: AI Agents, Changing Business Models, Enterprise Software" (Nov. 2025)
- Gartner, "Worldwide IT Spending to Grow 10.8% in 2026" (Feb. 2026)
- Gartner, "Information Security End-User Spending to Total $240B in 2026" (Jul. 2025)
- Grand View Research, "AI in Cybersecurity Market Report, 2030" (2025)
- Hated Moats, "Constellation Software: Deep Dive Analysis" (Nov. 2025)
- Mayfield, "How AI is Transforming Vertical SaaS" (Oct. 2025)
- Morningstar, "Constellation Software Is a Vertical Software Acquisition Machine" (Dec. 2025)
- NEA, "Tomorrow's Titans: Vertical AI" (Feb. 2025)
- Next Big Teng, "The SaaSacre of 2026" (Feb. 2026)
- Precedence Research, "AI in Cybersecurity Market Size 2026" (Dec. 2025)
- Procore Technologies: Meritech Capital S-1 Breakdown; DCFmodeling.com Financial Analysis (2025); Vendep Capital "Forget the Data Moat" (2025)
- Statista, "Global AI Cybersecurity Market Size 2030" (2024)
- The New Stack, "No Code Is Dead" (Jul. 2025)
- The Register, "Rise of AI Means Companies Could Pass on SaaS" (Feb. 4, 2026)
- Tidemark Capital, "AI Playbook for Vertical SaaS Founders" (2025)
- Uncover Alpha, "The Great SaaS Unbundling" (Feb. 2026)
- VC Cafe, "Vertical AI in 2026: The Good, The Bad, and The Ugly" (Jan. 2026)
- Vendep Capital, "Forget the Data Moat: The Workflow Is Your Fortress in Vertical SaaS" (2025)
- SaaS isn’t dead, the market is just becoming more hybrid
- The SaaSpocalypse: AI Agents Disrupting Software Industry
- AI and the Next Phase of the Software Cycle
- Rise of AI means companies could pass on SaaS • The Register
- The SaaSocalypse Has Begun: AI, Pricing Collapse, and the New Rules of Financial Resilience | by Hemant Kaushik | Feb, 2026 | Medium
- Will Agentic AI Disrupt SaaS? | Bain & Company
- No Code Is Dead - The New Stack
- 2026 Low-Code/No-Code Predictions | DEVOPSdigest
- No-Code Transformations Usage Trends — 45 Statistics Every Business Leader Should Know in 2026 | Integrate.io
- The Future of Low-Code: Trends Shaping 2026–2030! | by Nigel Tape | Jan, 2026 | Medium
- Vertical AI in 2026: The Good, The Bad, and The Ugly – VC Cafe
- Forget the data moat: The workflow is your fortress in vertical SaaS | Vendep
- Procore Technologies, Inc. (PCOR): history, ownership, mission, how it works & makes money – DCFmodeling.com
- Breaking Down Procore Technologies, Inc. (PCOR): Key Insights for Investors – DCFmodeling.com
- Constellation Software 2026 Company Profile: Stock Performance & Earnings | PitchBook
- Constellation Software: Acquiring and Empowering
- 1 CONSTELLATION SOFTWARE INC. MANAGEMENT’S DISCUSSION AND ANALYSIS (“MD&A”)
- Constellation Software: Deep Dive Analysis - Hated Moats
- Why We’re Bullish on Vertical AI in 2025 and How These Companies Create Long-Term Value | by Elvia Perez | Medium
- AI Infrastructure: The Next Frontier for Portfolio Growth — MYJ Capital
- Artificial Intelligence (AI) In Cybersecurity Market Size 2026 ...
- Gartner Forecasts Worldwide End-User Spending on Information Security to Total $213 Billion in 2025
- Official 2026 Cybersecurity Market Report: Predictions And Statistics
- Cyber Budgets Slow, AI Surges: What the Data Says About 2026
- Microsoft Data Security Index 2026: AI Adoption Is Outpacing Data Security Controls
- FinancialContent - FROG Q4 Deep Dive: Security and AI Tailwinds Propel JFrog’s Software Supply Chain Platform
- FROG Q4 Deep Dive: Security and AI Tailwinds Propel JFrog’s Software Supply Chain Platform | FinancialContent
- AI, security tailwinds signal promising 2026 for Cisco | Network World
- AI fears pummel software stocks: Is it 'illogical' panic or a SaaS apocalypse?
- The Great SaaS Unbundling: Why AI Will Destroy Half the Industry and Supercharge the Other Half
- Predictions 2026: AI Agents, Changing Business Models, And Workplace Culture Impact Enterprise Software
- Enterprise technology 2026: 15 AI, SaaS, data, business trends to watch | Constellation Research
- Enterprise Software Faces AI-Driven Disruption as Development Productivity Gains Fail to Materialize
Chapter 4
- Align BA, "The 'SaaSpocalypse' Versus Real-World Moats" (Feb. 2026)
- Aventis Advisors, "SaaS Valuation Multiples: 2015–2025" (Jan. 2026)
- Bain & Company, "Will Agentic AI Disrupt SaaS?" Technology Report 2025
- BetterCloud, "AI and the SaaS Industry in 2026" (Jan. 2026)
- BlackFog, "Shadow AI Threat Grows Inside Enterprises" (Jan. 2026)
- Brim Labs, "The Data Moat Is the Only Moat" (Dec. 2025)
- Business Research Insights, "Salesforce AppExchange Tools Market 2025–2033" (2025)
- CIO.com, "Salesforce Is Tightening Control of Its Data Ecosystem" (Dec. 2025)
- Clearly Acquired, "EBITDA Multiples for SaaS and Software Companies (2025–2026)" (2025)
- Constellation Research, "Enterprise Technology 2026: 15 AI, SaaS, Data, Business Trends" (2026)
- Corporate Compliance Insights, "2026 Operational Guide to Cybersecurity, AI Governance & Emerging Risks" (Jan. 2026)
- Cybersecurity Dive / Netskope, "Risky Shadow AI Use Remains Widespread" (Jan. 2026)
- Dark Reading, "2026 Security Priorities Survey" (Feb. 2026)
- Deloitte, "SaaS Meets AI Agents: Transforming Budgets" (Nov. 2025)
- Digital Applied, "The SaaSpocalypse: AI Agents Disrupting Software Industry" (Feb. 2026)
- eSecurity Planet, "Shadow AI and the Growing Risk to Enterprise Security" (Jan. 2026)
- Finro Financial Consulting, "Core vs. Applied AI: The Valuation Split in Q1 2026" (Feb. 2026)
- FinTech Global, "AI Regulatory Compliance Priorities for 2026" (Jan. 2026)
- Gartner, "Critical GenAI Blind Spots That CIOs Must Urgently Address" (Nov. 2025)
- Governance Intelligence, "How AI Will Redefine Compliance, Risk and Governance in 2026" (2026)
- IBM / Ponemon Institute, "Cost of a Data Breach Report 2025" (July 2025)
- Insignia Business Review, "Is Proprietary Data Still a Moat in the AI Race?" (Mar. 2025)
- ION Analytics / Mergermarket, "European SaaS Hit by AI Crosswinds" (Dec. 2025)
- JumpCloud, "11 Stats About Shadow AI in 2026" (Feb. 2026)
- Kiteworks, "Agentic AI: Biggest Enterprise Security Threat for 2026" (Feb. 2026)
- Market Clarity, "What Are the Realistic Margins of an AI Wrapper?" (Oct. 2025)
- Meritech Capital, "SaaS Isn't Dead (Yet) and AI Could Make It Bigger" (2026)
- Microsoft, "Cyber Pulse: An AI Security Report" (2026)
- Monetizely, "The 2026 Guide to SaaS, AI, and Agentic Pricing Models" (Jan. 2026)
- Multiples.vc, "Software Valuation Multiples" (Oct. 2025)
- NextBuild, "Beyond the OpenAI Wrapper: 5 Ways to Build a Defensible AI Product" (Sep. 2025)
- Olakai, "Shadow AI: The Hidden Risk in Your Enterprise" (Oct. 2025)
- Pavilion, "The AI Shift That Could Reshape SaaS: Switching Costs" (2026)
- Remio.ai, "SaaS-pocalypse 2026: Why AI Agents Are Wiping Out $300B" (Feb. 2026)
- SaaStr, "Our 20+ AI Agents and Their Moats: Real But Weak" (Nov. 2025)
- SEG (Software Equity Group), "2026 Annual SaaS Report" (Feb. 2026)
- Second Talent, "Top 50 Shadow AI Statistics 2026" (Feb. 2026)
- Startups Magazine, "Why Most AI Startups Won't Have Defensible IP by 2026" (2025)
- Synebo, "AppExchange Trends and Growth Strategies for ISVs" (Oct. 2025)
- Terralogic, "Regulatory Compliance in 2026: Scaling Audit-Readiness with AI" (Feb. 2026)
- Toolient, "Wall Street Punishes AI Laggards as Winners vs Losers Emerges" (Feb. 2026)
- Uncover Alpha, "The Great SaaS Unbundling" (Feb. 2026)
- Vendep Capital, "Forget the Data Moat: The Workflow Is Your Fortress" (2025)
- VentureBeat, "Stop Calling It the AI Bubble — It's Multiple Bubbles" (Jan. 2026)
- Wilson Sonsini, "2026 Year in Preview: AI Regulatory Developments" (Jan. 2026)
- Software Valuation Multiples - October 2025 - Multiples.vc - Public Comps and Valuation Multiples
- EBITDA Multiples for SaaS and Software Companies (2025-2026)
- Mistral 3 vs Llama 3.1 (2026): The Open AI Stack Battle for Europe
- SEG 2026 Annual SaaS Report
- Will Agentic AI Disrupt SaaS? | Bain & Company
- Why Multi-Agent Orchestration Will Define the Next Wave of AI Value | by Aleksandr Azimbaev | The Agent Protocol | Oct, 2025 | Medium
- Why 40% of Enterprises Will Face AI Disaster by 2030—And How to Stop It - CXO Chapter
- IBM Report: 13% Of Organizations Reported Breaches Of AI Models Or Applications, 97% Of Which Reported Lacking Proper AI Access Controls
- 2025 Cost of a Data Breach Report: Navigating the AI rush without sidelining security | IBM
- Gartner Identifies Critical GenAI Blind Spots That CIOs Must Urgently Address
- AppExchange Trends and Growth Strategies for ISVs | Synebo
- Salesforce AppExchange Tools Market - 2025 To 2033 Report
- Our 20+ AI Agents and Their Moats: Real But Weak | SaaStr
- Top 10 Open Source LLMs 2026: DeepSeek Revolution Guide | Articles | o-mega
- The state of open source AI models in 2025 | Red Hat Developer
Chapter 5
- Aventis Advisors, "SaaS Valuation Multiples: 2015–2025" (Jan. 2026)
- Aventis Advisors, "Software Valuation Multiples: 2015–2025" (Jan. 2026)
- AlixPartners, "2026 Enterprise Software Technology Predictions Report" (Dec. 2025)
- Bessemer Venture Partners, "The AI Pricing and Monetization Playbook" (Feb. 2026)
- BetterCloud, "AI and the SaaS Industry in 2026" (Jan. 2026)
- Clearly Acquired, "EBITDA Multiples for SaaS and Software Companies (2025–2026)" (2025)
- Computerworld, "Enterprise Tech Spending to Cross $6 Trillion in 2026" (Feb. 2026)
- Deloitte, "SaaS Meets AI Agents: Transforming Budgets" (Nov. 2025)
- Eqvista, "SaaS Index: Revenue Multiples, Valuations & Market Trends" (Jan. 2026)
- FE International, "SaaS Valuations: How to Value a SaaS Business in 2026" (Jan. 2026)
- FinancialContent / MarketMinute, "The AI Crosshairs: Wall Street's $1 Trillion Software-mageddon" (Feb. 2026)
- Flippa, "SaaS Valuation Multiples in 2026" (Jan. 2026)
- Gartner, "Worldwide AI Spending Will Total $2.5 Trillion in 2026" (Jan. 2026)
- Gartner, "Worldwide IT Spending to Grow 10.8% in 2026" (Feb. 2026)
- IDC, "AI & GenAI Predictions: Key Insights for 2025 and Beyond" (2025)
- L.E.K. Consulting, "How AI Is Changing SaaS Pricing" (Dec. 2025)
- Market Clarity, "Where is AI Spending Going in 2026?" (Nov. 2025)
- Monetizely, "The 2026 Guide to SaaS, AI, and Agentic Pricing Models" (Jan. 2026)
- Mordor Intelligence, "Enterprise AI Market — Share, Trends & Size 2025–2031" (Jan. 2026)
- SaaS Capital, "SaaS Valuation Multiples: Understanding the New Normal" (Aug. 2025)
- SaaStr, "Can You Really Grow in 2026 if You Aren't Tapping into AI Budget?" (Dec. 2025)
- SaaStr, "Who Will Buy The SaaS Companies?" (Oct. 2025)
- Sapphire Ventures, "2026 Outlook: 10 AI Predictions" (Dec. 2025)
- SEG (Software Equity Group), "2026 Annual SaaS Report" (Feb. 2026)
- TechCrunch, "VCs Predict Enterprises Will Spend More on AI in 2026 — Through Fewer Vendors" (Dec. 2025)
- Zylo, "SaaS Predictions for 2026 Signal a Shift in Spend and Governance" (Feb. 2026)
- SaaS Valuation Multiples: 2015-2025 – Aventis Advisors
- EBITDA Multiples for SaaS and Software Companies (2025-2026)
- Gartner Says Worldwide AI Spending Will Total $2.5 Trillion in 2026
- Enterprise tech spending to cross $6 trillion in 2026, driven by AI infrastructure boom – Computerworld
- SEG 2026 Annual SaaS Report
- AlixPartners 2026 Enterprise software technology predictions report | AlixPartners
- VCs predict enterprises will spend more on AI in 2026 — through fewer vendors | TechCrunch
- FinancialContent - The AI Crosshairs: Wall Street’s $1 Trillion ‘Software-mageddon’ Marks the Great Disruption Pivot
- IDC | AI & GenAI Predictions: Key Insights for 2025 and Beyond - eBook
- The AI pricing and monetization playbook - Bessemer Venture Partners
- SaaS meets AI agents: Transforming budgets, customer experience, and workforce dynamics
- SaaS Valuation Multiples: Understanding the New Normal - SaaS Capital
- Who Will Buy The SaaS Companies? | SaaStr
- Our 2026 Outlook: 10 AI Predictions Shaping Enterprise, Infrastructure & the Next Wave of Innovation | Sapphire Ventures
- Software Valuation Multiples: 2015-2025 – Aventis Advisors
Chapter 6
- Accenture, "How Private Equity Can Unlock Mid-Market Value Through AI" (Dec. 2025)
- AlixPartners, "2026 Enterprise Software Technology Predictions Report" (Dec. 2025)
- Bain & Company, "New Diligence Challenge: Uncovering AI Risks and Opportunities" (2025)
- BDO, "AI Use Case Portfolio for Private Equity" (Sep. 2025)
- CLA, "AI and Private Equity in 2026: 6 Predictions Redefining Value Creation" (2026)
- Corum Group, "Tech M&A Surges in H1 2025" (2025)
- EY, "Beyond Implementation: PE's AI Evolution into Differentiated Growth" (2025)
- EY Switzerland, "How AI Is Sustainably Transforming Value Creation in PE" (Nov. 2025)
- FTI Consulting, "Four Predictions Private Equity 2026" (Feb. 2026)
- Growth Unhinged / PricingSaaS, "What Actually Works in SaaS Pricing Right Now" (Feb. 2026)
- McKinsey, "Evolving Models and Monetization Strategies in the New AI SaaS Era" (Sep. 2025)
- McKinsey, "The AI-Centric Imperative: Navigating the Next Software Frontier" (Oct. 2025)
- McKinsey, "The State of AI in 2025: Agents, Innovation, and Transformation" (Nov. 2025)
- Metronome / Greyhound Capital, "State of Usage-Based Pricing 2025" (2025)
- Monetizely, "SaaS Pricing Benchmark Study 2025" (Dec. 2025)
- Monetizely, "The 2026 Guide to SaaS, AI, and Agentic Pricing Models" (Jan. 2026)
- PwC, "How Private Equity Survives AI" (2026)
- PwC, "Global M&A Trends in Technology, Media and Telecommunications: 2026 Outlook" (2026)
- RSM, "AI Due Diligence Assessment in Private Equity" (2025)
- SEG (Software Equity Group), "Who's Driving Software M&A? 10 Private Equity Firms to Know" (Feb. 2026)
- Tamarly Consulting, "Vista Equity Partners' Use of AI and Generative AI" (Oct. 2025)
- Vista Equity Partners, "Beyond the AI Bubble" (Nov. 2025)
- Vista Equity Partners, "Agentic AI Factory" (Jun. 2025)
- CNBC, "Vista Equity Partners Says Its 'Agentic Factory' Is Reinventing the Way Companies Use AI" (Jan. 2026)
- Zylo, "What Is Consumption Based Pricing? Pros, Cons & Examples" (Feb. 2026 update)
- Zorian / PE Alpha, "2026 PE Outlook: AI, Capital Cycles, and the Return of Deal Flow" (Feb. 2026)
- AI and Private Equity in 2026: 6 Predictions Redefining Value Creation
- How AI is sustainably transforming value creation in private equity
- New Diligence Challenge: Uncovering AI Risks and Opportunities | Bain & Company
- 2026 Enterprise software technology predictions report How AI will reshape
- What actually works in SaaS pricing right now
- Evolving models and monetization strategies in the new AI SaaS era | McKinsey
- SaaS Pricing Benchmark Study 2025: Key Insights from 100+ Companies Analyzed
- Melvine's AI Analysis # 56 - 🚀 -Vista Equity Partners' Use of AI and Generative AI — Tamarly Consulting
- Vista Equity Partners says its 'agentic factory' is reinventing the way companies use AI
- Vista’s Agentic AI Factory - Vista Equity Partners
- Beyond implementation: PE’s AI evolution into differentiated growth | EY - US
- How private equity can unlock mid-market value through AI
- The AI-centric imperative: Navigating the next software frontier
- Global M&A trends in technology, media and telecommunications: 2026 outlook | PwC
- Tech M&A Surges in H1 2025 | Corum Group
- Four Predictions Private Equity 2026 | FTI Consulting
- Software M&A Dominates 2025 With 65% Market Share - M&A Alerts
- M&A activity insights: December 2025 | EY - US
Chapter 7
- PwC 29th Annual Global CEO Survey (2026): Survey of 4,454 CEOs across 95 countries; found 56% saw no AI ROI. Fortune, The Register, ALM Corp
- MIT Study on AI Pilot Failures (August 2025): Research finding 95% of generative AI pilots failed; attributed to organizational "learning gap." Mind the Product, cited in Menlo Ventures 2025 State of Generative AI in the Enterprise
- McKinsey State of AI Global Survey (2025): 1,993 respondents across 105 nations; found workflow redesign is strongest AI value driver. McKinsey
- PwC AI Agent Survey (May 2025): 308 U.S. executives; 79% adopting AI agents, but deep impact limited. PwC
- CloudZero 2025 State of AI Costs Report: Survey of 500 U.S. engineering professionals; average monthly AI spend at $85.5K. CloudZero
- IDC FutureScape 2026: Worldwide Agentic AI Predictions (October 2025): Forecasts 70% vendor pricing refactoring by 2028. BusinessWire, CIO.com, IDC Blog
- Metronome State of Usage-Based Pricing (2025): 85% of SaaS firms using or planning UBP; 77% of largest software companies use consumption-based models. Metronome
- Bain & Company — Will Agentic AI Disrupt SaaS? (2025): Only 17% of enterprise SaaS vendors have implemented true outcome-based pricing. Bain
- Menlo Ventures 2025 State of Generative AI in the Enterprise (January 2026): Enterprise AI surged from $1.7B to $37B since 2023; startups captured 63% of AI application market; 47% of AI deals reach production. Menlo Ventures, GlobeNewsWire
- Y Combinator / Garry Tan (March 2025): ~25% of YC startups use AI to write 95%+ of their code; founders no longer need teams of 50–100 engineers. LeadDev
- Gartner Enterprise Applications Forecast (August 2025): 40% of enterprise apps will integrate task-specific AI agents by end of 2026. Gartner
- OpenAI o3 Price Reduction (June 10, 2025): 80% price cut; $10→$2 input, $40→$8 output per million tokens. VentureBeat, Apidog
- Anthropic Claude Cowork / February 2026 Sell-Off: CNBC, NxCode, AI 2 Work
- Software Valuation Multiples Database: Aventis Advisors
- PE Exit Dynamics: McKinsey — Private Equity's New Exit Playbook, BDO — How PE Firms Can Increase Portfolio Value
- 2026: Year of Scale or Fail: CIO.com
- AI SaaS Economics and Pricing: Monetizely — Economics of AI-First B2B SaaS, Monetizely — 2026 Guide to SaaS, AI, and Agentic Pricing Models, Zylo — SaaS Predictions 2026
- SaaS Disruption Risk Analysis: WebProNews — Trillion-Dollar Reckoning, AInvest — AI's Next Casualty
- The 2026 SaaS Apocalypse: Why Wall Street Is Dumping Software Stocks - AI 2 Work - AI Insights & Trends
- 95% AI-written code? Unpacking the Y Combinator CEO’s developer jobs bombshell - LeadDev
- Menlo Ventures’ 2025 State of Generative AI Report: Enterprise Investment Hit $37B in 2025, Tripling in One Year - Netscape News
- Outcome-Based Pricing: The Next Frontier in SaaS?
- 2025: The State of Generative AI in the Enterprise | Menlo Ventures
- The State of AI: Global Survey 2025 | McKinsey
- PwC’s AI Agent Survey
- AI Software Cost: 2025 Enterprise Pricing Benchmarks For Manufacturing Leaders
- Gartner Predicts 40% of Enterprise Apps Will Feature Task-Specific AI Agents by 2026, Up from Less Than 5% in 2025
- IDC FutureScape 2026 Predictions Reveal the Rise of Agentic AI and a Turning Point in Enterprise Transformation
- IDC - Is SaaS Dead? Rethinking the Future of Software in the Age of AI
- State of Usage-Based Pricing 2025 Report
- OpenAI announces 80% price drop for o3, it's most powerful reasoning model | VentureBeat
- OpenAI O3 Model Pricing Drops 80%: What It Means for API Developers
Chapter 8
- Software As A Service Market Size | Industry Report, 2030
- Software as a Service [SaaS] Market Size, Global Report, 2034
- Software as a Service - Worldwide | Market Forecast
- Workday CEO calls narrative that AI is killing software 'overblown'
- CNBC Excerpts: CNBC Broadcasts Live from Davos, Switzerland Today, Thursday, January 22
- Workday’s CEO is stepping down as its cofounder resumes the job
- Workday CEO Eschenbach Out After Stock Drops 47% From Peak, Co-Founder Bhusri Returns | Fintool News
- Workday Cuts 400 Jobs as Software Stocks...
- Salesforce Delivers Record Third Quarter Fiscal 2026 Results Driven by Agentforce & Data 360 - Salesforce
- Revisiting the Bullish Case for Agentforce in 2026 | Salesforce Ben
- Salesforce Q3 FY 2026: AI Agents, Data 360 Lift Bookings and FY26 Outlook
- FinancialContent - Dear Salesforce Stock Fans, Mark Your Calendars for February 25
- SAP AI Agents in 2026: Joule Studio Features & Case Studies
- SAP Business AI: Release Highlights Q4 2025 | SAP News Center
- New Joule Agents and Embedded Intelligence Supercharge Business Returns Across the Enterprise
- ServiceNow Investor Relations — ServiceNow Reports Fourth Quarter and Full-Year 2025 Financial Results; Board of Directors Authorizes Additional $5B for Share Repurchase Program
- ServiceNow Q4 FY 2025 Earnings Highlight AI Platform Momentum - Futurum
- ServiceNow (NOW) Q4 2025 earnings report
- MLQ.ai | AI for investors
- ServiceNow (NOW) Investor Relations, Earnings Summary & Outlook
- Field Notes from the Generative AI Insurgency in Private Equity | Bain & Company
- Vista Equity Partners Names Winners of Agentic AI Hackathons | Morningstar
- AI and the SaaS industry in 2026 | BetterCloud
- Vista Equity Partners Names Winners of Agentic AI Hackathons - Vista Equity Partners
- Vista Equity sells stake in LogicMonitor at a big gain in valuation - PitchBook
- Top 10 SaaStr AI Predictions for 2026
- 2026 PE Outlook: AI, Capital Cycles, and the Return of Deal Flow - PE Alpha
Chapter 9
- Align BA, "The 'SaaSpocalypse' Versus Real-World Moats" (Feb. 2026)
- BetterCloud, "AI and the SaaS Industry in 2026" (Jan. 2026)
- CLA, "AI and Private Equity in 2026: 6 Predictions Redefining Value Creation" (2026)
- Deloitte, "SaaS Meets AI Agents: Transforming Budgets" (Nov. 2025)
- Foundation Capital, "Where AI is Headed in 2026" (Jan. 2026)
- Gartner, cited via Deloitte: "By 2030, at least 40% of enterprise SaaS spend will shift toward usage-, agent-, or outcome-based pricing" (2025)
- Gartner, "40% of Enterprise Apps Will Feature Task-Specific AI Agents by 2026" (Aug. 2025)
- InfotechLead, "Gartner: CIOs Navigate Change as AI Agents Redefine SaaS Pricing" (Aug. 2025)
- McKinsey, "SaaS and the Rule of 40" (2021; updated methodology)
- Monetizely, "The 2026 Guide to SaaS, AI, and Agentic Pricing Models" (Jan. 2026)
- PwC, "2026 AI Business Predictions" (2026)
- SaaS Capital, "Growth, Profitability, and the Rule of 40 for Private SaaS Companies" (Aug. 2025)
- Software Equity Group, "The Rule of 40: Understanding a Key Metric for SaaS Success" (Nov. 2025)
- WebProNews, "The Trillion-Dollar Reckoning: How AI Threatens to Unravel Private Equity's Massive SaaS Empire" (Feb. 2026)
- AI and the SaaS industry in 2026 | BetterCloud
- SaaS meets AI agents: Transforming budgets | Deloitte
- AI and Private Equity in 2026 | CLA
- The Trillion-Dollar Reckoning | WebProNews
- The "SaaSpocalypse" Versus Real-World Moats | Align BA
- Gartner: CIOs Navigate Change as AI Agents Redefine SaaS Pricing | InfotechLead
- Where AI is Headed in 2026 | Foundation Capital
- Growth, Profitability, and the Rule of 40 | SaaS Capital
- The 2026 Guide to SaaS, AI, and Agentic Pricing Models | Monetizely
- 2026 AI Business Predictions | PwC
- Rule of 40 Valuation | Abacum
- The Rule of 40 | Software Equity Group
- The "SaaSpocalypse" Versus Real-World Moats - Align BA
- The Trillion-Dollar Reckoning: How AI Threatens to Unravel Private Equity’s Massive SaaS Empire
- Rule of 40 Redefined: 2026 SaaS Finance Framework | Abacum
- Growth, Profitability, and the “Rule of 40” for Private SaaS Companies - SaaS Capital
- SaaS meets AI agents: Transforming budgets, customer experience, and workforce dynamics
- SaaS Trends 2025-2026: 25 Definitive Trends Shaping the Industry | Modall - Modall
- AI and Private Equity in 2026: 6 Predictions Redefining Value Creation
- Gartner: CIOs Navigate Change as AI Agents Redefine SaaS Pricing - InfotechLead
- B2B SaaS Growth in 2026: 5 Lessons for B2B Startups - B2B Marketing Insights | Big Moves Marketing
- AI and the SaaS industry in 2026 | BetterCloud
Web Sources (extracted from text)
- The 2026 Software Stock Crash: Understanding the AI Disruption and Market Sell-off (Ch. 1)
- FinancialContent - Software-mageddon: The $800 Billion Tech Selloff and the Death of the SaaS Model (Ch. 1)
- Selloff wipes out nearly $1 trillion from software and services stocks as investors debate AI's existential threat (Ch. 1)
- SaaS Multiples Benchmarking – (Ch. 1)
- SaaS Valuation Multiples: 2015-2025 – Aventis Advisors (Ch. 1, 5)
- EBITDA Multiples for SaaS and Software Companies (2025-2026) (Ch. 1, 4, 5)
- Software Valuation Multiples - October 2025 - Multiples.vc - Public Comps and Valuation Multiples (Ch. 1, 4)
- 2025: The State of Generative AI in the Enterprise | Menlo Ventures (Ch. 1, 7)
- Menlo Ventures’ 2025 State of Generative AI Report: Enterprise Investment Hit $37B in 2025, Tripling in One Year (Ch. 1)
- Four Predictions Private Equity 2026 | FTI Consulting (Ch. 1, 6)
- AI and Private Equity in 2026: 6 Predictions Redefining Value Creation (Ch. 1, 6, 9)
- SaaS Valuations: How to Value a SaaS Business in 2026 (Ch. 1)
- AI and the SaaS industry in 2026 | BetterCloud (Ch. 1, 2, 4, 8, 9)
- Software As A Service (SaaS) Market Size to Surpass USD 1,367.68 Bn by 2035 (Ch. 1, 8)
- 175+ Unmissable SaaS Statistics for 2026 (Ch. 1)
- VCs predict enterprises will spend more on AI in 2026 — through fewer vendors | TechCrunch (Ch. 1, 5)
- 2026 Private Equity Industry Predictions (Ch. 1)
- Why that $2 trillion software wipeout didn't derail the AI bull market (Ch. 1)
- JPMorgan says the historic software selloff has gone far enough (Ch. 1)
- Wall Street Says Software's AI Stock Market Wipeout Went Too Far (Ch. 1)
- What to Know About the Software Stock Selloff (Ch. 1)
- Software sector sell-off: Which European companies are hit? (Ch. 1)
- Menlo Ventures estimates $19 billion in Gen AI spend during 2025 (Ch. 1)
- Gartner Forecasts Worldwide IT Spending to Grow 10.8% in 2026 (Ch. 1)
- Enterprise Software Spend Will Grow a Stunning 15.2% Next Year (Ch. 1)
- Software Equity Group Reports Record SaaS M&A Volume & Steady Valuations in Q3 2025 (Ch. 1)
- Q3 2025 Enterprise SaaS M&A Review (Ch. 1, 8)
- The February 2026 Selloff: Anatomy of a Multi-Trillion Dollar Wipeout (Ch. 1)
- US software stocks slammed on mounting fears over AI disruption, lose $1 trillion in week (Ch. 1)
- Menlo Ventures’ 2025 State of Generative AI Report: Enterprise Investment Hit $37B in 2025, Tripling in One Year (Ch. 1, 7)
- Software Equity Group Reports Record SaaS M&A Volume & Steady Valuations in Q3 2025 (Ch. 1, 8)
- Gartner Forecasts Worldwide IT Spending to Grow 10.8% in 2026, Totaling $6.15T - AIwire (Ch. 1)
- Software Valuation Multiples: 2015-2025 – Aventis Advisors (Ch. 1, 5, 7)
- 2025 Private SaaS Company Valuations - SaaS Capital (Ch. 1)
- Wall Street Says The SAAS & Software Business Model Is Dead (Agentic AI Killed It) | Buildy (Ch. 1)
- Vibe Coding and the SaaS Shakeup: What Business Leaders Need to Know Before Building Custom Software | Cyber Unit (Ch. 1)
- Stock market news for Feb. 3, 2026 (Ch. 1)
- The State of the SaaS Capital Markets: 2024 in Review, 2025 in Focus | Sapphire Ventures (Ch. 1)
- SaaS Index: Revenue Multiples, Valuations & Market Trends (Ch. 1)
- SailPoint stock drop 'hard to explain' after post-IPO earnings, CEO says (Ch. 1)
- SailPoint’s dull debut did little to loosen the stuck IPO window, expert says | TechCrunch (Ch. 1)
- 7 Go-To Best Vibe Coding Tools in 2026 (We Tested Every One) (Ch. 1)
- The Vibe Coding Threat: Is B2B SaaS Dead or Evolving? (Ch. 1)
- Vibe Coders AI Can Build Your SaaS But It Can’t Take Responsibility for Security | by Ashwin Kumar | Feb, 2026 | Medium (Ch. 1)
- Margin of Safety #43: SaaSpocalypse, Vibe Coding, and the New Scarcity (Ch. 1)
- SaaSpocalypse 2026: Agentic AI & The End Of Per-Seat SaaS | Outlook India (Ch. 1)
- FinancialContent - The SaaSpocalypse: AI Agent Revolution Triggers Historic 25% Sell-Off in Software Giants (Ch. 1)
- AI agents aren't eating SaaS—they're using it | Fortune (Ch. 1)
- The 2026 Guide to SaaS, AI, and Agentic Pricing Models (Ch. 1, 2, 7, 9)
- Will Agentic AI Disrupt SaaS? | Bain & Company (Ch. 1, 3, 4, 7)
- The tech stock free fall doesn’t make any sense, BofA says in rebuke to investors | Fortune (Ch. 1)
- SEG 2026 Annual SaaS Report (Ch. 1, 4, 5)
- Q3 2025 Quarterly Report (Ch. 1)
- SaaS Underperformance Drags Down Tech M&A in Early 2025 (Ch. 1)
- 3 factors that will separate the 'SaaSpocalypse' winners from losers (Ch. 1)
- SaaSpocalypse 2026: Why Wall Street is Slashing Software Valuations (Ch. 1)
- What's Behind the 'SaaSpocalypse' Plunge in Software Stocks (Ch. 1)
- Software Stocks: Are Investors Worrying Too Much About AI Disruption? (Ch. 1)
- Software experiencing 'most exciting moment' as AI fears hammer stocks (Ch. 1)
- AI fears pummel software stocks (Ch. 1, 3, 7)
- 'Get me out': Traders dump software stocks (Ch. 1)
- Software selloff offers tech stock opportunities (Ch. 1)
- Is SaaS Dead? The Truth Behind the Software Meltdown (Ch. 1)
- The 2026 SaaS Crash: It's Not What You Think (Ch. 1)
- 2025 GenAI Code Security Report (Ch. 1, 2)
- AI can write your code, but nearly half of it may be insecure (Ch. 1)
- 2026 SaaS Trends (Ch. 1)
- The 2025 IPO Market Review and 2026 Outlook (Ch. 1)
- IPOs Picked Up in 2025 and 2026 Outlook (Ch. 1)
- After a strong IPO year (Ch. 1)
- SaaS Valuation Multiples in 2026 (Ch. 1)
- SaaS Valuation Multiples 2025 (Ch. 1)
- Public SaaS Company Valuations and What They Mean for Private Companies (Ch. 1)
- Software-mageddon: The $800 Billion Tech Selloff and the Death of the SaaS Model | FinancialContent (Ch. 1)
- The 2025 IPO Market Review: A Year of Selective Recovery and the 2026 Outlook (Ch. 1)
- We Asked 100+ AI Models to Write Code. Here’s How Many Failed Security Tests. | Veracode (Ch. 1)
- AI Code Is Going to Kill Your Startup (And You’re Going to Let It) | by kcl17 | Medium (Ch. 1)
- Software M&A Dominates 2025 With 65% Market Share - M&A Alerts (Ch. 1, 6)
- GitHub Copilot Statistics & Adoption Trends [2025] | Second Talent (Ch. 2)
- GitHub Copilot vs Cursor : AI Code Editor Review for 2026 | DigitalOcean (Ch. 2)
- GitHub Copilot crosses 20M all-time users | TechCrunch (Ch. 2)
- 10 Best AI Coding Tools 2025: Vibe Coding Tools Compared (GitHub Copilot vs Cursor) - Superframeworks Blog | Superframeworks (Ch. 2)
- AI-Generated Code Statistics 2026: Can AI Replace Your Development Team? (Ch. 2)
- China's DeepSeek Says Its Hit AI Model Cost Just $294,000 To Train - Slashdot (Ch. 2)
- DeepSeek Reveals R1 Model Training Cost Just ... (Ch. 2)
- DeepSeek didn’t really train its flagship model for $294,000 • The Register (Ch. 2)
- University Researchers Recreate DeepSeek AI Model for $30 - The AI Innovator (Ch. 2)
- Vertical SaaS & Community: The Future of B2B SaaS Demand Generation (Ch. 2, 7)
- Vista's Robert Smith on AI Revolution in Enterprise Software (Ch. 2)
- Our 20+ AI Agents and Their Moats: Real But Weak | SaaStr (Ch. 2, 4)
- The Great Transformation: How Services Firms Can Evolve into SaaS Businesses with Generative AI (Ch. 2)
- The Economics of AI-First B2B SaaS in 2026: Margins, Pricing Models, and Profitability (Ch. 2)
- The AI-centric imperative: Navigating the next software frontier (Ch. 2, 6)
- Get AI-powered customer service from US$29/mo (Ch. 2)
- Intercom's Fin AI: Understanding the Per-Resolution Pricing for 2025 - Oreate AI Blog (Ch. 2)
- Intercom Pricing 2025: What I Learned After Tracking 6 Years of Changes (2025) | SaaS Price Pulse (Ch. 2)
- The True Cost of Customer Support: 2025 Analysis Across 50 Industries (Ch. 2)
- Evolving models and monetization strategies in the new AI SaaS era | McKinsey (Ch. 2, 6, 8)
- SaaS meets AI agents: Transforming budgets, customer experience, and workforce dynamics (Ch. 2, 5, 9)
- Have AI Gross Margins Really Turned the Corner? The Real Math Behind OpenAI’s 70% Compute Margin — And Why B2B Startups Are Still Running on a Treadmill | SaaStr (Ch. 2)
- Outcomes-Based Pricing and AI-First SaaS Gross Margin Economics Explained - SoftwareSeni (Ch. 2)
- The Real Economics of SaaS versus AI Companies - The SaaS CFO (Ch. 2)
- SaaS Benchmarks: 5 Performance Benchmarks for 2026 (Ch. 2)
- Signal vs. Noise: Why Your Gross Margins Are Hemorrhaging in 2026 (The Hidden AI Tax) (Ch. 2)
- The Economics of AI-First B2B SaaS in 2026 (Ch. 2, 7)
- The Rule Of 40: How To Calculate And Use It For SaaS (Ch. 2)
- SaaS Development Services: Trends and Insights for 2026 (Ch. 2)
- AI coding is now everywhere. But not everyone is convinced. | MIT Technology Review (Ch. 2)
- AI-Generated Code Poses Major Security Risks in Nearly Half of All Development Tasks, Veracode Research Reveals (Ch. 2)
- Everyone says AI makes developers faster, but what if it’s costing you 19% more time? | by Nati Shalom | Medium (Ch. 2)
- Nvidia to Google TPU Migration 2025: The $6.32B Inference Cost Crisis (Ch. 2)
- Welcome to LLMflation - LLM inference cost is going down fast ⬇️ | Andreessen Horowitz (Ch. 2)
- Inference Unit Economics: The True Cost Per Million Tokens | Introl Blog (Ch. 2)
- DeepSeek's Low Inference Cost Explained: MoE & Strategy | IntuitionLabs (Ch. 2)
- LLM inference prices have fallen rapidly but unequally across tasks | Epoch AI (Ch. 2)
- Leading Inference Providers Cut AI Costs by up to 10x With Open Source Models on NVIDIA Blackwell | NVIDIA Blog (Ch. 2)
- 2025 SaaS Performance Metrics | Benchmarkit (Ch. 2)
- SaaS Capital AI Update for 2025 Q1 - SaaS Capital (Ch. 2)
- LLM Pricing: Top 15+ Providers Compared (Ch. 2)
- Artificial Intelligence Market Size | Industry Report, 2033 (Ch. 2)
- AI Metrics that Matter - in 2025 - SaaS Barometer Newsletter (Ch. 2)
- AI Capex 2026: The $690B Infrastructure Sprint - Futurum (Ch. 2)
- Cost Per Token Analysis | Introl Blog (Ch. 2)
- AI Capex Cycle: Can Hyperscalers Deliver Durable Returns in 2026 | Windows Forum (Ch. 2)
- Measuring the Impact of Early-2025 AI on Experienced Open-Source Developer Productivity - METR (Ch. 2)
- SaaS isn’t dead, the market is just becoming more hybrid (Ch. 3)
- The SaaSpocalypse: AI Agents Disrupting Software Industry (Ch. 3, 4)
- AI and the Next Phase of the Software Cycle (Ch. 3)
- Rise of AI means companies could pass on SaaS • The Register (Ch. 3)
- The SaaSocalypse Has Begun: AI, Pricing Collapse, and the New Rules of Financial Resilience | by Hemant Kaushik | Feb, 2026 | Medium (Ch. 3)
- No Code Is Dead - The New Stack (Ch. 3)
- 2026 Low-Code/No-Code Predictions | DEVOPSdigest (Ch. 3)
- No-Code Transformations Usage Trends — 45 Statistics Every Business Leader Should Know in 2026 | Integrate.io (Ch. 3)
- The Future of Low-Code: Trends Shaping 2026–2030! | by Nigel Tape | Jan, 2026 | Medium (Ch. 3)
- Vertical AI in 2026: The Good, The Bad, and The Ugly – VC Cafe (Ch. 3)
- Forget the data moat: The workflow is your fortress in vertical SaaS | Vendep (Ch. 3, 4)
- Procore Technologies, Inc. (PCOR): history, ownership, mission, how it works & makes money – DCFmodeling.com (Ch. 3)
- Breaking Down Procore Technologies, Inc. (PCOR): Key Insights for Investors – DCFmodeling.com (Ch. 3)
- Constellation Software 2026 Company Profile: Stock Performance & Earnings | PitchBook (Ch. 3)
- Constellation Software: Acquiring and Empowering (Ch. 3, 8)
- 1 CONSTELLATION SOFTWARE INC. MANAGEMENT’S DISCUSSION AND ANALYSIS (“MD&A”) (Ch. 3)
- Constellation Software: Deep Dive Analysis - Hated Moats (Ch. 3, 8)
- Why We’re Bullish on Vertical AI in 2025 and How These Companies Create Long-Term Value | by Elvia Perez | Medium (Ch. 3)
- AI Infrastructure: The Next Frontier for Portfolio Growth — MYJ Capital (Ch. 3)
- Artificial Intelligence (AI) In Cybersecurity Market Size 2026 ... (Ch. 3)
- Gartner Forecasts Worldwide End-User Spending on Information Security to Total $213 Billion in 2025 (Ch. 3)
- Official 2026 Cybersecurity Market Report: Predictions And Statistics (Ch. 3)
- Cyber Budgets Slow, AI Surges: What the Data Says About 2026 (Ch. 3)
- Microsoft Data Security Index 2026: AI Adoption Is Outpacing Data Security Controls (Ch. 3)
- FinancialContent - FROG Q4 Deep Dive: Security and AI Tailwinds Propel JFrog’s Software Supply Chain Platform (Ch. 3)
- FROG Q4 Deep Dive: Security and AI Tailwinds Propel JFrog’s Software Supply Chain Platform | FinancialContent (Ch. 3)
- AI, security tailwinds signal promising 2026 for Cisco | Network World (Ch. 3)
- The Great SaaS Unbundling: Why AI Will Destroy Half the Industry and Supercharge the Other Half (Ch. 3, 4)
- Predictions 2026: AI Agents, Changing Business Models, And Workplace Culture Impact Enterprise Software (Ch. 3)
- Enterprise technology 2026: 15 AI, SaaS, data, business trends to watch | Constellation Research (Ch. 3)
- Enterprise Software Faces AI-Driven Disruption as Development Productivity Gains Fail to Materialize (Ch. 3)
- Why most AI startups won’t have defensible IP by 2026 | Startups Magazine (Ch. 4)
- The Data Moat is the Only Moat: Why Proprietary Data Pipelines Define the Next Generation of AI Startups - Blog - Product Insights by Brim Labs (Ch. 4)
- Beyond the OpenAI Wrapper: 5 Ways to Build a Defensible AI Product (Ch. 4)
- The "SaaSpocalypse" Versus Real-World Moats - Align BA (Ch. 4)
- The AI Shift That Could Reshape SaaS: Switching Costs, Ramp’s Play, and the Limits of Vibe Coding (Ch. 4)
- Regulatory Compliance in 2026: Scaling Audit-Readiness with AI & Analytics (Ch. 4)
- How AI will redefine compliance, risk and governance in 2026 | Governance Intelligence (Ch. 4)
- 2026 Operational Guide to Cybersecurity, AI Governance & Emerging Risks | Corporate Compliance Insights (Ch. 4)
- 2026 Year in Preview: AI Regulatory Developments for Companies to Watch Out For | Wilson Sonsini (Ch. 4)
- AI regulatory compliance priorities financial institutions face in 2026 (Ch. 4)
- Agentic AI: Biggest Enterprise Security Threat for 2026 (Ch. 4)
- Shadow AI Threat Grows Inside Enterprises as BlackFog Research Finds 60% of Employees Would Take Risks to Meet Deadlines | BlackFog (Ch. 4)
- Shadow AI and the Growing Risk to Enterprise Security | eSecurity Planet (Ch. 4)
- Shadow AI: The Hidden Risk in Your Enterprise - Olakai (Ch. 4)
- 11 Stats About Shadow AI in 2026 - JumpCloud (Ch. 4)
- AppExchange Trends and Growth Strategies for ISVs | Synebo (Ch. 4)
- Salesforce is tightening control of its data ecosystem and CIOs may have to pay the price | CIO (Ch. 4)
- The Enterprise AI Revolution: 20 SaaS and AI Trends Redefining Corporate America in 2026 (Ch. 4)
- SaaS-pocalypse 2026: Why AI Agents Are Wiping Out $300B in Software Value (Ch. 4, 7)
- What Are the (Realistic) Margins of an AI Wrapper? – Market Clarity (Ch. 4)
- Stop calling it 'The AI bubble': It's actually multiple bubbles, each with a different expiration date | VentureBeat (Ch. 4)
- Wall Street Punishes AI Laggards as “Winners vs Losers” Emerges (Ch. 4)
- European SaaS hit by AI crosswinds as defensibility, data, discipline rule – Dealspeak EMEA - ION Analytics (Ch. 4)
- Mistral 3 vs Llama 3.1 (2026): The Open AI Stack Battle for Europe (Ch. 4)
- Why Multi-Agent Orchestration Will Define the Next Wave of AI Value | by Aleksandr Azimbaev | The Agent Protocol | Oct, 2025 | Medium (Ch. 4)
- Why 40% of Enterprises Will Face AI Disaster by 2030—And How to Stop It - CXO Chapter (Ch. 4)
- IBM Report: 13% Of Organizations Reported Breaches Of AI Models Or Applications, 97% Of Which Reported Lacking Proper AI Access Controls (Ch. 4)
- 2025 Cost of a Data Breach Report: Navigating the AI rush without sidelining security | IBM (Ch. 4)
- Gartner Identifies Critical GenAI Blind Spots That CIOs Must Urgently Address (Ch. 4)
- Salesforce AppExchange Tools Market - 2025 To 2033 Report (Ch. 4)
- Top 10 Open Source LLMs 2026: DeepSeek Revolution Guide | Articles | o-mega (Ch. 4)
- The state of open source AI models in 2025 | Red Hat Developer (Ch. 4)
- Gartner Says Worldwide AI Spending Will Total $2.5 Trillion in 2026 (Ch. 5)
- Enterprise tech spending to cross $6 trillion in 2026, driven by AI infrastructure boom – Computerworld (Ch. 5)
- AlixPartners 2026 Enterprise software technology predictions report | AlixPartners (Ch. 5)
- FinancialContent - The AI Crosshairs: Wall Street’s $1 Trillion ‘Software-mageddon’ Marks the Great Disruption Pivot (Ch. 5)
- IDC | AI & GenAI Predictions: Key Insights for 2025 and Beyond - eBook (Ch. 5)
- The AI pricing and monetization playbook - Bessemer Venture Partners (Ch. 5)
- SaaS Valuation Multiples: Understanding the New Normal - SaaS Capital (Ch. 5)
- Who Will Buy The SaaS Companies? | SaaStr (Ch. 5)
- Our 2026 Outlook: 10 AI Predictions Shaping Enterprise, Infrastructure & the Next Wave of Innovation | Sapphire Ventures (Ch. 5)
- How AI is sustainably transforming value creation in private equity (Ch. 6)
- New Diligence Challenge: Uncovering AI Risks and Opportunities | Bain & Company (Ch. 6)
- 2026 Enterprise software technology predictions report How AI will reshape (Ch. 6)
- What actually works in SaaS pricing right now (Ch. 6)
- SaaS Pricing Benchmark Study 2025: Key Insights from 100+ Companies Analyzed (Ch. 6)
- Melvine's AI Analysis # 56 - 🚀 -Vista Equity Partners' Use of AI and Generative AI — Tamarly Consulting (Ch. 6)
- Vista Equity Partners says its 'agentic factory' is reinventing the way companies use AI (Ch. 6)
- Vista’s Agentic AI Factory - Vista Equity Partners (Ch. 6)
- Beyond implementation: PE’s AI evolution into differentiated growth | EY - US (Ch. 6)
- How private equity can unlock mid-market value through AI (Ch. 6)
- Global M&A trends in technology, media and telecommunications: 2026 outlook | PwC (Ch. 6)
- Tech M&A Surges in H1 2025 | Corum Group (Ch. 6)
- M&A activity insights: December 2025 | EY - US (Ch. 6)
- The 2026 SaaS Apocalypse: Why Wall Street Is Dumping Software Stocks - AI 2 Work - AI Insights & Trends (Ch. 7)
- Why is Deployment Speed the New 2026 AI Moat? - (Ch. 7)
- SaaSpocalypse 2026: Why AI Just Wiped $285B from Software Stocks (And What Happens Next) | NxCode (Ch. 7)
- Majority of CEOs report zero payoff from AI splurge • The Register (Ch. 7)
- 56% of companies getting nothing out of AI, PwC research says; chairman blames forgetting the basics | Fortune (Ch. 7)
- 56% of CEOs See No AI ROI: PwC Survey Data & Solutions 2026 (Ch. 7)
- Why enterprise AI pilots fail and how product leaders can finally scale them (Ch. 7)
- AI’s Promise Clashes With Enterprise Reality: Executives Hold Back Billions (Ch. 7)
- The Trillion-Dollar Reckoning: How AI Threatens to Unravel Private Equity’s Massive SaaS Empire (Ch. 7, 9)
- AI's Next Casualty: The Financial Impact on Software and Data Providers (Ch. 7)
- How PE Firms Can Increase Portfolio Value as the Exit Window Reopens (Ch. 7)
- 5 Private Equity Predictions for 2026 | Brown & Brown CPA, P.C. (Ch. 7)
- Private Equity's New Exit Playbook - CFA Institute Enterprising Investor (Ch. 7)
- SaaS Roadmaps 2026: Prioritising AI Features Without Breaking Product | IT IDOL Technologies (Ch. 7)
- SaaS Predictions for 2026 Signal a Shift in Spend and Governance - Zylo (Ch. 7)
- 2026 SaaS Management Index: How AI Is Reshaping SaaS Costs (Ch. 7)
- OpenAI announces 80% price drop for o3, it's most powerful reasoning model | VentureBeat (Ch. 7)
- OpenAI O3 Model Pricing Drops 80%: What It Means for API Developers (Ch. 7)
- 2026: The year of scale or fail in enterprise AI | CIO (Ch. 7)
- McKinsey (Ch. 7)
- PwC (Ch. 7)
- CloudZero (Ch. 7)
- BusinessWire (Ch. 7)
- CIO.com (Ch. 7)
- IDC Blog (Ch. 7)
- Metronome (Ch. 7)
- LeadDev (Ch. 7)
- Gartner (Ch. 7)
- Menlo Ventures’ 2025 State of Generative AI Report: Enterprise Investment Hit $37B in 2025, Tripling in One Year - Netscape News (Ch. 7)
- Outcome-Based Pricing: The Next Frontier in SaaS? (Ch. 7)
- AI Software Cost: 2025 Enterprise Pricing Benchmarks For Manufacturing Leaders (Ch. 7)
- With 18.7% CAGR, SaaS Market Size to Surpass USD 908.21 Billion by 2030 (Ch. 8)
- The Next Generation of Workforce Management is Here--Workday Unveils New Agent System of Record (Ch. 8)
- Workday's Eschenbach Defends AI Tailwind as Stock Lags Davos Optimism (Ch. 8)
- Workday Launches Global AI Agent Network And Gateway - Soramidjourney.com (Ch. 8)
- Workday Rising 2025: How Workday Is Shaping the Future of AI, Agents, and SMB Growth - SMB Group (Ch. 8)
- Salesforce Delivers Record Third Quarter Fiscal 2026 Results Driven by Agentforce & Data 360 - Salesforce (Ch. 8)
- Salesforce beats on earnings, issues better-than-expected revenue forecast (Ch. 8)
- Salesforce.com, Inc. - Salesforce Delivers Record Third Quarter Fiscal 2026 Results Driven by Agentforce & Data 360 (Ch. 8)
- Revisiting the Bullish Case for Agentforce in 2026 | Salesforce Ben (Ch. 8)
- Salesforce Q3 FY 2026: AI Agents, Data 360 Lift Bookings and FY26 Outlook (Ch. 8)
- SAP AI Agents in 2026: Joule Studio Features & Case Studies (Ch. 8)
- SAP Business AI: Release Highlights Q4 2025 | SAP News Center (Ch. 8)
- New Joule Agents and Embedded Intelligence Supercharge Business Returns Across the Enterprise (Ch. 8)
- ServiceNow Q4 FY 2025 Earnings Highlight AI Platform Momentum - Futurum (Ch. 8)
- What’s Next for AI in 2026 - Workflow™ (Ch. 8)
- The AI Engine of the Enterprise: Why ServiceNow is the Stock to Watch for 2026 | FinancialContent (Ch. 8)
- Constellation Software’s AI Strategy: Analysis of Dominance in Software AI - Klover.ai (Ch. 8)
- Constellation Software's Strategic Positioning in the AI-Driven Software Market: Unlocking Value in Niche SaaS Sectors (Ch. 8)
- How Does Constellation Software Company Work? – PortersFiveForce.com (Ch. 8)
- The AI TAM Expansion Opportunity - by Tanay Jaipuria (Ch. 8)
- SaaS M&A Report: Q4 2025 N O V E M B E R 2 0 2 5 W I N D S O R D R A K E (Ch. 8)
- Software As A Service Market Size | Industry Report, 2030 (Ch. 8)
- Software as a Service - Worldwide | Market Forecast (Ch. 8)
- Workday CEO calls narrative that AI is killing software 'overblown' (Ch. 8)
- CNBC Excerpts: CNBC Broadcasts Live from Davos, Switzerland Today, Thursday, January 22 (Ch. 8)
- Workday’s CEO is stepping down as its cofounder resumes the job (Ch. 8)
- Workday CEO Eschenbach Out After Stock Drops 47% From Peak, Co-Founder Bhusri Returns | Fintool News (Ch. 8)
- Workday Cuts 400 Jobs as Software Stocks... (Ch. 8)
- FinancialContent - Dear Salesforce Stock Fans, Mark Your Calendars for February 25 (Ch. 8)
- ServiceNow Investor Relations — ServiceNow Reports Fourth Quarter and Full-Year 2025 Financial Results; Board of Directors Authorizes Additional $5B for Share Repurchase Program (Ch. 8)
- ServiceNow (NOW) Q4 2025 earnings report (Ch. 8)
- MLQ.ai | AI for investors (Ch. 8)
- ServiceNow (NOW) Investor Relations, Earnings Summary & Outlook (Ch. 8)
- Field Notes from the Generative AI Insurgency in Private Equity | Bain & Company (Ch. 8)
- Vista Equity Partners Names Winners of Agentic AI Hackathons | Morningstar (Ch. 8)
- Vista Equity Partners Names Winners of Agentic AI Hackathons - Vista Equity Partners (Ch. 8)
- Vista Equity sells stake in LogicMonitor at a big gain in valuation - PitchBook (Ch. 8)
- Top 10 SaaStr AI Predictions for 2026 (Ch. 8)
- 2026 PE Outlook: AI, Capital Cycles, and the Return of Deal Flow - PE Alpha (Ch. 8)
- The "SaaSpocalypse" Versus Real-World Moats - Align BA (Ch. 9)
- Rule of 40 Redefined: 2026 SaaS Finance Framework | Abacum (Ch. 9)
- Growth, Profitability, and the “Rule of 40” for Private SaaS Companies - SaaS Capital (Ch. 9)
- SaaS Trends 2025-2026: 25 Definitive Trends Shaping the Industry | Modall - Modall (Ch. 9)
- Gartner: CIOs Navigate Change as AI Agents Redefine SaaS Pricing - InfotechLead (Ch. 9)
- B2B SaaS Growth in 2026: 5 Lessons for B2B Startups - B2B Marketing Insights | Big Moves Marketing (Ch. 9)
- Where AI is Headed in 2026 | Foundation Capital (Ch. 9)
- 2026 AI Business Predictions | PwC (Ch. 9)
- The Rule of 40 | Software Equity Group (Ch. 9)
Footnotes
-
Aligned with Chapter 1 data: The S&P 500 Software & Services index shed approximately $1 trillion since January 28, 2026; J.P. Morgan strategists estimated ~$2 trillion in cumulative market cap losses from the sector's peak, characterizing it as "the largest non-recessionary 12-month drawdown in over 30 years (-34%)." ↩ ↩2
-
The claim that approximately 70% of software providers face AI-related profitability pressure has appeared in industry commentary (AI 2 Work, February 2026) but lacks a named primary survey source. CloudZero's data on surging AI spend and PwC's finding that 56% of companies see no ROI corroborate the directional conclusion even if the specific percentage cannot be independently verified. ↩
-
Historical SaaS multiples (2021 H2: 26.1x, 2022 H2 peak: 39.9x) are sourced from Aventis Advisors' software valuation multiples database, as cited in Chapter 1. The H2 2022 figure of 39.9x represents the peak of the cycle and should be understood in the context of the broader data set; cross-reference with Chapter 1's valuation tables for full context. ↩