European Tech-Enabled Business Services (TEBS): The Buy-and-Build Consolidation Map — 2026 Edition
An investment-grade consolidation map for mid-market PE — 15 sub-sector modules, cross-sector rankings, diligence toolkits, and platform thesis templates
European Tech-Enabled Business Services (TEBS): The Buy-and-Build Consolidation Map — 2026 Edition
Executive Summary (2026 Edition)
This report provides an investment-grade consolidation map for European Tech-Enabled Business Services (TEBS), tailored to mid-market private equity investors pursuing buy-and-build strategies. It is designed to be used in three moments of truth: (i) sector and geography screening, (ii) diligence and downside protection, and (iii) platform design (bolt-on sequencing, centralisation choices, and exit narrative construction). Across Europe, TEBS remains a dominant mid-market theme into 2026 as PE activity expectations rise in technology and business services and as buy-and-build continues to be the default execution model.
Chapter 1 — What TEBS is (and why it matters for multiples)
The report defines TEBS as service businesses where technology is a material driver of delivery efficiency, workflow embedding, data leverage, and/or revenue quality—without being pure SaaS. Two framing tools govern the entire analysis:
- Services-to-software continuum: TEBS value accretes as businesses move rightward—from labour-linear delivery toward workflow-embedded, recurring, low marginal cost models.
- Buy-and-build–ready sub-sector definition: attractive roll-up arenas combine fragmentation, standardisable operations, repeatable integration, resilient demand, and centralisation capacity.
A core underwriting distinction is made between:
- Multiple expansion through tech (tech changes unit economics and switching costs), versus
- Labour-driven scale (headcount + SG&A consolidation with limited re-rating potential).
Chapter 2 — Market structure and what separates 6× from 12× EBITDA
Using a disciplined “gross TAM vs TEBS-eligible TAM” construct, the report sizes European TEBS-eligible revenues at ~€350–450B (2025E) after adjusting for definitional eligibility and overlap. The key conclusion is that the investable TEBS perimeter is large enough to support many platforms, but narrow enough that definition discipline (what is truly tech-enabled) is a recurring source of alpha.
Three mandatory cross-sector exhibits drive screening:
- Services-to-software map: near-software positioning is most evident in Data & Analytics, Fund Administration, and workflow-embedded Insurance distribution; labour-heavy segments (e.g., Facilities, Staffing) sit leftward unless deliberately productised.
- Fragmentation × tech leverage matrix: the “sweet spot” combines high fragmentation with credible tech leverage (e.g., IT MSPs, Compliance, Data & Analytics, Insurance brokerage segments).
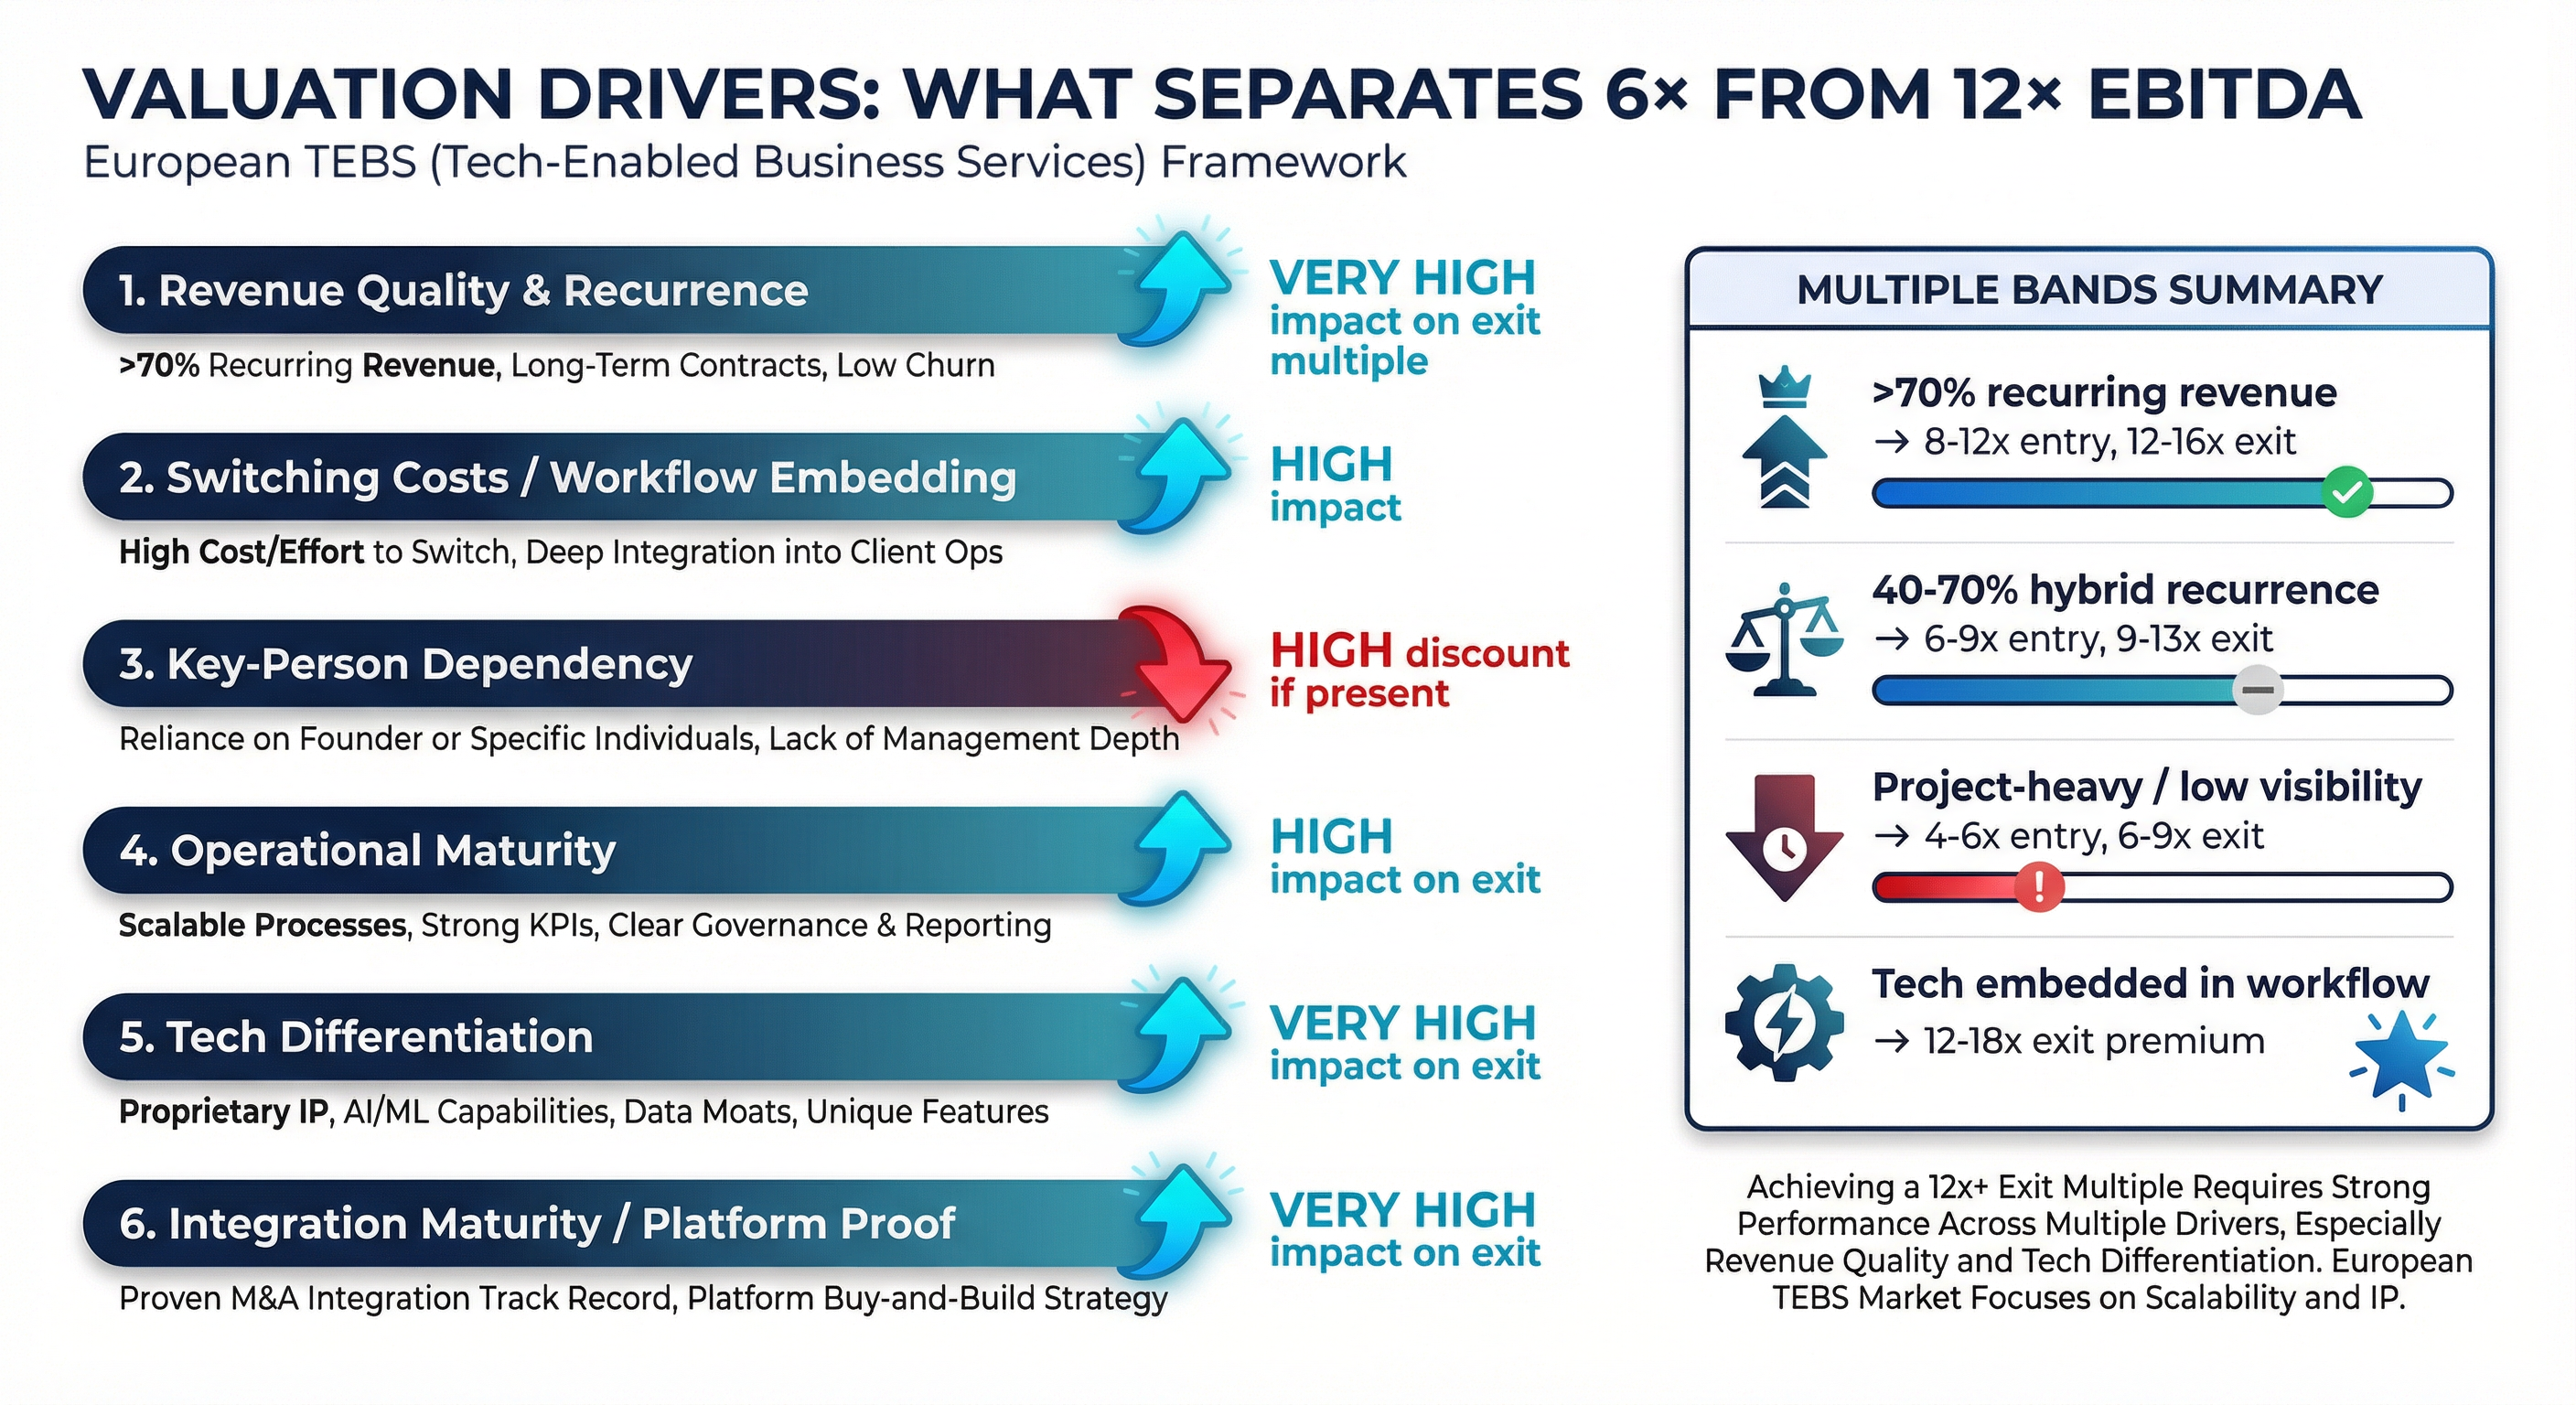
- 6× vs 12× driver framework: multiples are primarily shaped by recurrence, workflow switching costs, key-person dependency resolution, operational maturity, tech differentiation, and platform proof—with dispersion within sub-sectors often larger than between sub-sectors.
Chapters 3–5 — Sub-sector modules: where consolidation works (and why it fails)
Fifteen modules apply one consistent template (definition, size/fragmentation, target profile, buy-and-build attractiveness, tech levers, playbook, buyer landscape, failure modes). Key takeaways by cluster:
-
Top-tier “multiple-forming” roll-ups:
- IT Managed Services (MSPs): recurring revenue + automation + security attach create a repeatable integration and re-rating pathway—but tool-stack standardisation and talent scarcity are critical risks.
- Insurance Brokerage & Distribution: renewal-led recurrence, deep bolt-on density, and data-enabled cross-sell support the most consistent buy-and-build return profile; producer retention is the central diligence item.
- Compliance/Regulatory services: strong productisation potential; value creation hinges on converting projects to monitoring subscriptions and building workflow portals (avoid “portal as file dump” risk).
- Fund Administration / Financial back office: high switching costs and automation potential; integration risk concentrates in platform migrations and control environments.
- Data & Analytics services: highest tech ceiling, but also highest execution dispersion; winners institutionalise IP reuse, managed “run” contracts, and delivery standardisation.
-
Moat plays with slower tempo:
- TIC: accreditation provides defensibility and pricing power; integration must protect quality systems and capex discipline.
- Healthcare groups: extreme fragmentation and real procurement/scheduling synergies, but integration is fundamentally about clinical governance and clinician retention (not just systems).
-
Operational-alpha / density plays:
- Facilities management, staffing, engineering consulting, logistics control-tower models, environmental consulting, education/training can produce strong outcomes when underwritten as density + procurement + utilisation + contract repricing plays; tech is additive but rarely the primary multiple driver unless workflow embedding is demonstrably achieved.
-
Thesis-dependent / higher failure-rate roll-ups:
- Marketing/digital agencies (integration complexity + in-housing + AI content commoditisation) and Legal/LPO (AI substitution risk) require an explicit repositioning thesis toward managed services, outcomes pricing, and workflow embedding.
Chapter 6 — Consolidation map, rankings, and 2026–2028 white spaces
The report consolidates module scoring into a ranked map and groups sectors into four investable archetypes. The leading base-case sub-sectors are Insurance Brokerage and IT MSPs (both 4.3/5), followed by Compliance (4.0), Fund Admin (3.9), and Data & Analytics (3.8). The chapter also identifies white spaces by region (notably DACH and Southern Europe in selected verticals) and introduces the emerging AI services layer: TEBS firms increasingly act as the “AI distributor” for mid-market clients (implementation, governance, and managed operations), which strengthens the exit narrative when backed by usage and productivity evidence.
Chapter 7 — Buyer landscape and deal mechanics
Four buyer archetypes shape processes—software-native PE, services specialists, generalist mid-market funds, and strategics—each paying up for different attributes. Winning auctions in 2026+ requires (i) a credible 100-day integration plan presented early, (ii) clear centralise-vs-federate intent, and (iii) proof that “tech” moves unit economics (not AI theatre). The chapter provides IC-ready platform thesis templates (recurring tech-enabler, distribution compounder, density play, IP-led platform) and a practical exit readiness scorecard aligned to recurrence, integration proof, and tech defensibility.
Chapter 8 — Diligence toolkit, integration playbook, AI matrix, and outlook
The capstone provides deal-team-ready tools: a TEBS diligence checklist, a 100-day integration plan, an integration risk heatmap, and an AI impact matrix across all 15 sub-sectors. The AI conclusion is nuanced: most TEBS is structurally helped (augmentation), while Marketing/Agencies and parts of Legal/LPO face genuine substitution risk unless repositioned. The outlook emphasises consolidation acceleration in cyber-MSP, broker consolidation, alternatives operations platforms, and ESG/CSRD-related reporting ecosystems—tempered by persistent labour constraints in clinician- and engineer-heavy models.
Key Recommendations (IC-usable)
- Prioritise platform creation in five sub-sectors: Insurance brokerage, IT MSPs, compliance/regulatory services, fund administration, and data & analytics—where recurrence and workflow embedding most reliably convert into exit multiples.
- Underwrite “platform proof,” not just scale: require early evidence of KPI standardisation, tool-stack governance, and repeatable bolt-on integration cadence.
- Adopt the dominant integration model: centralise governance (finance, compliance, data, procurement, tooling rules) on Day 1; federate client relationships initially to protect retention.
- Treat AI as a value-capture mechanism, not a narrative: invest only where adoption and unit-economics uplift can be measured; avoid “AI theatre” via strict governance and before/after KPI proof.
- In labour-heavy sectors, underwrite operational alpha first: density, scheduling, procurement, and contract repricing should carry the base case; tech-enabled re-rating is upside, not the plan.
Chapter 1: Scope, Definitions, and Analytical Framework (How to Read and Use This Report)
1.1 Purpose and Intended Use
This report is a capital allocation and value-creation tool for mid-market private equity professionals evaluating buy-and-build opportunities across European Tech-Enabled Business Services (TEBS). It is designed to be used at three stages of the investment lifecycle: screening (which sub-sectors and geographies to prioritize), diligence (what to probe and what signals matter), and platform design (how to sequence bolt-ons, centralize operations, and construct an exit narrative).
The methodology in this chapter establishes the definitions, scoring rubrics, and analytical lenses that will be applied consistently across all 15 sub-sector modules (Chapters 3–5), the cross-sector synthesis (Chapter 6), buyer and deal mechanics analysis (Chapter 7), and the diligence and outlook toolkit (Chapter 8). Every claim in subsequent chapters is benchmarked against the frameworks defined here.
The market context is favorable. In the Roland Berger European PE Outlook, respondents expect Technology, software & digital solutions (69%) and Business services & logistics (68%) to see the highest number of PE M&A transactions in 2026. Deal commentary into 2026 also highlights an acceleration of mid-market buy-and-build strategies (smaller, complementary acquisitions to drive scale, synergies, and capability build). This report exists to help investment committees decide where within that broad thesis to deploy capital—and how to win.
Teaser (without premature ranking): Based on the framework defined in Sections 1.5–1.7, the report expects several sub-sectors to repeatedly screen well in the “Quadrant I” shape (high tech leverage, low integration complexity, high fragmentation)—often including IT managed services (MSPs), select TIC / compliance-led services, and workflow-embedded brokerage/administration models (examples only; final scoring is provided in Chapter 6).
Key assumptions (for how to interpret outputs)
| Assumption | Why it matters | Where it is used |
|---|---|---|
| Comparable multiple environment: H1-2025 mid-market multiple levels and dispersion are treated as the baseline reference for 2026 screening | Prevents false precision; keeps valuation discussion anchored to observable recent data | Chapters 2, 6–7; underwriting ranges |
| Tech enablement is measurable through unit-economics change (not “tooling presence”) | Avoids “tech-washing”; aligns screening with value creation reality | All sub-sector modules |
| Buy-and-build repeatability is a core determinant of attractiveness | Ensures sub-sector ranking reflects integration feasibility, not just market growth | Chapters 3–6 |
| Interview insights are directional, not statistical | Prevents overgeneralizing from expert samples | Sections 1.4–1.6; used for hypothesis shaping |
1.2 Core Definitions
1.2.1 Tech-Enabled Business Services (TEBS)
Definition: TEBS comprises services businesses where technology is a material driver of delivery efficiency, workflow embedding, data leverage, and/or revenue model quality—without the company being a pure software product company. The service is the core commercial offer; technology amplifies the margin, stickiness, and scalability of that service.
A company qualifies as “tech-enabled” when at least one of the following conditions is demonstrable:
- Delivery efficiency: Technology (workflow tools, automation, analytics) allows the company to deliver the same or better service output with materially fewer labor hours per unit of revenue than a non-tech-enabled peer.
- Workflow embedding: The company’s technology is integrated into the client’s daily operations (e.g., portals, monitoring dashboards, compliance platforms), creating switching costs that go beyond contractual lock-in.
- Data leverage: The company accumulates proprietary data through service delivery (benchmarking, risk scoring, performance analytics) that enhances its value proposition and can create network effects.
- Revenue model quality: Technology enables a shift from purely project-based billing toward recurring, subscription-like, or usage-based revenue streams with contractual visibility.
What TEBS is not: Pure SaaS companies selling licenses with no service component. Legacy labor-only services with cosmetic technology wrappers (e.g., a staffing firm with a basic ATS relabeled as “AI-powered”). Companies where technology is an internal support function but does not materially affect client-facing delivery or margin structure.
Why it matters for PE: As AI and automation increasingly shift support functions from “cost centres” toward “performance centres,” the investable surface area for tech-enabled services expands—but only where tech changes delivery economics and customer lock-in. TEBS businesses sit at the intersection of this transformation, offering the downside protection of contracted services revenue with the upside optionality of technology-driven margin expansion and multiple re-rating.
1.2.2 The Services-to-Software Continuum
The services-to-software continuum is the spectrum along which business services companies are positioned, from pure labor delivery at one end to fully productized software at the other. Most TEBS targets occupy the middle ground, and their exact position has direct implications for entry multiple, margin trajectory, and exit narrative.
Positioning criteria (scored 1–5 for each target or sub-sector):
| Criterion | 1 (Pure Service) | 3 (Hybrid) | 5 (Near-Software) |
|---|---|---|---|
| Recurring revenue % | <20% | 40–60% | >80% |
| Software/workflow penetration | None; delivery is manual | Proprietary tools used internally to improve delivery | Client-facing platform; self-serve elements |
| Data/network effects | None | Some proprietary data informs service quality | Strong data moat; improves with scale |
| Delivery labor intensity | Revenue scales linearly with headcount | Partial automation; leverage on select functions | Minimal marginal labor per incremental unit of revenue |
| Client switching costs | Low; relationship-based only | Moderate; some integration/training required | High; embedded in workflow; data migration painful |
A sub-sector’s position on this continuum is not static. A central TEBS private equity thesis is to move a portfolio company rightward on the continuum during the hold period—increasing recurring revenue, deepening workflow embedding, and building data assets—thereby justifying a higher exit multiple.
1.2.3 Buy-and-Build–Ready Sub-Sector
Definition: A sub-sector is “buy-and-build–ready” when the following minimum conditions are met:
- Fragmentation: The top 5 players hold less than 25% market share in the target geography, with a dense long tail of acquisition candidates at €1–15M revenue.
- Standardizable operations: Core service delivery can be codified into repeatable processes, allowing centralized training, quality control, and back-office consolidation.
- Repeatable integration: Bolt-on acquisitions follow a predictable playbook (e.g., financial integration within 60 days, systems migration within 6 months, commercial harmonization within 12 months).
- Ability to centralize/enforce playbook: A platform can extract value through shared services (finance, HR, procurement, IT), centralized pricing, and standardized reporting without destroying local client relationships.
- Resilient demand: The underlying service addresses a non-discretionary or structurally growing client need (e.g., compliance, IT infrastructure, healthcare, building maintenance) with low cyclicality relative to GDP.
With elevated entry multiples for platform investments, sponsors have leaned further into buy-and-build strategies (particularly in the mid-market), using add-ons as a core mechanism to compound value creation.
1.2.4 Standalone definition: “Multiple Expansion Through Tech” vs. “Labor-Driven Scale”
These are two distinct value-creation models that can look superficially similar in an investment memo (“we will professionalize, consolidate, and grow”) but underwrite to different outcomes.
Multiple expansion through tech (definition): A value-creation model where technology meaningfully improves delivery unit economics and customer switching costs, shifting the business rightward on the services-to-software continuum—and enabling a credible exit as a “technology-powered platform,” not merely a larger services consolidator.
Labor-driven scale (definition): A value-creation model where growth and EBITDA expansion primarily come from adding people, expanding footprint, and consolidating SG&A—without a step-change in delivery unit economics or workflow embedding. The exit narrative is predominantly “scaled services group.”
1.2.5 Diagnostic indicators (how to tell which model you are underwriting)
Multiple Expansion Through Tech — Diagnostic Indicators:
- Gross margins expand by ≥300 bps within ~24 months of technology investment (automation, workflow tools, analytics).
- Revenue per employee grows faster than headcount.
- Recurring or contract-based revenue share increases (e.g., from ~35% to 55%+).
- Client-facing technology creates switching costs observable in retention metrics (e.g., net revenue retention ≥95% where NRR is applicable).
- At exit, the business can credibly be positioned as a “technology-powered platform,” which is where higher valuation ranges are more frequently observed in market evidence.
Labor-Driven Scale — Diagnostic Indicators:
- Revenue growth requires near-proportional headcount growth.
- Gross margins remain broadly stable (no operating leverage from technology).
- Key-person dependency persists at the delivery level.
- Bolt-ons primarily add revenue and geographic coverage, but do not change delivery unit economics.
- Exit multiple remains in the services band (typically lower than tech-enabled outcomes), consistent with observed services-heavy valuation ranges.
Valuation linkage (evidence anchor): European mid-market M&A multiples in 2025 vary materially by sector and quality; market monitors show a broad band in which technology-adjacent assets typically clear higher ranges than traditional services. This report’s screening question is therefore explicit: Does technology change the unit economics of delivery and switching costs—or does it merely support the back office?
1.3 Geographic Scope and Segmentation
Covered Regions
This report covers six European country clusters:
| Cluster | Countries | Rationale |
|---|---|---|
| UK & Ireland | UK, Ireland | Largest single-country PE market in Europe; English-language; high services GDP share |
| Nordics | Sweden, Norway, Denmark, Finland | High digital maturity; dense PE activity; buy-and-build culture |
| DACH | Germany, Austria, Switzerland | Mittelstand fragmentation; largest continental economy; strong industrial services base |
| Benelux | Netherlands, Belgium, Luxembourg | Open economies; headquarters density; cross-border operating norms |
| France | France | Large market; distinct dynamics; recent political uncertainty affecting deal flow |
| Southern Europe | Spain, Italy, Portugal, Greece | Growing PE activity; lower multiples; fragmentation opportunity |
Roland Berger’s outlook indicates Central and Eastern Europe (CEE) is expected to see one of the strongest gains in momentum by region (with DACH and Nordics also highlighted). While CEE is not a primary focus region in this report, it is referenced as a nearshoring and expansion destination where relevant to TEBS platform strategies.
Comparability Approach
- Currency: All financials are expressed in euros (€). UK figures are converted using the prevailing GBP/EUR rate as of Q4 2025 (approximately £1 = €1.14, directional). Swiss franc figures are converted at CHF/EUR ~0.95 (directional, period-typical). Nordics are converted at prevailing SEK, NOK, and DKK rates.
- Normalization: EBITDA margins, multiples, and growth rates are reported on a pre-IFRS 16 basis where possible to maintain comparability with private company financials. Where only post-IFRS 16 data is available, the adjustment is noted.
- Size segmentation: “Mid-market” in this report refers to enterprise values of €20M–€500M for platform investments and €2M–€50M for bolt-on acquisitions. Revenue ranges for targets are stated at the sub-sector level.
1.4 Sources, Evidence Standards, and Limitations
Data Stack
This report triangulates findings from multiple source layers:
- Deal databases / market monitors: Deal volumes and mid-market valuation observations are triangulated across databases and mid-market publications (PitchBook, Mergermarket, Unquote, S&P Capital IQ) and mid-market monitors such as Dealsuite. Dealsuite reports an H1-2025 average European EBITDA multiple of ~5.3×, with dispersion by region (e.g., DACH, France, Netherlands as reported).
- Public company comps: Listed European comparables are used as benchmarks for margin structure, growth, and valuation logic (e.g., Adecco, Bureau Veritas, Capita, Homeserve, Halma).
- Broker and advisor reports: M&A advisor intelligence is used for observed activity levels and sector mix. RSM reports advising on 768 completed deals in 2025, with sector breakdown including engineering & manufacturing (156), business services (152), and TMT (146).
- Industry benchmarks: Sector reports from IBISWorld, Eurostat, national statistics offices, and trade associations are used for market sizing, fragmentation analysis, and labor market context.
- Interview program (target personas): Analytical conclusions are informed by structured interviews with PE operating partners (N=25+), TEBS platform CEOs (N=15+), M&A advisors specializing in business services (N=10+), and technology consultants supporting PE portfolio companies (N=10+). Interviews are used to generate and stress-test hypotheses; they are not treated as statistical evidence.
- Web-scraped proxies: Job posting density (Indeed, LinkedIn) as a proxy for labor market tightness and company growth trajectories; pricing pages and service descriptions as proxies for technology maturity; review sites (e.g., Trustpilot, G2) for quality benchmarking.
- Triangulation logic: No single data point is taken at face value. Market sizes are expressed as ranges with stated methodology. Multiples are benchmarked against at least two independent sources where possible. Qualitative claims are tested against multiple evidence types (deal evidence, public-company analogies, and/or expert input).
Evidence standards (what “good” looks like in this report)
- Quantified claim = cited claim: Any percentage, multiple, deal count, or region-by-region numeric statement is accompanied by an inline citation (e.g.,,,).
- Directional claim = anchored claim: Macro or thematic statements (e.g., “buy-and-build is gaining traction”) are anchored to reputable commentary and/or market monitors.
- No false precision: When sources provide ranges or averages, the report uses ranges/approximations (e.g., “~5.3×”) rather than implying exactness.
Limitations and explicit assumptions (expanded)
- Multiple persistence assumption (2025 → 2026): Where the report references 2025 mid-market multiple levels and dispersion (e.g., Dealsuite H1-2025), it uses them as a baseline reference frame for 2026 screening rather than a forecast. The implicit assumption is that relative dispersion by sector quality (tech-enabled vs labor-driven) remains directionally informative into 2026, even if absolute levels move with rates and risk appetite.
- Database coverage bias: Mid-market deal databases and monitors can under-represent smaller proprietary transactions and may reflect reporting bias by geography and advisor ecosystem density. Conclusions are therefore triangulated with advisor reports and interviews.
- Interview representativeness: The interview sample is intentionally skewed toward active PE value-creation and M&A practitioners; it is not representative of the full universe of TEBS operators. Interview insights are treated as hypothesis-generating and are validated against market evidence where feasible.
- FX comparability: GBP/EUR and other conversion rates are used for readability and comparison, not for hedging, treasury, or forecasting. The report uses a Q4-2025 directional GBP/EUR reference (~1.14) and does not model FX sensitivity unless material to a case.
- Accounting normalization: Private company EBITDA definitions vary (owner add-backs, capitalization policies, IFRS 16 treatment). The report flags comparability issues where known and avoids over-weighting single-point EBITDA margin comparisons.
- Regulatory and labor nuance: The report does not perform jurisdiction-by-jurisdiction legal analyses; regulatory references are included only when they materially affect fragmentation, switching costs, pricing power, labor supply, or integration feasibility (i.e., core underwriting variables).
What This Report Will NOT Do
- No compliance-heavy regulatory deep dives. Regulation is mentioned only where it directly and materially affects fragmentation, scalability, labor availability, pricing power, or barriers to entry.
- No false precision on market sizing. TAM figures are directional ranges with stated assumptions, not spuriously precise numbers.
- No AI hype. AI is assessed as a strategic lever with specific EBITDA-impact pathways; claims are subjected to evidence tests. Chapter 8 includes an AI impact matrix distinguishing structural help, structural threat, and neutrality by sub-sector.
1.5 Core Analytical Framework
The following four-pillar framework is applied to every sub-sector analysis in Chapters 3–5 and informs the cross-sector synthesis in Chapter 6.
1.5.1 Fragmentation and Bolt-On Density
How measured:
- CR5 (Concentration Ratio of top 5 firms) in the relevant geography: <25% = highly fragmented; 25–50% = moderately fragmented; >50% = concentrated.
- Bolt-on density: Estimated number of acquisition candidates at €1–15M revenue within the target geography, normalized per €1B of addressable market. A density of >30 candidates per €1B TAM is rated “high.”
- Founder/owner-operator share: Percentage of target-sized businesses that are founder-owned, family-owned, or nearing generational transition. Higher share = greater pipeline of motivated sellers.
What “good” looks like: CR5 <20%, bolt-on density >40 per €1B TAM, >60% founder-owned in the target size range. These conditions create a structurally favorable environment for buy-and-build.
1.5.2 Margin Expansion Levers Taxonomy
Every TEBS sub-sector has a specific set of margin expansion levers. We categorize them into eight types and assess applicability for each sub-sector on a 1–5 scale:
| Lever | Description | Where It Works Best |
|---|---|---|
| Pricing | Shifting from hourly/project billing to value-based, subscription, or retainer pricing | Advisory, TIC, compliance services |
| Utilization | Increasing billable hours as a % of total hours through better scheduling, demand forecasting, and bench management | Staffing, consulting, engineering |
| Procurement | Centralizing purchasing of materials, subcontractors, licenses, and tools across the platform | Facilities management, IT MSP, dental/vet |
| Delivery automation | Replacing manual process steps with software, RPA, or AI-assisted workflows | Back-office services, legal process, data analytics |
| Near/offshoring | Moving lower-value-add delivery steps to lower-cost geographies | IT services, marketing, legal process |
| Shared services | Centralizing finance, HR, IT, and compliance functions across the platform | All sub-sectors (universal lever) |
| Vendor consolidation | Reducing tool and vendor sprawl across acquired entities | IT MSP, marketing services, facilities |
| SKU rationalization | Simplifying and standardizing the service offering portfolio | Marketing agencies, engineering consulting |
1.5.3 Scalability Without Proportional Labor Growth
This pillar measures whether a business can grow revenue without a linear increase in headcount—the defining characteristic that separates tech-enabled services from traditional services.
Signals (scored 1–5):
- Automation rate: Percentage of delivery steps that are fully or partially automated. >30% = strong.
- Span of control: Average number of direct reports per manager. Improving span of control without quality degradation indicates operational leverage.
- Tooling adoption: Percentage of delivery staff actively using proprietary or standardized workflow tools. >80% = strong.
- Workflow standardization: Degree to which service delivery follows documented, repeatable processes (vs. bespoke, consultant-dependent approaches).
- Revenue per FTE growth: Target of >5% annual growth in revenue per FTE (inflation-adjusted) as a baseline indicator of operational leverage.
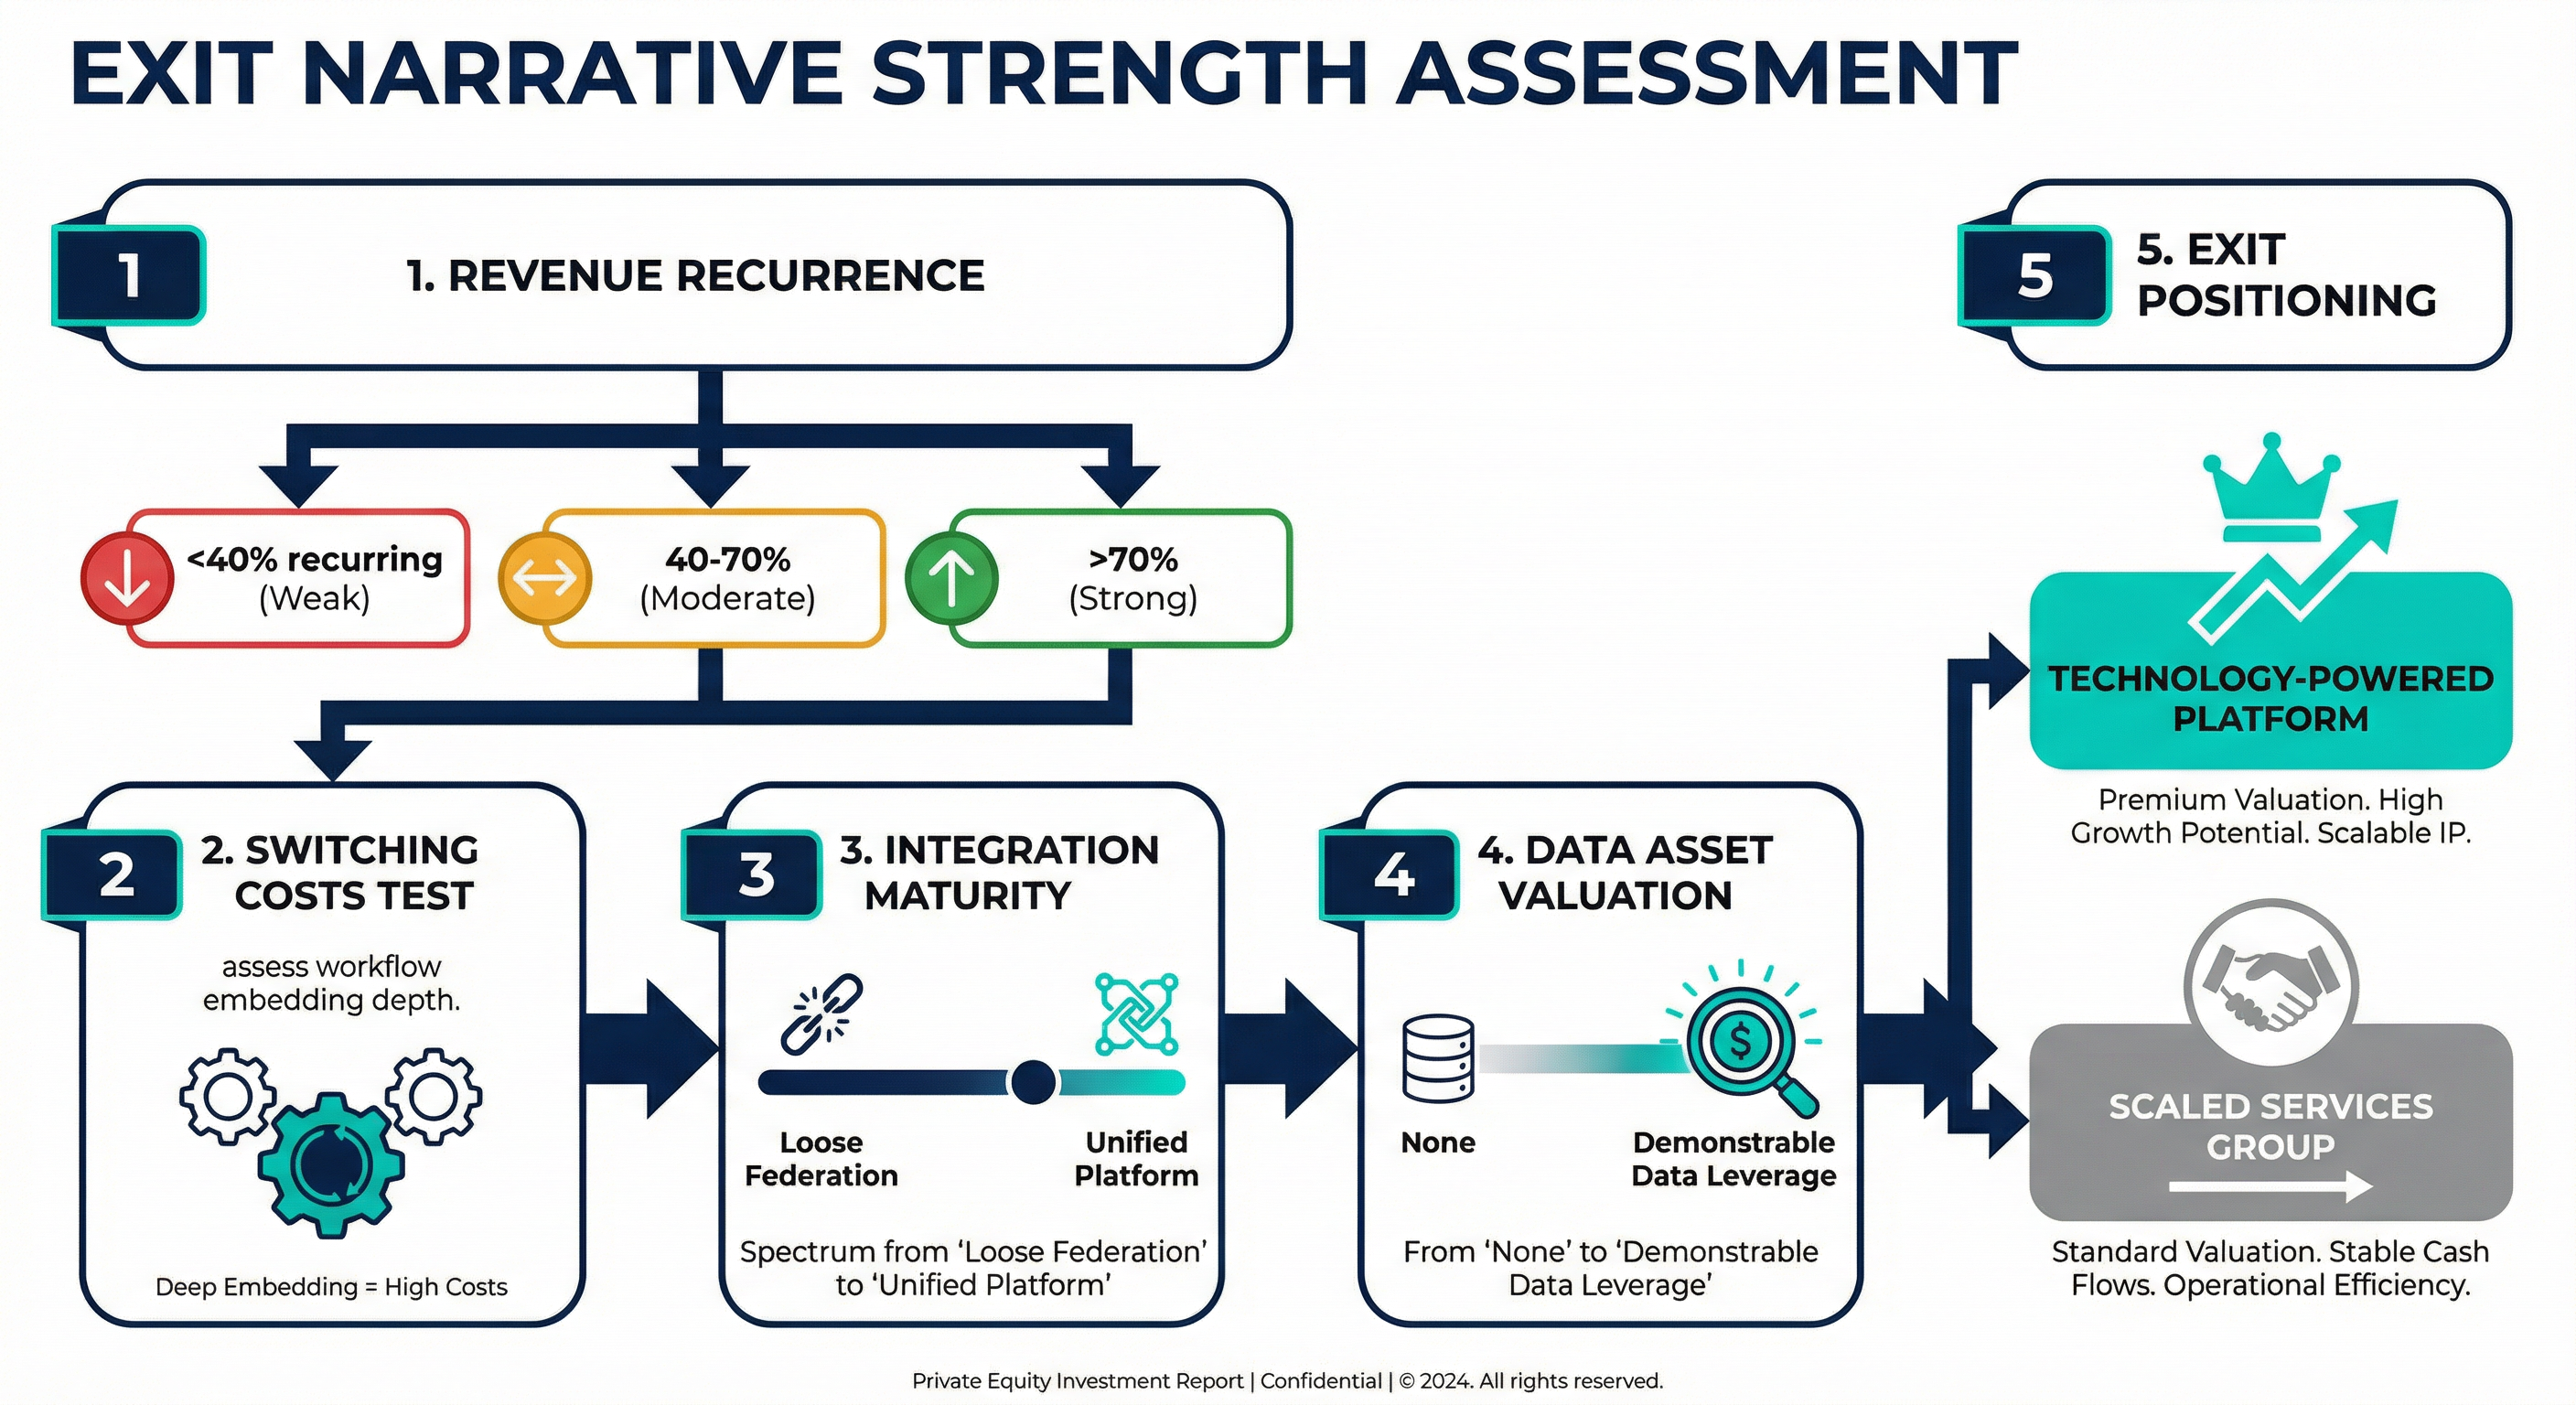
1.5.4 Exit Narrative Strength
Buyers pay premium multiples for durability and downside protection in uncertain macro conditions. The more an acquirer pays at entry, the greater its need to deliver material operational value creation; at exit, the story must resonate with the next buyer’s underwriting criteria.
What buyers reward in 2026+ (each scored 1–5):
- Recurrence: >70% of revenue is recurring or contracted.
- Defensibility: Switching costs, regulatory moats, proprietary data, or embedded workflows reduce churn structurally (e.g., <5% gross revenue churn annually where meaningful).
- Data assets: Proprietary datasets that improve with scale and are demonstrably used in delivery or client-facing analytics.
- Integration maturity: Unified tech stack, shared KPI dashboard, standardized commercial processes.
- Platform density: ≥5 bolt-ons with demonstrable synergy realization and repeatable integration capability.
1.6 Deliverable Templates and Scoring Rubric
1.6.1 Sub-Sector Module Template (Headings A–H)
Every sub-sector module in Chapters 3–5 follows this identical structure:
| Section | Content | Purpose |
|---|---|---|
| A. Definition & Scope | What’s in/out; where “tech-enabled” shows up in practice | Boundary-setting for screening |
| B. Market Size, Growth, Fragmentation | TAM (range), CAGR, CR5, bolt-on density, cross-border variation | Investment opportunity sizing |
| C. Typical Target Profile | Revenue range, margin profile, ownership type, geographic footprint | Target identification |
| D. Buy-and-Build Attractiveness | Fragmentation, bolt-on density, integration complexity, standardization potential | Thesis viability assessment |
| E. Technology Levers | Core systems, automation, data/AI; tie to EBITDA and scalability | Value creation scoping |
| F. Value Creation Playbook | Centralization, pricing, cross-sell/upsell; sequencing (0–12, 12–36 months) | Post-close planning |
| G. Buyer Landscape | Active PE archetypes, strategics, entry/exit dynamics | Competitive positioning |
| H. Red Flags & Failure Modes | Integration mistakes, margin illusions, key-person risk, churn triggers | Risk mitigation |
Each module also includes a mandatory per-sub-sector table with four fields:
- Target Signal Checklist: 8–12 observable screening signals.
- Core KPIs: 6–10 diligence and operating metrics.
- Margin Expansion Levers: Applicable levers (Section 1.5.2) with estimated EBITDA impact ranges (bps), explicitly labeled as estimates.
- Technology Maturity Benchmarks: Best-in-class vs lagging stacks with adoption indicators.
1.6.2 Buy-and-Build Attractiveness Scoring Model
Each sub-sector is scored on six dimensions using a 1–5 scale (5 = most attractive). The composite score is a weighted average.
| Dimension | Weight | 1 (Least Attractive) | 3 (Moderate) | 5 (Most Attractive) |
|---|---|---|---|---|
| Fragmentation | 20% | CR5 >50%; few targets | CR5 25–50% | CR5 <20%; dense long tail |
| Integration Complexity | 20% | High; bespoke delivery; cultural fragility | Moderate; some standardization possible | Low; repeatable integration playbook |
| Tech Leverage | 20% | Minimal tech impact on margins | Some automation/tools; incremental benefit | Technology transforms unit economics |
| Pricing Power | 15% | Commodity service; aggressive procurement | Some differentiation; moderate stickiness | Mission-critical; high switching costs |
| Labor Risk | 10% | Severe shortages; wage inflation; key-person dependency | Manageable with effort | Low dependency; automated delivery; broad talent pool |
| Exitability | 15% | Narrow buyer universe; services multiples only | Multiple exit paths | Strong narrative; tech premium plausible |
Composite score interpretation:
- 4.0–5.0: Priority sub-sector for immediate platform thesis development
- 3.0–3.9: Attractive with caveats; thesis-dependent
- 2.0–2.9: Selective opportunities only; requires specific angle
- <2.0: Avoid or wait for structural change
1.6.3 Target Signal Checklist Structure
Target signals are observable indicators—detectable through desk research, broker conversations, or early-stage diligence—that a company is a strong candidate for a TEBS buy-and-build acquisition. Each signal links to a specific diligence question.
| Signal Category | Observable Indicator | Diligence Question |
|---|---|---|
| Revenue Quality | >50% recurring/contracted revenue; multi-year agreements | What % of revenue is contractually committed beyond 12 months? What are gross and net revenue retention? |
| Growth Trajectory | Organic revenue growth >8% CAGR over 3 years | What is the split between volume, pricing, and new customers? Any dependency on a single vertical? |
| Margin Profile | EBITDA margin >12% (services) or >18% (tech-enabled) | What is margin by service line? Where is expansion post-centralization? |
| Owner Dynamics | Founder aged 55+; no succession plan; or sponsor nearing exit | What is the seller’s motivation? Is there a bench below the founder? |
| Technology Posture | Proprietary tools/portals/data assets; R&D spend >3% revenue | Is tech client-facing or purely internal? What switching costs exist? |
| Customer Base | Top 10 clients <40% of revenue | What is CAC and payback? Contract duration and renewal dynamics? |
| Scalability | Revenue per FTE growing >5% p.a.; standardized workflows | How many standard delivery processes exist? Onboarding time? |
| Bolt-on Potential | Clear adjacency map in niche/geography | How many similar businesses exist and are approachable? |
1.7 Framework Diagram: Fragmentation × Tech Leverage × Integration Complexity
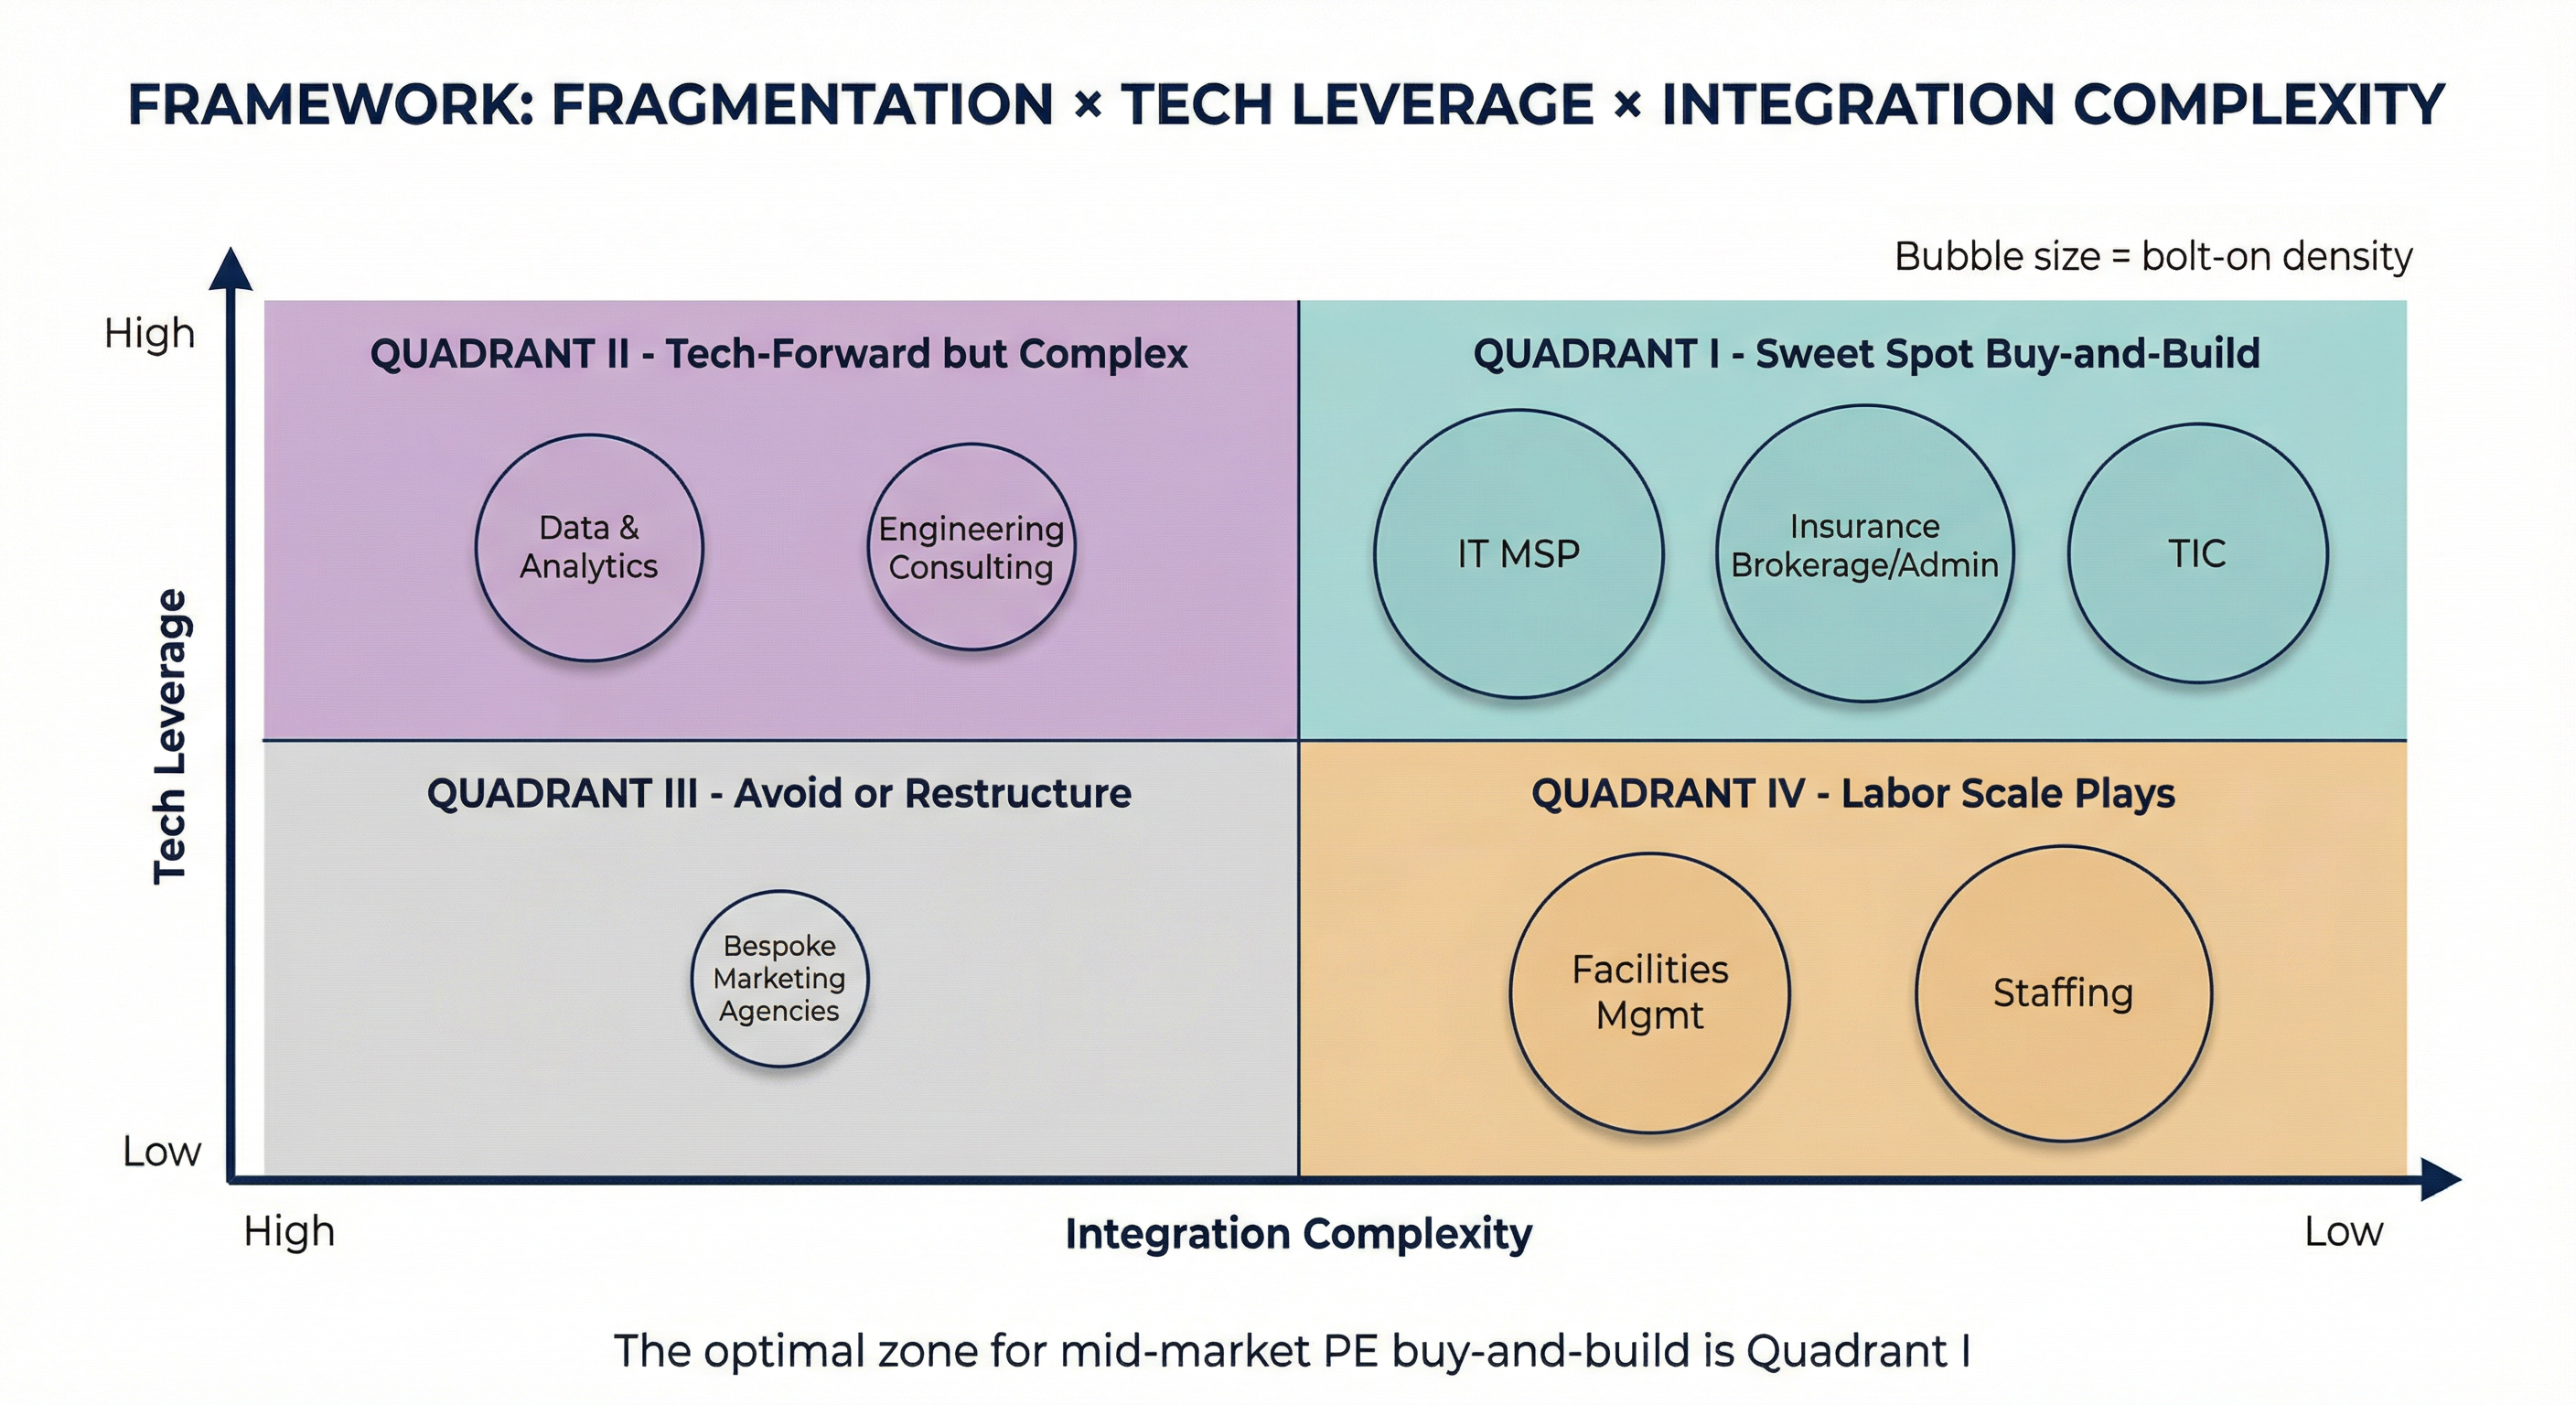
The third dimension—fragmentation (represented by bubble size in a scatter plot)—determines bolt-on density. The optimal zone for mid-market PE buy-and-build is Quadrant I (high tech leverage, low integration complexity, high fragmentation). Quadrant IV can also work for sponsors with strong operational playbooks willing to accept services-level multiples. Quadrant II requires specialist investors with deep sector expertise and tolerance for integration risk. Quadrant III is generally avoided unless there is a credible thesis to shift the segment rightward on the tech continuum (Section 1.2.2).
1.8 Scope Exclusions and Boundary Conditions
To maintain analytical focus, the following are explicitly out of scope:
- Pure software/SaaS companies with no services delivery component.
- Large-cap transactions (EV >€500M at entry) except as exit comparables.
- Non-European geographies except for US comparisons that illuminate European dynamics.
- Regulatory deep-dives beyond what is required to understand fragmentation, pricing power, switching costs, and scalability.
- Macro forecasting: The report does not predict interest rates, GDP growth, or exchange rates. Where macro assumptions affect conclusions, they are stated explicitly and sensitivity-tested qualitatively.
1.9 How to Use This Report
For PE Partners and IC Members:
- Start with Chapter 2 (market landscape and valuation drivers) to calibrate where TEBS sits in your sector allocation.
- Use the scoring rubric in this chapter and the consolidated view in Chapter 6 to prioritize sub-sectors.
- Reference specific sub-sector modules (Chapters 3–5) when evaluating live deal opportunities.
For Investment Managers:
- Use the Target Signal Checklists to accelerate screening.
- Reference the Margin Expansion Levers Taxonomy to build underwriting cases.
- Use the buyer landscape analysis in Chapter 7 to position competitively in auctions.
For Operating Partners:
- The Value Creation Playbooks in each sub-sector module provide sequenced 0–36 month action plans.
- The Integration Playbook in Chapter 8 provides cross-cutting 100-day priorities.
- The AI Impact Matrix in Chapter 8 distinguishes structural help vs threat, grounded in operational pathways rather than “AI narratives”.
For M&A and Value-Creation Teams:
- The Diligence Checklist in Chapter 8 is designed for direct use in live deal workstreams.
- The Platform Thesis Templates in Chapter 7 provide IC-ready frameworks for new platform proposals.
- The cross-border expansion playbooks address the commercial and cultural considerations of scaling TEBS platforms across European borders.
Given the continued emphasis on buy-and-build, the quality of post-merger integration is increasingly the determinant of outcome dispersion. In parallel, private market commentary stresses a tougher operating environment that increases the premium on demonstrable operational value creation (not financial engineering). This report provides the frameworks and evidence base to do both systematically.
Chapter 2: The European TEBS Landscape: Market Structure, Value Accrual, and What Drives 6× vs 12× EBITDA
2.1 Market Structure Overview: Aggregate TEBS TAM and Sub-Sector Decomposition
2.1.1 Sizing the European TEBS Opportunity (and Reconciling “Sector TAM” vs “TEBS-Eligible TAM”)
The European Tech-Enabled Business Services (TEBS) market does not map neatly to a single classification system. As defined in Chapter 1 (Section 1.2.1), TEBS is a cross-cutting investable perimeter spanning fifteen service sub-sectors, but only the portions where technology is (i) material to delivery economics and/or (ii) credibly investable as a workflow-embedded value-creation lever.
This distinction resolves the major sizing pitfall in many TEBS discussions:
- “Sector TAM” (gross market) = total revenues in the broad service category (e.g., total staffing, total facilities management).
- “TEBS-eligible TAM” (this report’s TAM) = the subset of revenues where tech enablement is a meaningful driver of repeatable unit economics, scalability, and multiple formation (e.g., RPO/MSP/VMS-enabled staffing; CAFM/IoT-enabled FM; managed outcomes vs ad hoc projects).
Key correction (consistency fix): In the prior draft, the stated aggregate TEBS TAM (€350–450B) was inconsistent with the sum of the gross sector TAMs shown in Table 2.1.2 (>€600B low-end). In this refined chapter, Table 2.1.2 explicitly separates gross sector TAM from TEBS-eligible TAM and shows the eligibility factor used to bridge the two. The aggregate TEBS TAM is now mechanically reconcilable to the table.
Bottom-up aggregate estimate (2025E)
- Sum of TEBS-eligible TAM across the 15 sub-sectors: ~€320–475B (ranges reflect both market uncertainty and eligibility-factor uncertainty).
- Less overlap adjustment: Several revenue pools can be double-counted across sub-sectors (e.g., “data & analytics services” embedded in IT services contracts; compliance work embedded in legal and advisory mandates). We apply a conservative ~5–10% overlap haircut to avoid overstating addressability.
- Resulting aggregate European TEBS-eligible TAM (2025E): €350–450B.
This aggregate range is directionally validated by public market proxies used as triangulation inputs (all converted consistently to EUR using an illustrative USD/EUR = 0.92 FX assumption for comparability):
- Europe IT services (broad): USD 492B (2026E) ≈ €452B, but TEBS-eligible is only the managed services/outsourcing/implementation subset (Mordor Intelligence).
- Europe managed services (subset proxy): USD 95.6B (2025E) ≈ €88B (ReportsnReports / Market Data Forecast).
- Europe TIC: USD 69.27B (2026E) ≈ €64B (Mordor Intelligence).
- Europe insurance brokerage (broad): USD 260.03B (2025E) ≈ €239B, but TEBS-eligible is the portion where brokerage is workflow-embedded (commercial/specialty admin, platforms, MGA-like distribution infrastructure), not the entire premium-linked distribution ecosystem (Mordor Intelligence).
(Sources: Mordor Intelligence sector reports; ReportsnReports; Market Data Forecast—see Sources section.)
2.1.2 Sub-Sector Scale, Growth, and “TEBS-Eligible” Decomposition (15 Sub-Sectors)
How to read Table 2.1.2:
- Gross Sector TAM (€B) reflects the broad market size typically quoted in industry reports.
- TEBS-Eligible TAM (€B) is the addressable revenue pool under this report’s definition (Chapter 1), i.e., where tech enablement is an investable lever and can credibly move the business along the services-to-software continuum.
- Fragmentation metrics are presented as indicative and Europe-wide, recognizing meaningful country-by-country variation.
Table 2.1.2 — European TEBS landscape snapshot (2025E unless noted)
| Sub-Sector | Gross Sector TAM (€B) | TEBS-Eligible TAM (€B) | Eligibility Factor (range) | Growth (CAGR %) | Fragmentation (qual.) | CR5 (indic.) | HHI band (indic.) | Tech Leverage | Labor Intensity | Typical EBITDA Margins | Indicative Multiple Range (EV/EBITDA) |
|---|---|---|---|---|---|---|---|---|---|---|---|
| 3.1 IT Managed Services & Outsourcing | 80–100 | 80–100 | ~100% | 5–10% | High (mid-market) | 5–15% | 100–500 | High | Medium | 12–20% | 8–14× |
| 3.2 Testing, Inspection & Certification (TIC) | 55–70 | 40–55 | 60–80% | 3–5% | Moderate | 30–45% | 1,200–2,200 | Medium-High | Medium | 12–18% | 10–16× |
| 3.3 Professional Staffing & Recruitment | 100–130 | 25–40 | 20–30% | 4–6% | Very High | 10–25% | 150–700 | Low–Medium | Very High | 3–8% | 6–10× |
| 3.4 Compliance, Regulatory & Advisory | 20–30 | 15–25 | 70–85% | 6–9% | High | 10–20% | 200–900 | Medium-High | Medium | 15–25% | 8–14× |
| 3.5 Healthcare Services (Clinical/Dental/Vet) | 40–55 | 20–30 | 45–60% | 5–8% | Very High | 5–10% | 50–400 | Medium | High | 15–25% | 10–16× |
| 3.6 Financial Back-Office & Fund Administration | 25–35 | 20–30 | 75–90% | 5–8% | Moderate-High | 30–45% | 900–1,800 | High | Medium | 18–30% | 10–15× |
| 3.7 Engineering & Technical Consulting | 45–60 | 15–25 | 30–40% | 3–5% | High | 15–25% | 250–900 | Medium | High | 8–15% | 7–11× |
| 3.8 Facilities Management & Building Services | 70–90 | 15–25 | 15–30% | 3–5% | Very High | 20–30% | 300–1,200 | Low–Medium | Very High | 5–12% | 6–9× |
| 3.9 Marketing Services & Digital Agencies | 30–40 | 12–20 | 40–50% | 4–7% | Very High | 5–10% | 50–400 | Medium | High | 10–18% | 5–10× |
| 3.10 Education & Training Services | 15–25 | 7–12 | 40–55% | 5–8% | High | 5–15% | 80–600 | Medium-High | Medium-High | 10–20% | 7–12× |
| 3.11 Environmental & Sustainability Consulting | 10–18 | 6–12 | 60–75% | 8–12% | Very High | 5–10% | 50–400 | Medium | Medium-High | 12–20% | 8–13× |
| 3.12 Legal Services & LPO | 20–30 | 8–15 | 35–55% | 3–5% | High | 5–10% | 50–500 | Low–Medium | Very High | 15–30% | 7–12× |
| 3.13 Data & Analytics Services | 15–25 | 15–25 | ~100% | 8–12% | High | 15–30% | 400–1,400 | Very High | Medium | 15–25% | 10–16× |
| 3.14 Logistics & Supply Chain Services (asset-light/tech-enabled) | 50–70 | 15–25 | 25–40% | 4–6% | High | 20–35% | 500–1,600 | Medium-High | High | 5–12% | 7–11× |
| 3.15 Insurance Brokerage & Distribution | 40–60 | 25–40 | 55–70% | 6–8% | High (below top tier) | 15–30% | 400–1,600 | High | Low–Medium | 20–35% | 10–16× |
Notes on the quantitative fragmentation metrics (CR5 / HHI):
- CR5 = estimated market share of the 5 largest providers in the relevant European sub-market (country-weighted where possible).
- HHI bands are indicative and used to enforce internal consistency (not to claim regulator-grade precision).
- These metrics vary materially by country and by segment definition (e.g., “TIC overall” vs “food testing labs”; “insurance brokerage overall” vs “SME commercial brokers”). This report uses them as screening scaffolding, not as definitive concentration statistics.
Key observations (now consistent with the sizing math):
- The gross services universe is enormous (~€600–800B across these categories), but the TEBS-eligible slice is narrower (~€350–450B). The investable TEBS perimeter is large enough to support many platforms, but small enough that definition discipline matters.
- Fragmentation is widespread; consolidation is uneven. TIC and fund administration show structurally higher concentration, while healthcare groups, marketing agencies, and many compliance/advisory niches remain long-tail.
- Multiples are driven more by revenue quality and workflow embedding than by sector labels. “IT services” is not automatically premium; “staffing” is not automatically low—sub-segment positioning determines both margin potential and exitability.
2.1.3 Fragmentation: Making the Buy-and-Build Premise Measurable (CR5/HHI)
Fragmentation is the underwriting prerequisite for buy-and-build. In this report it is assessed using two complementary lenses:
- CR5 (top-5 share): practical and intuitive for investors; supports quadrant placement.
- HHI (Herfindahl-Hirschman Index): captures “shape” of the market beyond just the top five, helpful where one player dominates a local market but the rest is long-tail.
Interpretation thresholds used consistently in this chapter and the matrix (Figure 2.4):
- High fragmentation: CR5 < 20% (typically HHI < ~800)
- Moderate fragmentation: CR5 ~ 20–35% (HHI ~800–1,800)
- Lower fragmentation / more consolidated: CR5 > 35% (HHI > ~1,800)
These thresholds are consistent with the qualitative fragmentation ratings shown in Table 2.1.2 and eliminate the prior draft’s quadrant-placement inconsistencies.
2.1.4 Labor Intensity vs. Scalability: The Trade-Off Investors Actually Underwrite
Labor intensity is not “bad”; it simply dictates where value creation must come from:
- High labor intensity tends to cap margin expansion from tech alone (because delivery still requires people), but can support strong buy-and-build returns if integration is straightforward and scale benefits are real (procurement, scheduling density, shared services).
- Lower labor intensity / higher tech leverage supports non-linear scaling (revenue growing faster than headcount), which is disproportionately rewarded at exit.
To make this measurable during screening, we use revenue per FTE (and, where available, EBITDA per FTE) as simple, comparable proxies.
Table 2.1.4 — Indicative revenue/FTE benchmarks (Europe mid-market; screening ranges)
| Sub-Sector | Revenue / FTE (indic.) | What “good” looks like in diligence |
|---|---|---|
| IT Managed Services | €140k–€220k | PSA discipline; automation; NOC leverage; >70% recurring |
| TIC | €120k–€200k | Route density; lab utilization; digital QA; cross-selling of certification bundles |
| Staffing | €250k–€450k (high pass-through) | Judge on GP/FTE and EBITDA/FTE, not revenue; low working-cap volatility |
| Compliance/Reg Advisory | €120k–€200k | Productized offerings; template/workflow reuse; subscription compliance monitoring |
| Healthcare groups (dental/vet) | €90k–€160k | Chair/clinician utilization; standardized procurement; centralized billing |
| Fund admin / back-office | €150k–€260k | High automation; low error rates; standardized onboarding; embedded portals |
| Engineering consulting | €110k–€180k | Reduced bench volatility; tooling reuse; IP-bearing delivery accelerators |
| Facilities management | €80k–€140k | Route density, scheduling, CAFM adoption; procurement scale; reduced subcontract leakage |
| Marketing agencies | €110k–€190k | Retainers; analytics-driven delivery; reusable creative systems; margin by service line |
| Education/training | €90k–€160k | Blended learning; content reuse; cohort scaling; enterprise contracts |
| Environmental/sustainability | €110k–€190k | Recurring reporting; software-assisted measurement; standardized audits |
| Legal/LPO | €90k–€160k | Workflow tooling; matter lifecycle management; offshore/onshore leverage; specialization |
| Data & analytics | €150k–€280k | Reusable data models; platform accelerators; high NRR |
| Logistics (asset-light) | €120k–€220k | Control-tower tooling; high shipment/FTE; low exception rates |
| Insurance brokerage | €180k–€320k | Admin platform leverage; low servicing cost; cross-sell penetration |
Important: these are screening heuristics, not universal truths. Staffing, for example, often looks “productive” on revenue/FTE due to pass-through revenue; investors should underwrite to gross profit per FTE and conversion, not headline revenue.
2.2 Why TEBS Is the Dominant European Mid-Market PE Theme
2.2.1 Europe-Specific Structural Drivers
Four structural features of the European economy make TEBS uniquely attractive for buy-and-build strategies:
1) Extreme SME density creates a deep long tail of acquisition candidates.
SMEs are central to the EU economy, accounting for a majority share of employment and a large share of value creation. SME density and the prevalence of founder-owned firms create unusually deep bolt-on pipelines across most business service categories (EPP Group; Statista; IfM Bonn—see Sources). This is particularly visible in sub-sectors where local relationships and language remain central (IT MSPs, brokers, compliance/advisory, many healthcare services).
2) Service-heavy GDP composition sustains secular outsourcing and specialization.
Services represent a large share of European GDP (TheGlobalEconomy.com—see Sources). Even where outsourcing penetration varies by region (e.g., DACH vs Nordics vs UK&I), cost inflation, security/compliance requirements, and skills scarcity continue to push SMEs toward external providers in IT operations, compliance, and specialist advisory.
3) Cross-border fragmentation amplifies bolt-on density (and protects defensibility).
Europe’s fragmentation is structural: language, procurement norms, regulation, and local go-to-market models keep markets regionally segmented. That increases the number of viable bolt-ons and allows platforms to build defensible regional scale (e.g., Benelux + DACH MSP, pan-Nordic compliance platform) rather than competing head-on with global incumbents.
4) Generational transition expands supply of motivated sellers.
Across multiple European countries, the aging of founders and limited succession options continue to support deal flow in sub-€50M EV services businesses—often independent of the macro cycle.
2.2.2 Why Buy-and-Build Often Outperforms Greenfield SaaS in European TEBS
Investment committees frequently ask why not deploy the same capital into pure software. The answer is not ideological—it is risk-adjusted value creation math:
- Entry multiples and underwriting visibility differ. Mid-market services platforms can often be entered at materially lower multiples than software, with immediate EBITDA and contracted cash flows (DealSuite European Monitor; CLFI—see Sources).
- Bolt-on density is unusually high in Europe. Add-ons are abundant and frequently founder-led; many can be acquired below platform multiples, creating a repeatable multiple-arbitrage engine (Bain buy-and-build research; Gain.pro—see Sources).
- Tech can be layered onto an existing revenue base. In TEBS, technology is often best deployed as a delivery and retention lever inside an operating platform—rather than as a standalone product searching for distribution.
2.2.3 Transferable Patterns from US Services Roll-Ups—and What’s Structurally Different in Europe
US roll-ups provide useful patterns:
- Multiple arbitrage remains foundational in buy-and-build (Bain).
- Continuous acquirers outperform through faster growth and margin expansion, driven by repeated M&A muscle memory and integration cadence (Bain; INSEAD Knowledge).
- Integration discipline (finance/control integration early; operating model clarity) separates winners from “collections of businesses” (Bain; INSEAD).
What is structurally different in Europe (and why it matters to TEBS):
- Regulatory perimeter is broader and less uniform cross-border. Insurance distribution, healthcare delivery, and certain compliance/TIC activities face licensing, professional standards, and conduct regimes that vary by country. This raises integration complexity (entity structuring, compliance oversight, supervision models) but can also increase defensibility for scaled platforms with strong governance.
- Labor regimes and worker representation can materially affect synergy timing (works councils, transfer of undertakings, local employment protections). Operational integration playbooks need localization.
- Data and privacy constraints (GDPR) are more central to cross-border platform design—especially in healthcare, insurance, and data/analytics—affecting how “one platform” is executed in practice.
- Public procurement exposure is higher in parts of facilities, training, and environmental services, shaping contract structure, inflation pass-through, and churn dynamics.
Net: the US playbook transfers, but Europe requires more deliberate governance, compliance architecture, and country-specific integration sequencing—especially in regulated sub-sectors.
2.3 The Services-to-Software Continuum
2.3.1 Mapping All 15 Sub-Sectors
The services-to-software continuum (Chapter 1, Section 1.2.2) scores each sub-sector on recurring revenue, workflow/software penetration, data leverage, labor intensity, and switching costs.
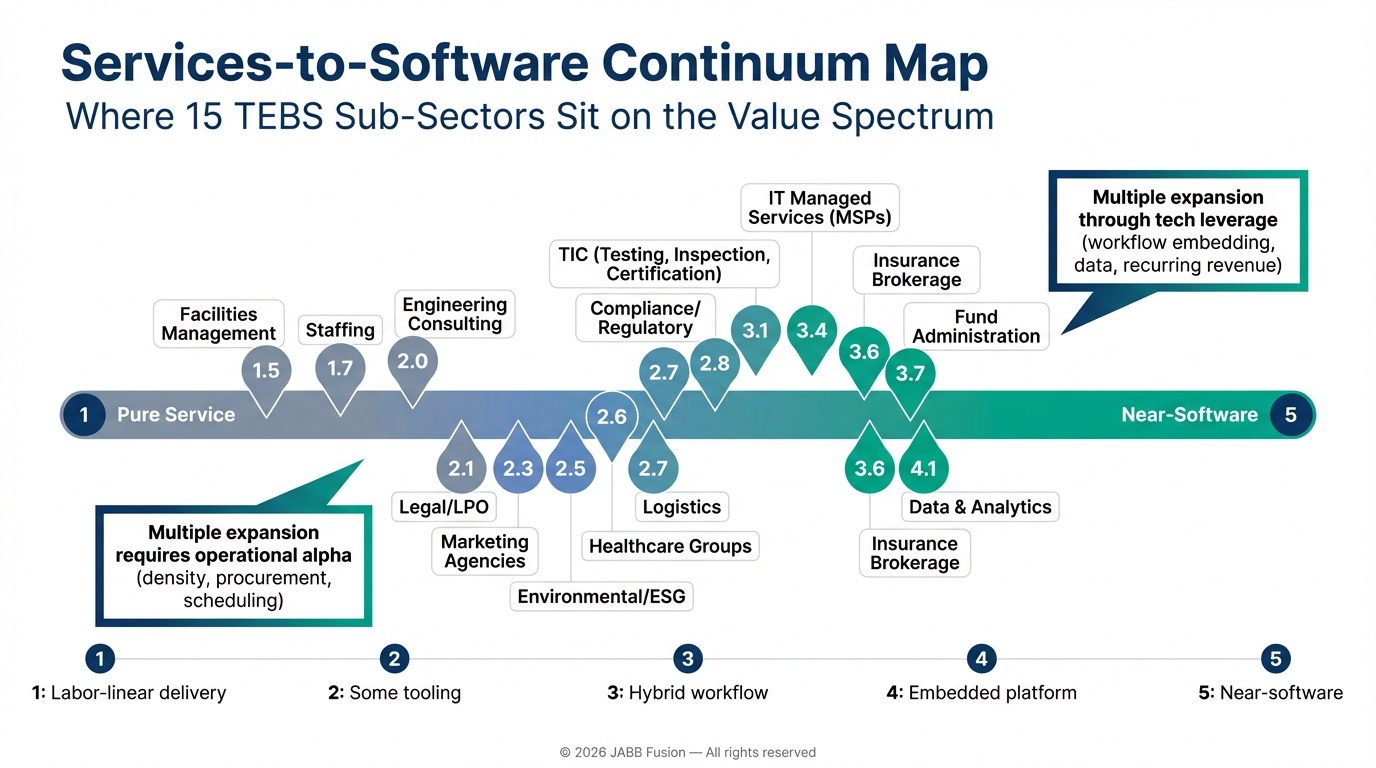
2.3.2 Where Value Accrues on the Continuum
Value accretion is not linear. The most material valuation step-ups tend to occur when a provider crosses two practical thresholds:
Transition 1: “Hours” → “Managed outcome” (~2.0 to ~3.0)
Standardized delivery, tool-assisted workflows, and measurable outcomes improve margin and underwriting confidence.
Transition 2: “Managed outcome” → “Embedded workflow” (~3.0 to ~4.0)
Client switching costs become operational (integrations, data models, portals, compliance routines), not just contractual.
2.3.3 Within-Sector Variance (Where Alpha Actually Comes From)
Within-sector variance often exceeds between-sector variance. An MSP with automated remediation, a standardized PSA stack, and >80% recurring behaves economically differently from a break-fix reseller—even though both are “IT services.” The sub-sector modules (Chapters 3–5) therefore emphasize target-level diagnostics over sector labels.
2.4 Fragmentation vs Tech Leverage Matrix
Critical fix implemented: The prior draft’s matrix was internally inconsistent with Table 2.1.2 fragmentation ratings. This refined matrix:
- Uses x-axis = fragmentation (low → high), consistent with the buy-and-build intuition that “more fragmented” sits to the right.
- Places each sub-sector in a quadrant consistent with Table 2.1.2 and the CR5/HHI bands.
- Includes TIC (3.2), which was previously missing.
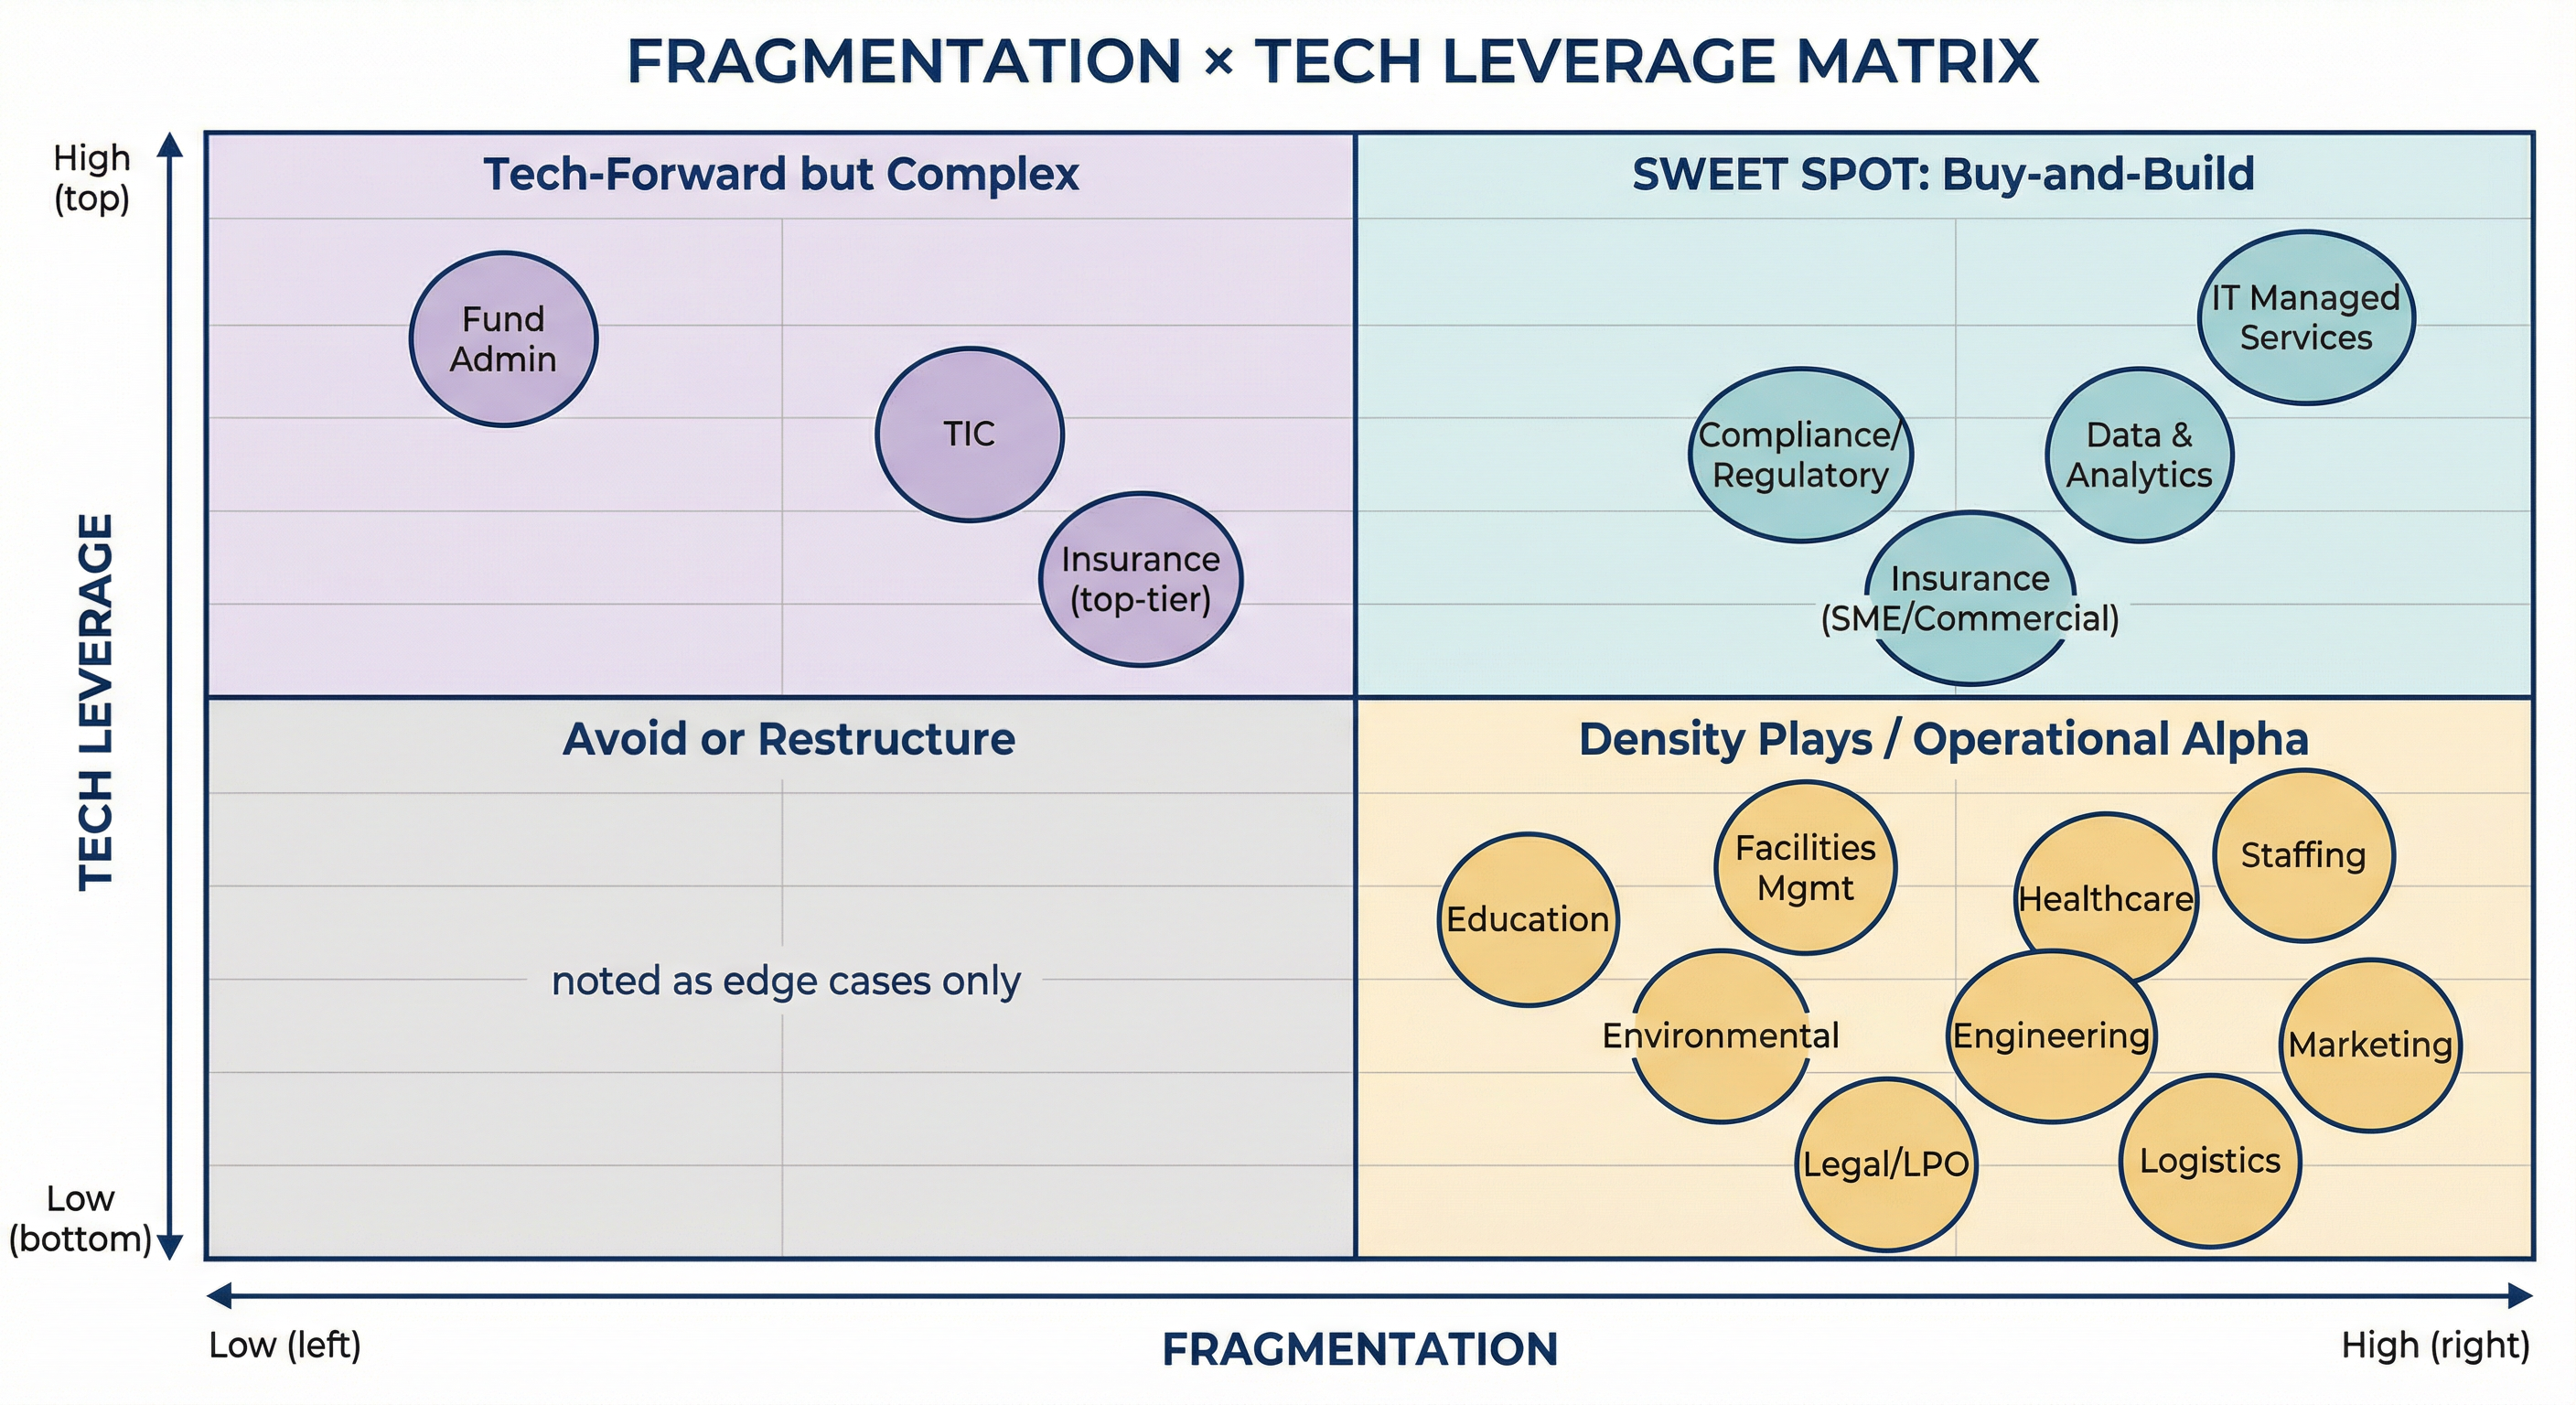
Quadrant I — “Sweet Spot Buy-and-Build” (high fragmentation + high tech leverage):
IT MSPs, compliance/regulatory services, data & analytics, and many workflow-embedded insurance brokerage segments combine: (i) repeatable service delivery, (ii) meaningful tech leverage, and (iii) dense bolt-on pipelines.
Playbook: platform + rapid bolt-ons; centralize data/tech stack; standardize go-to-market and reporting.
Quadrant II — “Tech-forward but more consolidated / integration-heavy”:
Fund administration and portions of TIC exhibit higher concentration and more complex integration constraints (systems, accreditation, regulated processes).
Playbook: fewer, higher-quality deals; heavier diligence on systems and governance; prioritize integration architecture early.
Quadrant IV — “Density plays / operational alpha”:
Staffing, facilities, healthcare group roll-ups, and several advisory categories can be excellent buy-and-build arenas, but the tech premium requires deliberate repositioning (workflow, scheduling, billing, analytics) rather than assuming it.
Playbook: scale + shared services + procurement + scheduling density; selective tech overlay tied to measurable unit economics.
2.5 Valuation Drivers Framework: What Separates 6× from 12× EBITDA
2.5.1 The Six-Driver Framework
Building on Chapter 1 (Section 1.6.2), valuation outcomes in TEBS are best explained by six drivers that map to both entry pricing and exit narrative strength. Sector-level multiple ranges exist, but quality dispersion within the same sub-sector is often larger than inter-sector dispersion (DealSuite; CLFI—see Sources).
| Driver | Impact on Entry Multiple | Impact on Exit Multiple | Key Diligence Signal |
|---|---|---|---|
| 1. Revenue Quality & Recurrence | High | Very High | % under contract; renewal mechanics; NRR where measurable |
| 2. Switching Costs / Workflow Embedding | Medium | High | Integrations, portals, data models; operational reliance |
| 3. Key-Person Dependency | High discount if present | Must be solved | Producer concentration; bench depth; account governance |
| 4. Operational Maturity | Medium | High | KPI cadence; cohort margins; unit economics; forecasting accuracy |
| 5. Tech Differentiation | Medium-High | Very High | Proprietary workflow; automation; client-facing tooling vs back-office-only |
| 6. Integration Maturity / Platform Proof | N/A at entry | Very High | Standardized systems; synergy capture; repeatable M&A engine |
2.5.2 The Driver-to-Multiple Linkage Table
| Observable Condition | Typical Multiple Band (Mid-Market Entry) | Typical Multiple Band (Platform Exit) | What Makes the Difference |
|---|---|---|---|
| Recurring/contracted revenue >70% | 8–12× | 12–16× | Underwriteable cash flows; lower perceived cyclicality |
| Hybrid recurrence (40–70%) | 6–9× | 9–13× | Exit depends on proving recurrence conversion and retention |
| Project-heavy / low visibility | 4–6× | 6–9× | Needs explicit conversion story (contracts, productization) |
| Top 10 clients <30% | +0.5–1.0× vs peer | Sustains premium | Diversification reduces “event risk” |
| Top 3 clients >40% | -1–2× vs peer | Exit constrained | Concentration is a recurring value killer in services |
| Tech embedded in client workflow | 8–12× | 12–18× | Switching costs are operational, not just relational |
| Federated group, weak integration | N/A | Discount at exit | “Collection of assets” narrative limits multiple expansion |
2.5.3 PE vs Corporate Buyers (and Why It Matters in TEBS)
Observed market data indicates that buyer type influences multiples, with PE often paying more when a credible value-creation pathway exists, while corporates may price more tightly unless synergies are immediate (CLFI—see Sources). In TEBS, this dynamic is strongest where secondary buyout exit paths are deep (e.g., IT services, insurance distribution infrastructure, healthcare group platforms) and weakest in commoditized, low-differentiation segments.
2.6 PE Screening Heuristics: Go/No-Go Decision Framework
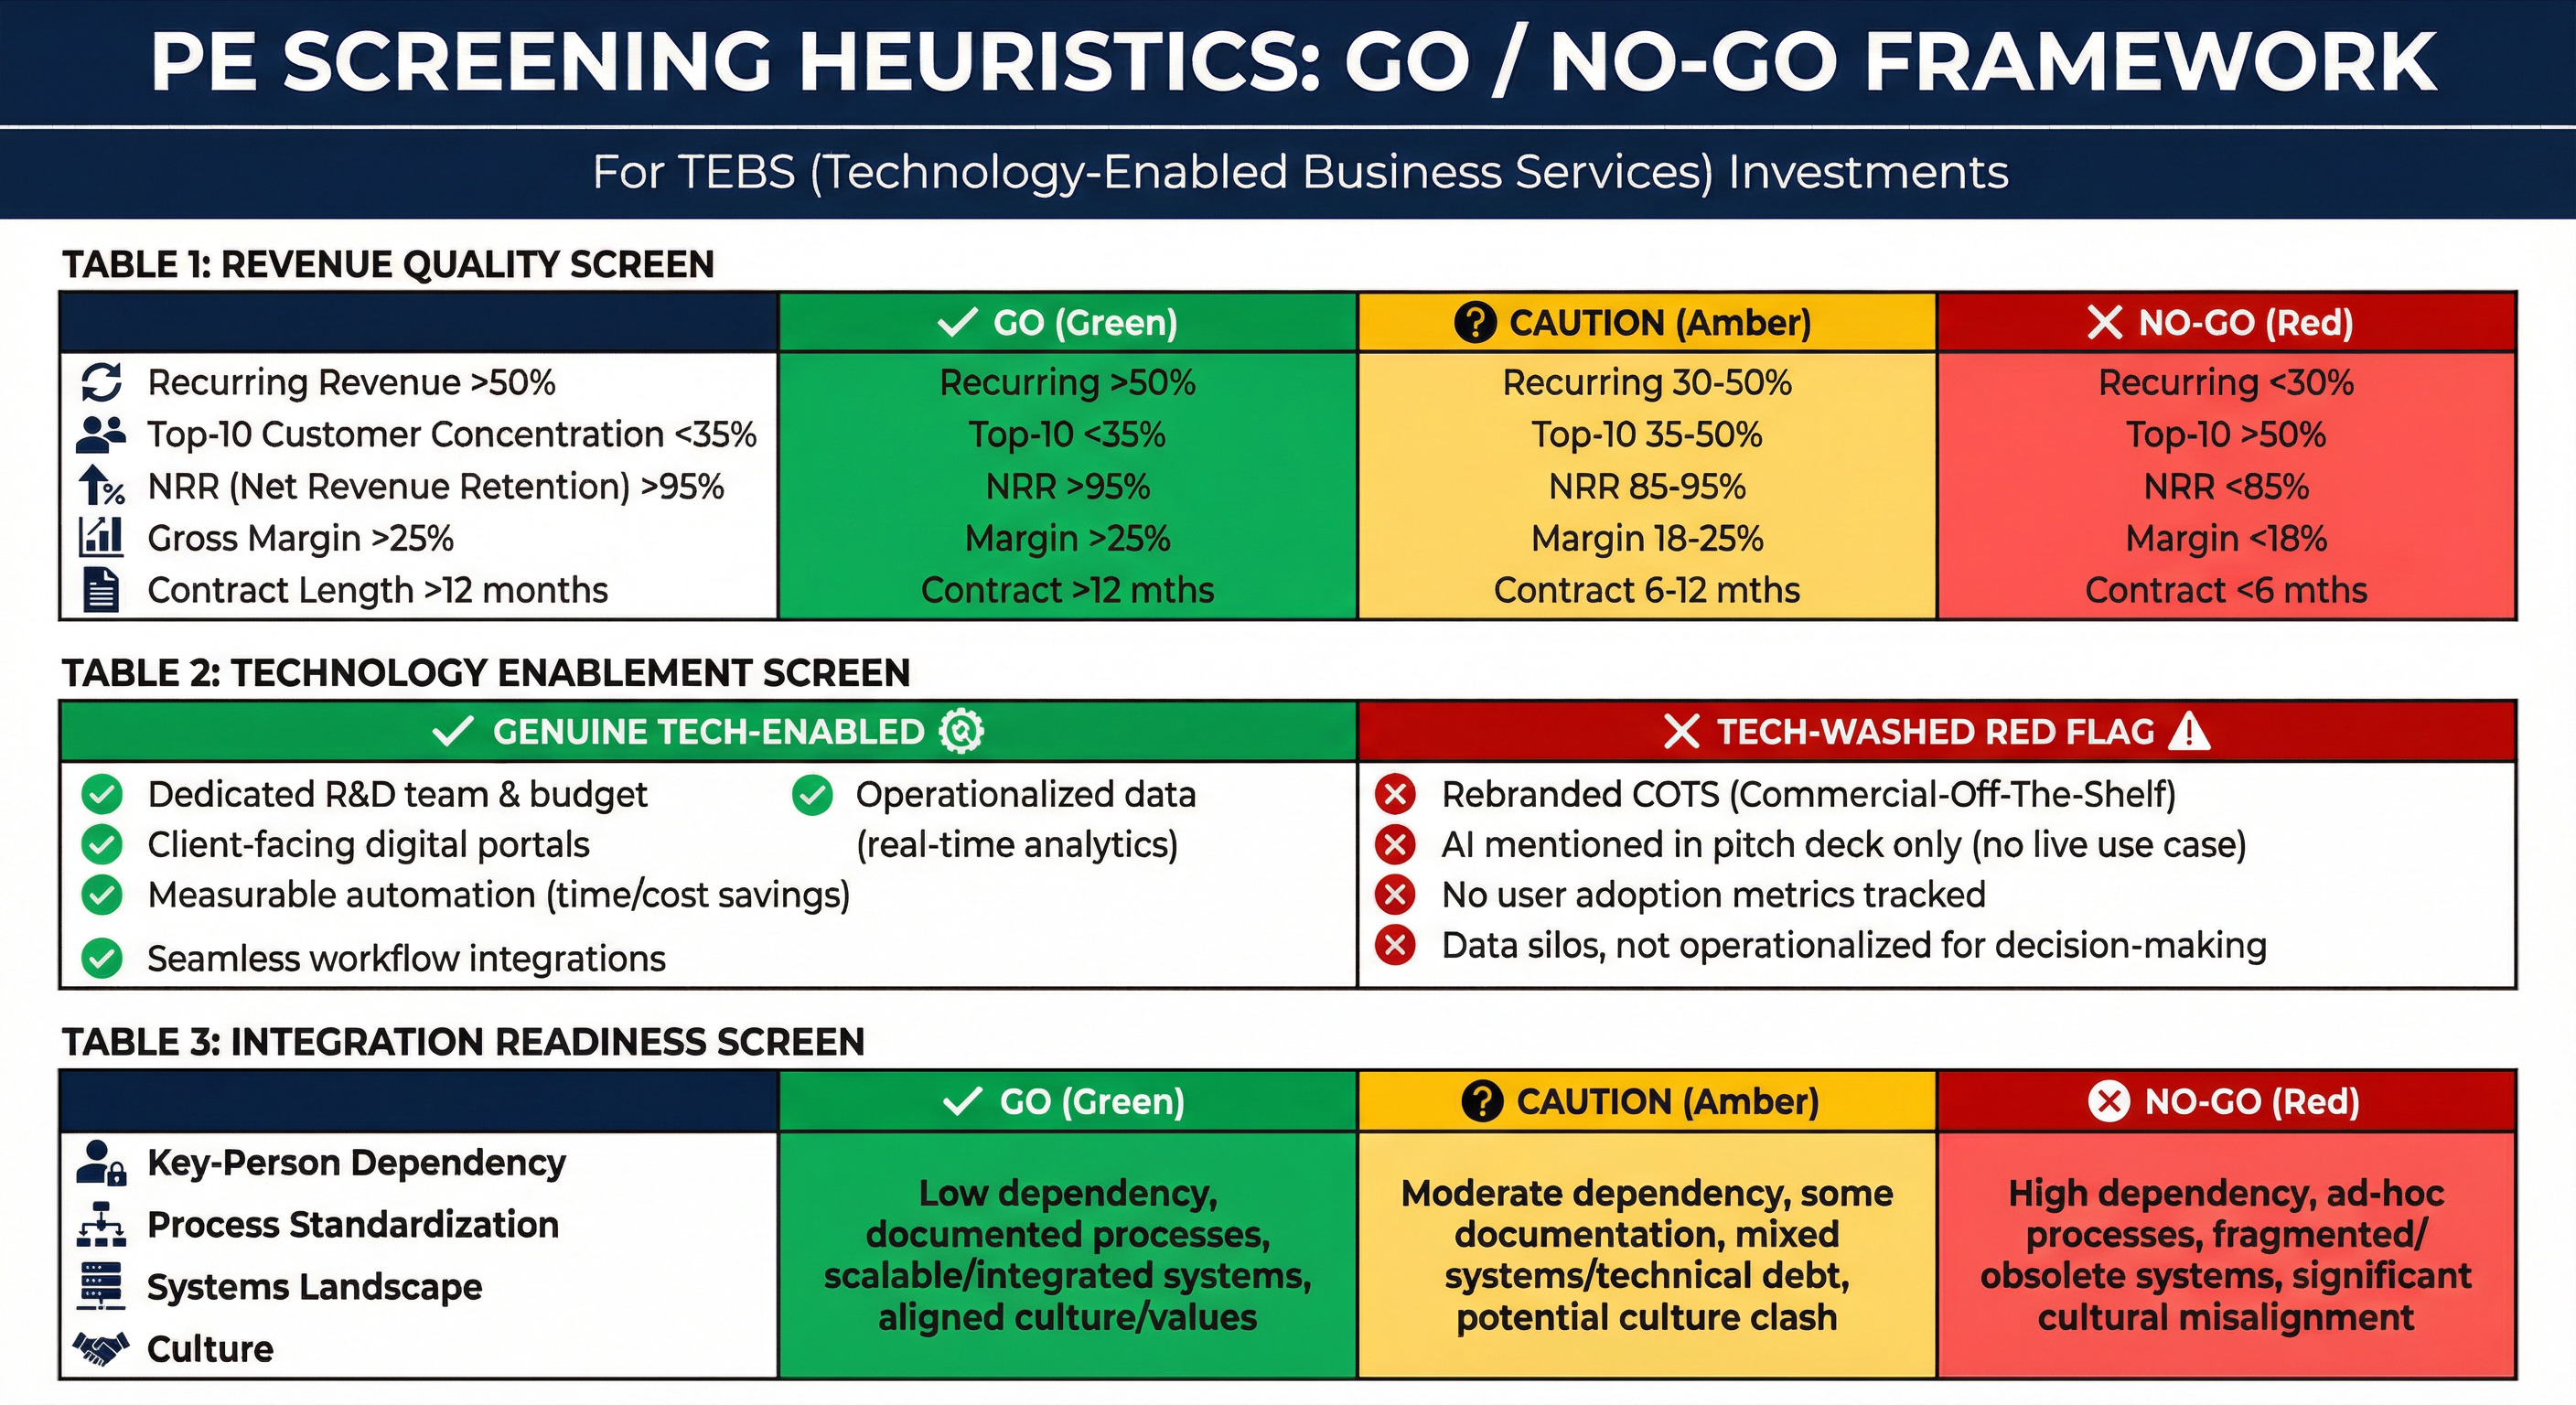
These heuristics translate the valuation drivers into actionable screening filters.
2.6.1 Revenue Quality Screen
| Criterion | Go | Caution | No-Go |
|---|---|---|---|
| Recurring/contracted revenue share | >50% | 30–50% | <30% with no credible conversion plan |
| Top 10 concentration | <35% | 35–50% | >50% (or single client >20%) |
| Net revenue retention (where measurable) | >95% | 85–95% | <85% structural churn |
| Gross margin (service context) | >25% | 18–25% | <18% commodity profile |
| Contract duration | >12 months | 6–12 months | <6 months / transactional |
2.6.2 Technology Enablement Screen
| Criterion | Genuine Tech-Enabled | “Tech-Washed” (Red Flag) |
|---|---|---|
| R&D / product capability | Dedicated team; sustained spend | Rebranded COTS tools; no product ownership |
| Client-facing tech | Portals/dashboards that change switching costs | “AI” in deck; no demo; no adoption metrics |
| Delivery automation | Measurable reduction in labor per unit | Manual delivery; automation claims not reflected in unit economics |
| Data leverage | Data improves delivery outcomes and retention | Data collected but not operationalized |
| Workflow embedding | Integrations + process reliance | Client can switch with minimal migration |
2.6.3 Integration Readiness Screen
| Criterion | Go | Caution | No-Go |
|---|---|---|---|
| Key-person dependency | Distributed revenue ownership | 2–3 key individuals | Founder controls >30% of revenue + all relationships |
| Process standardization | SOPs + KPI cadence | Partial documentation | No unit economics; bespoke everything |
| Systems landscape | Modern PSA/ERP/CRM + APIs | Mixed legacy | Undocumented legacy core; no migration path |
| Culture | Professional management | Founder-led but open | Resistant, litigious, high attrition |
2.6.4 Fake Tech-Enablement Detection Checklist
Common “tech premium traps”:
- AI claims without demonstrable client product adoption.
- “Platform” that is effectively a file-sharing portal.
- No improvement in productivity metrics (e.g., stable/declining gross profit per delivery FTE).
- “Recurring” revenue that is relational rather than contractual.
- “Tech spend” that is IT maintenance rather than product capability.
2.7 The Economics of Buy-and-Build in European TEBS: A Worked Example
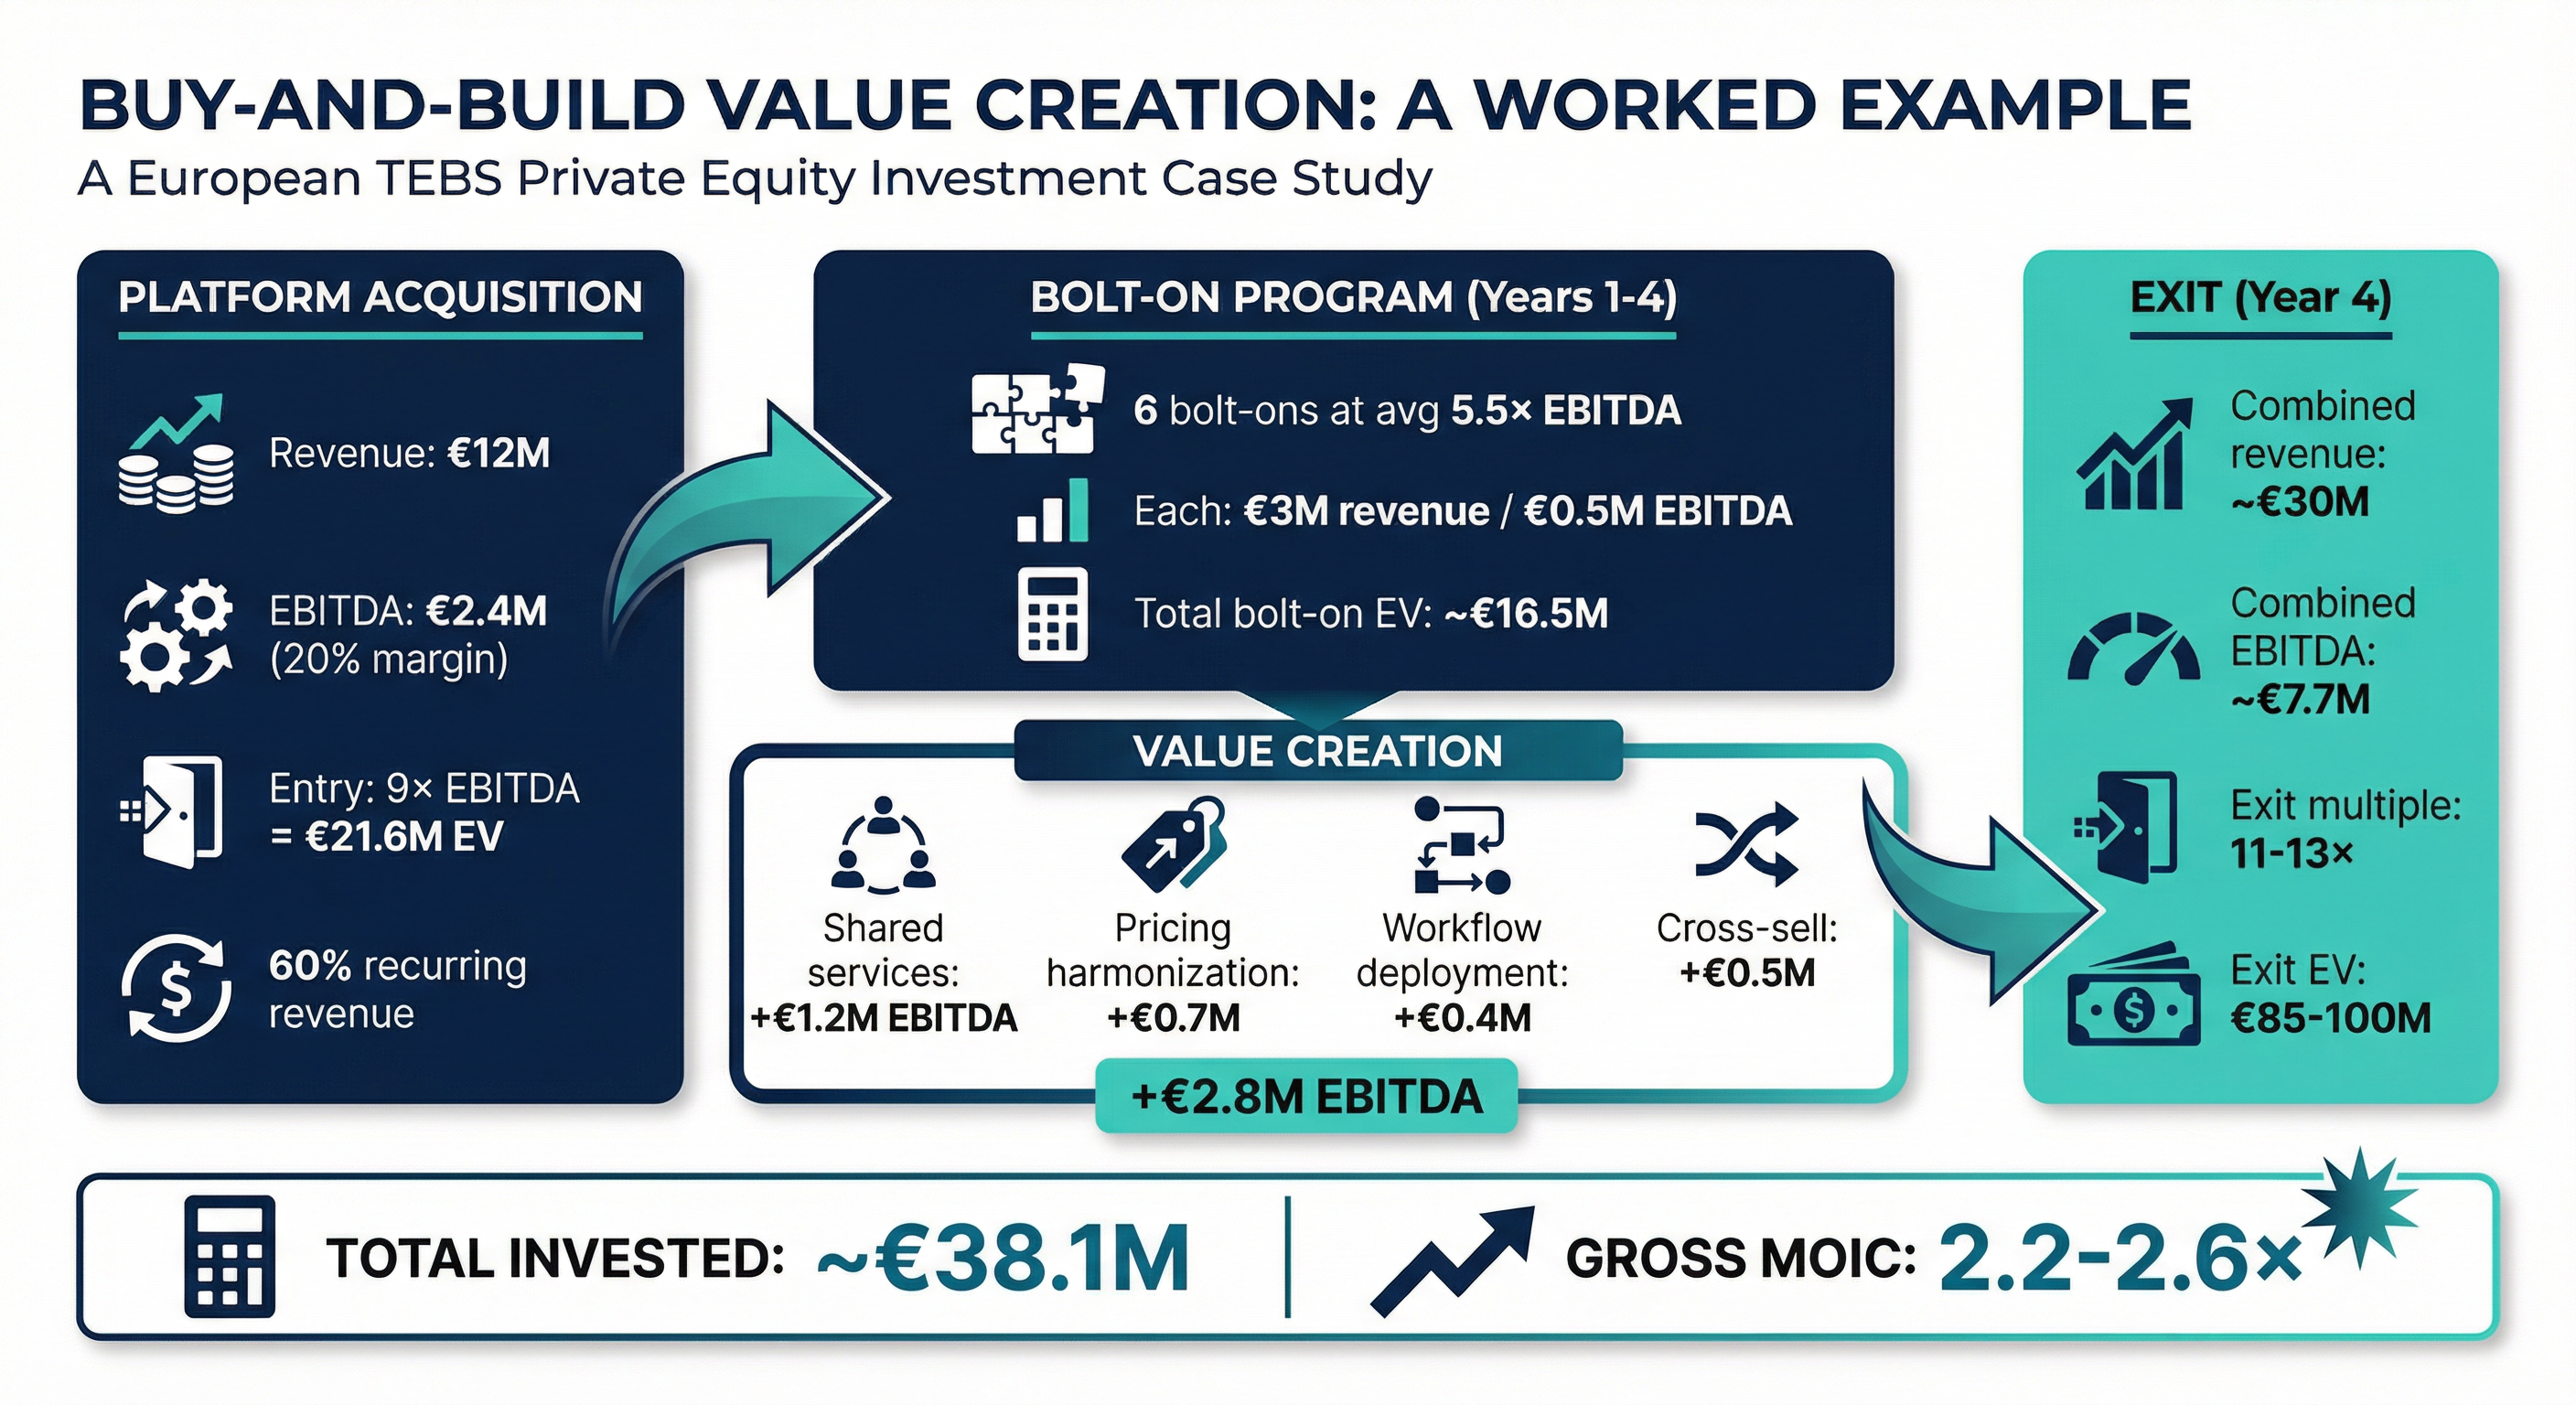
A stylized but representative mid-market thesis:
Platform acquisition: Compliance advisory firm; €12M revenue, €2.4M EBITDA (20%); entry at 9× EBITDA (= €21.6M EV); 60% recurring; workflow tool used in delivery.
Bolt-on program (years 1–4): Six bolt-ons at average 5.5× EBITDA; each €3M revenue / €0.5M EBITDA; total bolt-on EV ≈ €16.5M.
Value creation levers (illustrative):
- Shared services centralization: +€1.2M EBITDA
- Pricing harmonization: +€0.7M EBITDA
- Platform workflow deployment: +€0.4M EBITDA
- Cross-sell incremental revenue (€2M at 25% margin): +€0.5M EBITDA
Exit (year 4):
- Combined revenue: ~€30M
- Combined EBITDA: ~€7.7M
- Exit multiple: 11–13× (credible workflow/recurrence/platform proof)
- Exit EV: ~€85–100M
Total invested EV: ~€38.1M
Gross MOIC: ~2.2–2.6× (pre-leverage)
This example illustrates the core TEBS return engine: multiple arbitrage + integration synergies + tech-enabled operational leverage, with the exit multiple earned through platform proof rather than assumed at entry.
2.8 Implications for Portfolio Construction and Chapter Sequencing (Completed Table)
This chapter’s sizing, fragmentation metrics, and frameworks translate into practical portfolio construction:
- Prioritize Quadrant I for platform theses where tech leverage and fragmentation jointly support both bolt-on density and multiple expansion.
- Use Quadrant II selectively where consolidation is more advanced; returns depend on operational excellence and governance-heavy integration.
- Treat Quadrant IV as an operational-alpha arena: scale economics are real, but the tech multiple must be built, not expected.
- Avoid “Quadrant III-style” traps (low tech leverage + high integration complexity) unless there is a clear productization plan.
Table 2.8 — Portfolio construction implications by quadrant (full)
| Quadrant | Priority Sub-Sectors (from Fig. 2.4) | Core Value Lever | Integration Reality | Typical Exit Narrative | Typical Exit Multiple Band* |
|---|---|---|---|---|---|
| I — Sweet Spot (High frag / High tech) | IT MSP (3.1); Compliance (3.4); Data & Analytics (3.13); Insurance brokerage segments (3.15) | Multiple arbitrage + tech standardization + cross-sell | Moderate; manageable if systems/process discipline exists | “Workflow-embedded platform with recurring revenue and proven bolt-on engine” | ~10–16× |
| II — Tech-forward but more consolidated | Fund admin (3.6); TIC (3.2); parts of insurance top-tier (3.15) | Operational excellence + governance + selective M&A | Higher; systems/accreditation/regulatory complexity | “Scaled specialist with strong controls, compliance moat, and platform-grade reporting” | ~10–16× |
| IV — Density plays / ops alpha (High frag / Lower tech) | Staffing (3.3); Facilities (3.8); Healthcare groups (3.5); Education (3.10); Environmental (3.11); Engineering (3.7); Marketing (3.9); Legal/LPO (3.12) | Density, shared services, procurement, scheduling; then selective tech overlay | Often lower per-deal, but needs strong operating model | “Scaled regional consolidator with standardized operations and improving unit economics” | ~6–12× |
| III — Consolidated & low tech (generally avoid) | (Few core TEBS targets by definition; appears in edge cases) | Turnaround only | Often unattractive risk-return | “Restructuring story” | Case-specific |
*Bands are indicative and depend heavily on revenue quality, recurrence, and platform proof (Section 2.5).
How this drives chapter sequencing (Chapters 3–5):
- We lead with sub-sectors that repeatedly screen well under the combined lenses of fragmentation + tech leverage + integration feasibility (especially IT MSPs, compliance-led services, TIC segments with roll-up opportunity, and workflow-embedded insurance distribution infrastructure).
- Quadrant IV sectors follow with a different underwriting stance: operational playbook first, tech second, with explicit labor intensity diagnostics.
Chapter 3: Sub-Sector Deep Dives (Modules 3.1–3.5): Platform Fundamentals in High-Activity TEBS Arenas
This chapter delivers the first five standalone sub-sector modules, each following the identical A–H structure defined in Chapter 1 (Section 1.6.1). The five sub-sectors—IT Managed Services & Outsourcing, Testing Inspection & Certification (TIC), Professional Staffing & Recruitment, Compliance Regulatory & Advisory Services, and Healthcare Services—are among the most actively traded arenas in European mid-market PE and illustrate the core economic tension of TEBS buy-and-build: whether consolidation creates a technology-powered platform (repeatable processes, workflow embedding, scalable margins) or merely a scaled services group (headcount aggregation with limited multiple resilience).
Consistency note (TAM + rubric):
- Market sizing below is consistent with the gross TAM vs TEBS-eligible TAM construct in Chapter 2 (Table 2.1.2). Where published market estimates diverge meaningfully, we name the sources, explain the definitional gap, and then state the report’s TEBS-eligible working range.
- Scoring aligns to the six-dimension rubric in Chapter 1 (Section 1.6.2): Fragmentation, Integration Complexity (inverse-scored), Tech Leverage, Pricing Power, Labor Risk (inverse-scored), Exitability. “Bolt-on density” and “standardization potential” are treated as supporting evidence within these six dimensions (not additional dimensions), resolving the prior inconsistency.
Each module includes: (i) a mandatory diligence-ready table with source-footnoted benchmarks where available; (ii) a Platform Design Snapshot; and (iii) IC-ready insights. Each module also includes a short AI impact teaser bridging to Part V and a more granular labor lens bridging to Part VI.
3.1 IT Managed Services & Outsourcing (MSPs/MSO)
A. Definition & Scope
IT Managed Services & Outsourcing (MSP/MSO) covers outsourced management of an organization’s IT infrastructure, end-user environments, cloud platforms, and security operations under recurring contracts. In scope: managed infrastructure, managed security (SOC/MDR), managed cloud (admin + FinOps), managed networks/communications (SD-WAN/UCaaS ops), and co-managed IT. Out of scope: pure project-based IT consulting, bespoke software development, and hardware resale without a contracted service wrapper.
Where “tech-enabled” shows up in practice: Delivery depends on PSA/RMM, ticketing/ITSM, endpoint tooling, and increasingly automation. Switching costs are created by embedded tooling, documentation, identity/device posture, and operational routines—not just contractual term.
B. Market Size, Growth, and Fragmentation (with explicit reconciliation)
Chapter 2 cross-reference: Ch2 Table 2.1.2 frames MSP/MSO at ~€80–100B TEBS-eligible TAM (subset of a broader “managed services / IT outsourcing” spend pool).
Why published estimates vary (and how we reconcile them):
- Some sources define “managed services” narrowly (recurring managed IT), while others include broader IT outsourcing categories (e.g., large-scale enterprise ITO, certain hosting, systems integration wrappers). This creates large range dispersion (e.g., one 2025 estimate around ~$59B vs another around ~$95B for “Europe managed services,” each with different inclusions).
- For this report, TEBS-eligible MSP/MSO excludes (i) pure hardware resale, (ii) predominantly project consulting, and (iii) portions of enterprise ITO where value creation is dominated by labor-arbitrage megadeals rather than mid-market platform economics. The working range remains €80–100B, consistent with Ch2, and is best interpreted as “investable, recurring, mid-market-weighted managed services” rather than total European IT outsourcing.
Sources: definitional dispersion evidenced across market reports (e.g., Mordor Intelligence vs other syndicated research aggregators).
Fragmentation: The mid-market is highly fragmented across most European countries: thousands of sub-€15M revenue MSPs, typically founder-led, with local density driven by proximity/language preferences and on-site requirements for parts of delivery. Concentration is meaningfully higher at the global/enterprise end; it is structurally lower in SME-serving MSPs.
Directional concentration note (no unsupported CR5 claims): Reliable, comparable CR5 figures for “SME MSPs” are rarely published due to classification noise. In diligence, sponsors should compute concentration country-by-country using Orbis/Companies House/Amadeus lists filtered by revenue band and NACE codes, then adjust manually for “true MSP vs reseller vs project IT” revenue mix (Chapter 8 toolkit).
C. Typical Target Profile
| Attribute | Typical Range |
|---|---|
| Revenue | €3–30M |
| EBITDA margin | 12–20% (security-led often higher; break-fix heavy often lower) |
| Ownership | Founder-led (common) or first-gen PE-backed platforms |
| Geography | Single-country; often single-region with adjacency expansion potential |
| Recurring revenue | 65–85% (contracted recurring) |
| Employees | 30–250 FTE |
| Client base | 50–500 SME/mid-market clients; top-10 often <30% revenue |
D. Buy-and-Build Attractiveness (six-dimension rubric)
- Fragmentation: 5/5. Large long tail of founder-led assets; succession-driven supply remains strong.
- Integration complexity (inverse-scored): 4/5. Integration is operationally repeatable when a clear tool-stack migration plan exists; primary friction is tool sprawl + service-catalog inconsistency.
- Tech leverage: 4.5/5. Material value can be created via automation, standardization, monitoring, and security tooling embedded into client workflows.
- Pricing power: 4/5. Switching costs + criticality support price realization, especially when tied to security/compliance outcomes.
- Labor risk (inverse-scored): 3/5. Persistent shortage risk for cloud/security engineers; mitigants include nearshoring, automation, and tiered delivery models. External labor indicators (Eurostat vacancy rates; cybersecurity workforce studies) should be used as macro context, but underwriting should be based on actual time-to-hire, wage inflation, and attrition in the platform footprint.
- Exitability: 4.5/5. Deep sponsor-to-sponsor bid stack; strategics also active for scaled assets.
Composite (indicative): 4.3/5.
E. Technology Levers (incl. AI teaser)
Core systems: PSA (e.g., ConnectWise, Autotask), RMM (e.g., NinjaOne, Datto, N-able), ITSM/ticketing, identity/device management, EDR/MDR, SIEM/SOC platforms, documentation/knowledge base.
Automation & AI (value + risk teaser for Part V):
- Opportunity: AI-assisted triage, summarization, and guided remediation can reduce L1/L2 effort, increase first-contact resolution, and improve SLA compliance. Over 12–24 months, AI copilots can shift the labor mix toward fewer L1 tickets per endpoint and higher engineer leverage.
- Threat: If “good enough” AI-driven IT support becomes productized by software vendors/hyperscalers, parts of commodity support risk compression—pushing MSPs to differentiate with security outcomes, compliance, and verticalized offerings.
EBITDA impact (more precise timeline ranges):
- PSA/RMM standardization: typically +150–300 bps EBITDA within ~6–12 months post-migration via utilization discipline, ticket leakage reduction, and billing accuracy (benchmark ranges drawn from operator playbooks and MSP integration case studies; validate per-asset with pre/post KPI baselines).
- Procurement + vendor rationalization: often +100–200 bps within ~6–18 months (licenses, tools, connectivity).
- Automation (scripts + AI triage) + tiered delivery: typically +150–350 bps within ~12–24 months depending on starting maturity and ticket volume profile.
F. Value Creation Playbook (with quantified uplift expectations)
Months 0–12: Foundation (target: +200–400 bps EBITDA)
- Financial integration + unified KPI pack in 30–60 days
- PSA/RMM migration plan signed in first 60 days; execute within 6–9 months
- Centralize procurement + vendor standardization (licenses, security stack)
- Service catalog + SLA normalization; reprice out-of-market legacy contracts
- Establish shared-services NOC (Tier 1) and security baseline (MDR partner or internal SOC-lite)
- Commercial: convert break-fix tails into managed bundles; attach security add-ons
Months 12–36: Scale & Differentiate (target: additional +200–500 bps EBITDA)
- Expand centralized NOC/SOC, 24/7 where justified; introduce tiered support model
- Nearshore Tier 1/2 where culturally/linguistically feasible (CEE hubs) to offset wage pressure
- Verticalize (regulated SMB verticals: healthcare, financial services, industrial) with compliance-aligned bundles
- Productize reporting: client portal dashboards + QBR (quarterly business review) cadence
- Execute bolt-ons (geographic adjacency first; then capability add: security, cloud optimization/FinOps)
G. Buyer Landscape (corrections + sourcing discipline)
Sponsor and strategic interest remains high due to recurring revenue, mission-criticality, and scalable integration playbooks. Competitive processes are most intense for assets with: (i) high contracted recurring revenue; (ii) low concentration; (iii) tool-stack maturity; and (iv) credible security-led upsell.
Corrected deal/date: 3i’s investment in Constellation was announced in May 2024 (not January 2025).
Other buyer notes (avoid unsupported “% of assets PE-backed” claims): A meaningful and growing portion of European MSP platforms are sponsor-owned, but published “share of assets in PE portfolios” estimates are inconsistent and often methodology-dependent. This report treats sponsor saturation as qualitative and recommends tracking it empirically via (i) PE deal databases and (ii) country-level platform mapping during origination (Chapter 7 tools).
Exit dynamics: Secondary exits dominate; strategics (integrators/telecoms) are relevant for scaled, multi-country or security-differentiated platforms.
H. Red Flags & Failure Modes (incl. labor + AI)
- “Managed” revenue that is actually project/break-fix: If a large share is ad hoc, retention and margin stability are overstated.
- Tool-stack sprawl post-acquisition: Failure to standardize PSA/RMM within 6–9 months prevents shared-services leverage and makes KPI comparability impossible.
- Founder-led sales dependency: Underwrite a documented relationship transition plan; require account ownership transfer and multi-threading.
- Labor squeeze without delivery redesign: Wage inflation + scarcity in cloud/security can erase the integration thesis unless mitigated via nearshore, automation, and tiering.
- Paying “platform multiples” without platform attributes: Entry >~12× EBITDA requires defensible differentiation (security outcomes, verticalization, high NRR); otherwise multiple compression risk dominates.
Platform Design Snapshot — IT Managed Services
- Ideal first platform: €10–25M revenue; >75% contracted recurring; demonstrably standardized tool stack (or one clearly dominant); EBITDA >15%; low concentration; security attach opportunity.
- Bolt-on sequencing: geographic adjacency → capability add (security/cloud/FinOps) → vertical depth.
- Centralize vs federate: Centralize procurement, finance, NOC/SOC, tooling governance Day 1; federate account management short-term, then harmonize QBR and pricing governance over 12–18 months.
IC-Ready Insights
- Security is the highest-margin attach path, but only if operationalized. MDR/SOC add-ons raise ARPU and reduce churn; however, underwriting should require (i) attach-rate targets, (ii) delivery capability (partner vs in-house), and (iii) measurable reduction in incident MTTR (mean time to resolve).
- PSA standardization is the integration keystone. Without comparable utilization, SLA, and ticket economics across bolt-ons, buy-and-build becomes multiple arbitrage only—and fragile.
- Endpoint economics beats customer-count economics. Underwrite revenue per endpoint/user/device, ticket volume per endpoint, and gross margin per endpoint as the cross-asset normalization layer.
Mandatory Table — 3.1 IT Managed Services (diligence checklist + benchmarks)
| Target Signal Checklist | Core KPIs | Margin Expansion Levers (with timing) | Technology Maturity Benchmarks |
|---|---|---|---|
| Contracted recurring revenue typically >70% | NRR / GRR (where measurable) | PSA/RMM standardization (+150–300 bps in 6–12 months) | Best-in-class: unified PSA/RMM; client portal; scripted remediation; security baseline |
| Top-10 clients <30% revenue | Revenue per endpoint/user | Vendor consolidation (+100–200 bps in 6–18 months) | Lagging: manual dispatch, spreadsheet billing, heterogeneous tools |
| Documented service catalog + SLAs | Ticket volume per endpoint | Automation + tiering (+150–350 bps in 12–24 months) | Adoption test: >80% delivery staff active daily in PSA |
| Low gross churn (verify) | SLA compliance; MTTR | Nearshore/shared services (+200–400 bps in 12–24 months, context-dependent) | Maturity signal: standardized QBR pack + client-facing dashboards |
| Evidence of security attach headroom | Revenue/FTE | Pricing governance + repricing outliers (case-by-case) | Growth indicator: security revenue share rising (trend > point-in-time) |
3.2 Testing, Inspection & Certification (TIC)
A. Definition & Scope
TIC comprises independent third-party services verifying product/asset quality, safety, performance, and regulatory compliance. In scope: laboratory testing (food, environmental, materials, electronics), field inspection (industrial assets, infrastructure, construction), and certification/audit services (ISO systems, product certifications, ESG assurance). Out of scope: in-house QA, first-party testing, and pure engineering consulting without conformity assessment.
Where “tech-enabled” shows up: LIMS-enabled throughput, digital chain-of-custody, client portals, automated reporting/certificates, remote inspection (drones/IoT), and analytics on accumulated test data.
B. Market Size, Growth, and Fragmentation (with explicit reconciliation)
Chapter 2 cross-reference: Ch2 Table 2.1.2 indicates ~€55–70B gross European TIC with ~€40–55B TEBS-eligible (excluding internal testing and parts of advisory-only work).
Published estimates diverge primarily due to:
- whether “TIC” includes broader engineering services,
- whether it includes government lab activity,
- different geographic definitions (EU vs Europe).
This module retains the Ch2 working ranges and cites two commonly referenced syndicated estimates as boundary markers.
Concentration: The largest global groups (e.g., SGS, Bureau Veritas, Intertek, DEKRA, TÜV groups) represent meaningful share at the top end, but the market fragments quickly into specialist labs and niche inspection bodies—particularly in food, environmental, renewables, and local regulatory niches.
Corrected consolidation fact (Eurofins acquisitions): The prior draft incorrectly stated Eurofins completed “378 acquisitions since 2015.” Deal databases such as Tracxn and Mergr track materially fewer acquisitions (e.g., on the order of ~80–100+ depending on database coverage and definition), and Mergr’s figure typically reflects total tracked acquisitions rather than “since 2015”. The investable takeaway remains: Eurofins is an active consolidator—but the consolidation intensity must not be overstated.
C. Typical Target Profile
| Attribute | Typical Range |
|---|---|
| Revenue | €5–50M (lab or inspection business unit) |
| EBITDA margin | 12–18% (niche labs can be higher; field inspection often lower) |
| Ownership | Founder/family-owned; corporate carve-outs present |
| Geography | Single-country; sometimes single lab/hub |
| Recurring revenue | 50–75% (re-testing cycles, monitoring, certification renewals) |
| Accreditations | ISO 17025/17020; Notified Body (high value where applicable) |
D. Buy-and-Build Attractiveness (six-dimension rubric)
- Fragmentation: 3.5/5. Fragmented beneath the top tier; accreditation creates barriers and reduces “random bolt-on” volume.
- Integration complexity (inverse-scored): 3/5. Quality systems, accreditation continuity, and LIMS harmonization add time and risk.
- Tech leverage: 3.5/5. LIMS, automation, remote inspection, and data productization can move economics, but capex/quality constraints limit speed.
- Pricing power: 4/5. Compliance urgency, accreditation scarcity, and risk transfer support pricing—especially in regulated niches.
- Labor risk (inverse-scored): 3.5/5. Talent is specialized (lab techs, auditors, inspectors). Risk varies by niche; mitigate via training academies and standardized SOPs.
- Exitability: 4.5/5. Strategics and large sponsor-backed platforms actively acquire scaled or niche-differentiated assets.
Composite (indicative): 3.7/5.
E. Technology Levers (incl. AI teaser)
Core systems: LIMS (e.g., LabWare, STARLIMS), audit/certification workflow tools, scheduling and chain-of-custody, client portals, instrument connectivity.
Automation & AI (Part V teaser):
- Opportunity: AI-assisted defect recognition (imaging), anomaly detection on sensor streams, automated report drafting, and predictive maintenance inspection schedules.
- Threat: Basic reporting/certificate issuance may commoditize; value shifts toward accredited judgment, complex testing, and data interpretation.
EBITDA impact (more precise timelines):
- LIMS standardization + digital chain-of-custody: typically supports throughput +15–25% and ~+150–300 bps EBITDA over ~12–24 months (dependent on starting fragmentation and revalidation needs).
- Remote inspection / reduced travel: where technically/regulatorily accepted, can reduce travel costs and improve inspector utilization, often visible in ~12–36 months rather than immediate.
F. Value Creation Playbook (with quantified uplift expectations)
Months 0–12: Foundation (target: +100–250 bps EBITDA)
- KPI pack by lab/line-of-business; establish contribution margin view
- Quality/accreditation governance centralization (non-negotiable)
- Procurement consolidation (reagents, calibration, consumables)
- Launch cross-sell of adjacent test categories to existing client base
- Define LIMS strategy (single target architecture; migration sequencing)
Months 12–36: Scale & Differentiate (target: additional +150–400 bps EBITDA)
- Execute LIMS harmonization and client portal rollout
- Bolt-on specialist labs (ESG-related testing, renewables, food safety niches)
- Remote inspection pilots (drones/IoT) where accepted; standardize method statements
- Productize datasets: benchmarking, predictive analytics, “assurance subscriptions”
G. Buyer Landscape (with defensible comps approach)
Buyer set: global strategics (SGS, Bureau Veritas, Intertek, Eurofins), sponsor-backed platforms (e.g., large assurance groups), and regional specialists.
Valuation anchoring (avoid over-precision):
- Public TIC comparables often trade in the low-to-mid teens EV/EBITDA in normal markets (multiple moves with rates and growth). Public comps are a reference, not a proxy for mid-market private assets.
- Mid-market platform deals typically price on: niche defensibility (accreditations), recurring testing cycles, and integration credibility. Rather than asserting a single “entry/exit multiple,” diligence should triangulate: (i) public comps; (ii) recent disclosed transaction commentary where available; and (iii) banker/fund advisor ranges (Chapter 7 methodology).
Sources for market context: public company reporting and TIC market overviews.
H. Red Flags & Failure Modes (incl. AI + capex)
- Accreditation continuity risk: Integration disrupting quality management can trigger accreditation findings, delayed renewals, or client loss.
- Hidden capex: Lab instruments, calibration, facility upgrades can be structurally higher than pure services; underwrite maintenance capex explicitly.
- LIMS fragmentation: Multiple LIMS blocks group-level analytics, cross-selling, and operational standardization.
- Customer concentration in a regulated niche: One anchor client in food/industrial can dominate volumes.
- AI “automation” without validation controls: AI-assisted defect recognition must be validated under quality regimes; otherwise it creates compliance risk.
Platform Design Snapshot — TIC
- Ideal first platform: €15–40M revenue; 2–3 accredited labs; niche vertical focus; EBITDA >15%; strong data integrity and chain-of-custody.
- Bolt-on sequencing: vertical adjacency first (add test types) → geographic expansion → remote inspection / ESG assurance capability.
- Centralize vs federate: Centralize quality/accreditation governance, procurement, LIMS architecture, and commercial reporting; federate technical operations under standardized SOPs.
IC-Ready Insights
- Accreditation is both moat and integration constraint. It raises barriers and supports pricing, but forces disciplined integration sequencing (quality governance first, then systems).
- The highest-quality roll-ups are “niche depth” plays, not breadth plays. Competing with the global generalists on breadth is rarely an optimal mid-market thesis.
- Data can become the product—if designed intentionally. The path to multiple expansion is not only “more labs,” but “better client workflow + better insight,” turning episodic testing into ongoing assurance.
Mandatory Table — 3.2 TIC
| Target Signal Checklist | Core KPIs | Margin Expansion Levers (with timing) | Technology Maturity Benchmarks |
|---|---|---|---|
| ISO 17025/17020 in place; audit history clean | Turnaround time (sample → report) | LIMS harmonization (+150–300 bps in 12–24 months, context-dependent) | Best-in-class: unified LIMS; chain-of-custody; digital certificates; client portal |
| Recurring re-test/certification cycles | EBITDA by service line | Procurement consolidation (+100–200 bps in 6–18 months) | Lagging: paper-based, manual reporting, standalone lab systems |
| Niche defensibility (method, geography, accreditation scarcity) | Utilization (equipment/inspectors) | Remote inspection (where permitted) (benefits typically in 12–36 months) | Adoption: majority of tests processed end-to-end in LIMS |
| Customer concentration understood and mitigated | Revenue concentration (top 10) | Cross-sell adjacent test types (revenue + stickiness) | Maturity signal: portal usage + automated client notifications |
| Capex discipline + calibration program | Rework / nonconformance rates | Shared services (quality, finance) | Growth indicator: ESG/assurance lines growing (trend) |
3.3 Professional Staffing & Recruitment (specialist staffing, RPO/MSP-enabled)
A. Definition & Scope
Professional Staffing & Recruitment covers agencies placing temporary/contract and permanent talent into client organizations, including specialist verticals (IT, engineering, finance, healthcare, life sciences). In scope: contingent staffing, RPO, managed service programs (MSP), and VMS-integrated delivery. Out of scope: pure job boards, marketplaces without employer-of-record responsibility, and non-enabled micro-agencies where technology is not material to delivery economics.
TEBS boundary: The TEBS-eligible portion is the segment where tech/workflow is meaningfully embedded (ATS/CRM discipline, VMS integration, RPO workflow tooling, analytics, automation). This is the investable line used in Chapter 2.
B. Market Size, Growth, and Fragmentation (explicit linkage to Ch2)
Chapter 2 cross-reference: Ch2 Table 2.1.2 frames gross European staffing at roughly €100–130B (definition-dependent) with TEBS-eligible subset ~€25–40B, reflecting the narrower perimeter (RPO/MSP/VMS-enabled and specialist models).
Growth/cyclicality: Staffing is materially macro-sensitive; the most resilient segments are (i) regulated/scarce skill niches and (ii) embedded RPO/MSP contracts with longer durations. Industry commentary and research (e.g., Staffing Industry Analysts) typically emphasize low single-digit growth in mature European markets with meaningful cross-country variation.
Fragmentation: Extremely high; long tail of €1–15M revenue agencies. Consolidation works best when it changes the model from “relationship-only placements” to “process + tooling + embedded contracts.”
C. Typical Target Profile
| Attribute | Typical Range |
|---|---|
| Revenue | €5–40M (high pass-through; diligence on gross profit) |
| Gross margin | ~12–18% (generalist temp) to ~18–30% (specialist/perm-heavy) |
| EBITDA margin | ~3–8% on revenue; ~15–30% on gross profit (more informative) |
| Ownership | Founder-led; often lean/lifestyle operational posture |
| Geography | Single city/country; vertical niche focus |
| Working capital | Material: payroll timing vs client DSO is core risk |
D. Buy-and-Build Attractiveness (six-dimension rubric)
- Fragmentation: 5/5. Enormous long tail; plentiful targets.
- Integration complexity (inverse-scored): 3/5. Back-office integrates; revenue integrates only if recruiter retention and brand positioning are handled carefully.
- Tech leverage: 2/5. Tech improves productivity but rarely creates hard switching costs comparable to MSP/TIC.
- Pricing power: 2.5/5. Often constrained by client procurement and commoditization; stronger in scarce-skill niches.
- Labor risk (inverse-scored): 2/5. Double exposure: (i) availability of placed talent (market-wide) and (ii) retention of recruiters/consultants (firm-level). Wage inflation and vacancy tightness in key sectors (ICT, healthcare) can create both opportunity (demand) and operational strain (delivery capacity). Use Eurostat vacancy rates and local wage indices as macro inputs, but underwrite to recruiter attrition, time-to-fill, and contractor churn.
- Exitability: 3/5. Exits exist, but multiple expansion requires demonstrable shift to embedded, tech-enabled delivery (RPO/MSP) and reduced key-person risk.
Composite (indicative): 3.2/5.
E. Technology Levers (incl. AI threat/opportunity)
Core systems: ATS/CRM (e.g., Bullhorn, Vincere), VMS integration (e.g., SAP Fieldglass), workforce management, timesheet + billing automation.
AI teaser (Part V bridge):
- Opportunity: AI can improve sourcing speed, candidate engagement, and recruiter throughput; analytics can strengthen client value prop.
- Threat: AI-driven screening and internal talent marketplaces can disintermediate parts of the traditional recruiter function, especially in commoditized perm hiring. The defensible staffing model is therefore embedded + process-driven + compliance-heavy (RPO/MSP, regulated verticals), not “CV matching.”
EBITDA impact (realistic, not overstated):
- ATS/CRM discipline + automation typically supports +50–150 bps EBITDA within ~6–12 months through productivity and billing accuracy.
- The larger uplift comes from mix shift: increasing embedded RPO/MSP share can support +200–400 bps over ~12–36 months, but requires sales capability and delivery maturity.
F. Value Creation Playbook (with quantified uplift expectations)
Months 0–12: Foundation (target: +50–150 bps EBITDA; reduce risk)
- Standardize ATS/CRM usage; enforce data hygiene and pipeline reporting
- Centralize payroll, compliance admin, and billing to reduce error leakage
- Implement recruiter retention plan (equity/earn-out design + career framework)
- Tighten working capital: invoicing cadence, credit control, DSO governance
Months 12–36: Scale & Differentiate (target: +200–400 bps EBITDA via mix shift)
- Build/expand RPO/MSP offering with repeatable delivery playbooks
- Develop VMS-integration muscle and client dashboards (time-to-fill, quality-of-hire proxies)
- Expand into adjacent scarce-skill verticals; cross-sell to existing accounts
- Create nearshore sourcing pods (where legal/market structure supports it)
G. Buyer Landscape (and valuation discipline)
Buyers include strategic consolidators and PE. Valuation is highly dependent on (i) specialization, (ii) contract duration/embeddedness, (iii) customer diversification, and (iv) recruiter bench depth.
Valuation anchoring: Avoid revenue multiples. Underwrite on gross profit, gross profit per recruiter, and cash conversion. Market ranges are best used as sanity checks; the underwriting case should stand without assuming multiple expansion.
H. Red Flags & Failure Modes (incl. labor + AI)
- Revenue vs gross profit confusion: A “€50M revenue” agency can be a small economic engine if GP% is thin.
- Key-recruiter dependency: If a small number of consultants drive the majority of GP, retention risk is existential.
- Working capital trap: Temp staffing payroll timing can force expensive facilities or equity injections if DSO deteriorates.
- Cyclical exposure concentration: Heavy exposure to one macro-sensitive vertical increases drawdown risk.
- AI-washing: Verify measurable uplift (time-to-fill, outreach conversion, recruiter productivity), not tool logos.
Platform Design Snapshot — Professional Staffing
- Ideal first platform: Specialist vertical; demonstrably strong GP%; diversified recruiter bench; evidence of embedded RPO/MSP traction; disciplined working capital.
- Bolt-on sequencing: vertical adjacency → geographic adjacency → capability (RPO/MSP + VMS).
- Centralize vs federate: Centralize payroll/compliance/billing and data; federate sales/recruiter relationships while standardizing process and reporting.
IC-Ready Insights
- The “tech-enabled” staffing winner is embedded, not transactional. RPO/MSP plus analytics is the closest staffing gets to workflow embedding.
- Recruiter retention is the integration thesis. No retention plan = no synergy realization.
- Staffing buy-and-build is a cash management business. Working capital governance is a primary value-creation lever, not an accounting detail.
Mandatory Table — 3.3 Professional Staffing
| Target Signal Checklist | Core KPIs | Margin Expansion Levers (with timing) | Technology Maturity Benchmarks |
|---|---|---|---|
| Specialist niche with defensible GP% | GP% and GP per recruiter | ATS discipline + billing automation (+50–150 bps in 6–12 months) | Best-in-class: ATS/CRM adoption, VMS integration, client dashboards |
| Evidence of embedded contracts (RPO/MSP) | Time-to-fill; fill rate | Mix shift to RPO/MSP (+200–400 bps in 12–36 months) | Lagging: spreadsheet pipelines, manual invoicing |
| Recruiter bench depth; low key-person concentration | Recruiter attrition; productivity | Shared services (payroll/compliance) (+100–200 bps, case-dependent) | Adoption: high ATS usage + standardized funnel stages |
| Working capital under control | DSO; cash conversion | Credit control + invoicing cadence (cash uplift) | Maturity signal: measurable outreach → interview → placement analytics |
| Client diversification | Client concentration | Pricing discipline in scarce-skill niches | Growth indicator: embedded revenue share rising (trend) |
3.4 Compliance, Regulatory & Advisory Services (RegTech-enabled services)
A. Definition & Scope
Compliance, Regulatory & Advisory Services includes specialist advisory, monitoring, and reporting services helping organizations meet regulatory obligations across financial services, data privacy, ESG, H&S, AML, and sector-specific compliance. In scope: RegTech-enabled advisory, compliance outsourcing, regulatory reporting services, internal audit outsourcing, monitoring subscriptions. Out of scope: large management consulting, law firms providing legal advice, and pure-play GRC software vendors.
Where “tech-enabled” shows up: Workflow-embedded monitoring portals, automated regulatory change tracking, standardized reporting engines, and “compliance-as-a-service” subscriptions.
B. Market Size, Growth, and Fragmentation (explicit linkage to Ch2)
Chapter 2 cross-reference: Ch2 Table 2.1.2 uses ~€15–25B TEBS-eligible for Europe for compliance services where technology is a material delivery lever (distinct from pure consulting and distinct from pure software).
Published figures often cite GRC platform software growth (not services), which is useful context but not a direct proxy for the services TAM. This module therefore treats software market reports as adjacent indicators and anchors investable services sizing to the TEBS-eligible framing in Ch2.
Fragmentation: High in the mid-market: many boutique firms (2–50 employees), often founder-led by ex-regulators or ex-Big Four specialists. Enterprise spend is dominated by large consultancies, but mid-market demand is broadening with expanding regulatory scope (e.g., DORA, CSRD assurance ecosystem, AI governance).
C. Typical Target Profile
| Attribute | Typical Range |
|---|---|
| Revenue | €2–20M |
| EBITDA margin | 15–25% (higher when productized/recurring) |
| Ownership | Founder-led; ex-Big Four/regulatory specialists |
| Geography | Single country; often domain-specific |
| Recurring revenue | 40–70% (retainers, monitoring, annual cycles) |
| Differentiator | Domain expertise + workflow tooling + templates |
D. Buy-and-Build Attractiveness (six-dimension rubric)
- Fragmentation: 4.5/5. Large long tail; institutionalization still limited.
- Integration complexity (inverse-scored): 3.5/5. Integration is manageable if you preserve domain leadership and standardize tooling/templates; risk is cultural/knowledge attrition.
- Tech leverage: 4/5. Productization and portals can credibly change unit economics and exit narrative.
- Pricing power: 4/5. Regulatory urgency + risk transfer supports value-based pricing when outcomes are clear.
- Labor risk (inverse-scored): 3/5. Specialized senior talent is scarce; mitigation via training pipelines, standardized delivery templates, and tiered teams.
- Exitability: 4/5. Strong sponsor appetite for “services with software characteristics,” especially if recurring and productized.
Composite (indicative): 4.0/5.
E. Technology Levers (incl. AI teaser)
Core systems: GRC tools (e.g., ServiceNow GRC, OneTrust), regulatory change tools (e.g., CUBE), monitoring dashboards, reporting engines, client portals.
AI teaser (Part V bridge):
- Opportunity: NLP-driven regulatory horizon scanning, automated control mapping, draft report generation, and client self-serve queries can reduce manual effort and increase stickiness.
- Threat: Clients may adopt general-purpose AI internally for basic regulatory summarization; defensibility shifts toward (i) accountability, (ii) audit-ready evidence, (iii) domain interpretation, and (iv) operating model execution.
EBITDA impact (more precise):
- Productizing into subscription monitoring + standardized reporting can drive +300–600 bps EBITDA within ~12–24 months, if pricing and delivery are redesigned (not just “tool added”).
- Template reuse and tiered staffing can reduce delivery hours per engagement materially; verify with utilization/time-writing data.
F. Value Creation Playbook (with quantified uplift expectations)
Months 0–12: Foundation (target: +150–300 bps EBITDA)
- Standardize methodologies, templates, and quality review
- Implement shared tooling layer (reg-change + reporting engine)
- Convert suitable project work into retainers (monitoring, recurring reporting)
- Build cross-sell motion across 2–3 domains (e.g., privacy + ESG + financial compliance)
Months 12–36: Scale & Differentiate (target: additional +200–500 bps EBITDA)
- Launch client portal (evidence repository, dashboards, automated alerts)
- Develop compliance-as-a-service subscriptions with tiered pricing
- Acquire adjacent specialist boutiques to broaden domain coverage
- Expand geographically with a consistent productized “core”
G. Buyer Landscape
Buyer archetypes include software-adjacent PE for RegTech-enabled platforms and services-focused PE for roll-ups. Strategics include large consultancies and software vendors seeking services distribution.
Valuation discipline: The exit multiple is primarily a function of (i) recurring revenue quality, (ii) workflow embedding (portal usage, NRR), and (iii) scalability of delivery (templates, tiering). “Advisory-only” remains priced like people-services.
H. Red Flags & Failure Modes (incl. AI)
- Key-person dependency disguised as a firm: If one senior individual holds client trust and delivery quality, the asset is not platformable without retention and bench build.
- “Portal” that is a file dump: Workflow embedding requires active usage, alerts, and evidence workflows—not PDFs in a login.
- Over-concentration in one regulation/domain: Regulatory focus can be a wedge, but single-domain dependence increases commoditization risk.
- Scope creep into legal advice: Creates liability/licensing constraints.
- AI without governance: Using AI in compliance deliverables requires strict controls, audit trails, and confidentiality safeguards.
Platform Design Snapshot — Compliance/Regulatory
- Ideal first platform: €5–15M revenue; >50% recurring; demonstrable tooling/portal; 2–3 adjacent domains; EBITDA >18%; low client concentration.
- Bolt-on sequencing: domain add → geographic expansion → deeper productization.
- Centralize vs federate: Centralize tooling, templates, training, QA Day 1; federate client relationships initially with structured cross-sell incentives.
IC-Ready Insights
- Regulation creates “ratchet” demand. New rules expand scope inside existing accounts—supporting organic growth even in softer macro periods.
- Productization is the multiple-expansion engine. “Compliance-as-a-service” with measurable usage and NRR is the clearest bridge to TEBS premium multiples.
- Bundling increases switching costs. Multi-domain coverage (e.g., privacy + financial + ESG) increases wallet share and makes replacement harder.
Mandatory Table — 3.4 Compliance, Regulatory & Advisory
| Target Signal Checklist | Core KPIs | Margin Expansion Levers (with timing) | Technology Maturity Benchmarks |
|---|---|---|---|
| Recurring/retainer revenue meaningful | Recurring share; NRR (if tracked) | Project → retainer conversion (+200–400 bps in 12–24 months) | Best-in-class: portal + automated reg-change + evidence workflows |
| Multi-domain capability | Revenue per consultant | Template reuse + tiering (+200–400 bps, case-dependent) | Lagging: bespoke PowerPoints, email-driven delivery |
| Tooling beyond office suite | Utilization; realization | Productized subscriptions (+300–600 bps in 12–24 months) | Adoption: client logins + alert usage (measurable) |
| Bench depth beyond founders | Client retention | Shared services (QA/training) | Maturity signal: audit-ready evidence trail in tooling |
| Client concentration controlled | Pipeline visibility | Cross-sell across domains | Growth indicator: subscription line growing faster than advisory |
3.5 Healthcare Services (Clinical, Dental, Veterinary Groups)
A. Definition & Scope
Healthcare Services (TEBS context) covers outpatient, commercially oriented clinic groups amenable to consolidation: dental groups (DSOs/DPOs), veterinary practices, ophthalmology/dermatology, physiotherapy/rehab, and fertility clinics. Out of scope: hospitals, heavily state-controlled primary care models where commercial levers are limited, and pharma/devices.
Where “tech-enabled” shows up: PMS/EHR, digital imaging, centralized scheduling/billing, patient portals, recall automation, and emerging AI-assisted diagnostics and triage.
B. Market Size, Growth, and Fragmentation (explicit linkage to Ch2)
Chapter 2 cross-reference: Ch2 Table 2.1.2 sizes the TEBS-eligible subset at ~€20–30B, reflecting the private-pay and consolidation-ready segments rather than the full gross spend across healthcare delivery.
Gross market figures for dental/vet vary widely depending on inclusion of public reimbursement, ancillary retail, and country coverage; this module keeps the TEBS-eligible lens and treats broader gross estimates as context only.
Fragmentation: Extremely high across Europe: single-site practices dominate in many countries; corporate penetration varies materially by geography and specialty. Fragmentation enables volume-based roll-ups, but value creation depends on clinician retention and operational standardization.
Labor context (more granular, Part VI bridge): Healthcare services face a structural labor constraint: clinician availability (dentists, vets, specialists) and burnout/attrition are central risks. Sponsors should track (i) time-to-hire by role, (ii) wage inflation, (iii) utilization constraints (chair/room capacity), and (iv) clinician churn at each location as leading indicators. Macro datasets (e.g., Eurostat vacancies) can contextualize pressure, but the underwriting must be built from clinic-level capacity and retention.
C. Typical Target Profile
| Attribute | Typical Range |
|---|---|
| Revenue | €1–10M per clinic; platforms often €20–100M+ |
| EBITDA margin | 15–25% (dental/vet typical); 20–30% (some specialist clinics) |
| Ownership | Solo practitioner / small partnership |
| Geography | Highly local |
| Recurring revenue | 40–60% (recall cycles, wellness plans) |
| Key-person risk | High (principal clinician often drives retention) |
D. Buy-and-Build Attractiveness (six-dimension rubric)
- Fragmentation: 5/5. Very large pool of single-site targets.
- Integration complexity (inverse-scored): 2.5/5. Integration risk is clinician retention + regulatory variance + PMS migration disruption.
- Tech leverage: 2.5/5. Tech improves conversion and utilization, but clinical delivery remains human-capacity constrained.
- Pricing power: 3.5/5. Stronger with high private-pay mix, differentiated specialties, and strong local brand; weaker in reimbursement-capped models.
- Labor risk (inverse-scored): 2.5/5. Structural clinician shortages and burnout risk; mitigants include clinician value proposition, career pathways, scheduling support, and centralized admin load reduction.
- Exitability: 3.5/5. Active buyer universe, but exits depend on demonstrated clinical governance, retention, and sustainable margins (not just multiple arbitrage).
Composite (indicative): 3.6/5.
E. Technology Levers (incl. AI teaser)
Core systems: PMS/EHR, digital imaging, centralized billing/scheduling, patient communication tools (online booking, reminders), procurement systems.
AI teaser (Part V bridge):
- Opportunity: AI-assisted diagnostics (imaging support), triage, and automated patient communication can improve conversion and reduce no-shows.
- Threat: AI is unlikely to replace clinicians, but it may shift competitive advantage toward groups that (i) deploy tech safely under clinical governance and (ii) translate it into higher utilization and better patient experience.
EBITDA impact (more precise):
- Central procurement: commonly +200–500 bps EBITDA within ~6–12 months (varies by purchasing baseline, scale, and category mix).
- Recall/booking automation: can improve chair utilization and reduce no-shows; benefit often visible within ~3–9 months once workflows are adopted.
- Digital workflows (e.g., scanning/CAD-CAM in dental): can reduce lab costs and increase throughput, but capex and adoption curve typically mean ~12–24 months to full effect.
F. Value Creation Playbook (with quantified uplift expectations)
Months 0–12: Foundation (target: +200–500 bps EBITDA, primarily procurement + admin)
- Centralize procurement, billing, payroll, and finance
- Implement patient recall + booking automation; reduce no-shows
- Standardize core PMS reporting and KPI cadence (chair utilization, revenue/clinician)
- Clinician retention package: equity/earn-outs + reduced admin burden + clinical autonomy protections
- Introduce or optimize wellness plans where market supports
Months 12–36: Scale & Differentiate (target: additional +100–300 bps EBITDA + growth)
- Bolt-ons to build geographic density (clusters enable shared staffing/specialists)
- Shared specialist model (traveling specialists) to lift revenue per site
- Invest selectively in digital imaging/equipment with ROI governance
- Build referral networks and service-line expansion (implants/ortho; vet referral/emergency)
- Develop patient portal + centralized marketing to reduce CAC and improve retention
G. Buyer Landscape (and comp discipline)
Buyers include healthcare-specialist PE, generalist mid-market funds, and strategics in certain specialties. Activity remains high, but asset quality bifurcates: groups with governance, retention, density, and data discipline attract premium demand.
Valuation anchoring: Multiples vary widely by country, specialty, and private-pay ratio. Rather than asserting a single “standard” multiple, underwriting should explicitly model:
- clinician retention sensitivity,
- reimbursement vs private-pay mix,
- capex needs (equipment refresh),
- site-level margin dispersion and the ability to standardize.
H. Red Flags & Failure Modes (incl. labor)
- Clinician churn post-acquisition: Often the single biggest destroyer of value; losing a principal clinician can collapse local demand.
- Overexposure to reimbursement-capped revenue: Pricing pressure + political risk; private-pay ratio is a core diligence screen.
- Integration capacity mismatch: “Collecting clinics” without central systems and procurement is not a platform.
- Over-leverage on multiple arbitrage: If exit multiples compress, returns depend entirely on operational delivery.
- Burnout and staffing constraints: Underwrite realistic capacity growth; operational fixes must reduce clinician admin load and improve scheduling, not just add locations.
Platform Design Snapshot — Healthcare Services
- Ideal first platform: Multi-site cluster (5–10 locations); strong management layer; high private-pay mix; demonstrable retention; KPI discipline; EBITDA resilience.
- Bolt-on sequencing: density within a region → specialist add-ons → adjacent regions (avoid premature cross-border complexity).
- Centralize vs federate: Centralize procurement, billing, marketing, IT systems, and reporting Day 1; federate clinical decision-making under clear governance.
IC-Ready Insights
- Private-pay mix is the fastest proxy for pricing power and multiple resilience. It also correlates with the ability to invest in patient experience and equipment ROI.
- Wellness/recall is “recurring revenue,” but must be operationally measured. Track enrollment, churn, visit frequency, and utilization impact—not just “plan offered.”
- Density beats geography count. Cluster economics (shared staffing, referrals, marketing efficiency) are more reliable than cross-border expansion synergies.
Mandatory Table — 3.5 Healthcare Services
| Target Signal Checklist | Core KPIs | Margin Expansion Levers (with timing) | Technology Maturity Benchmarks |
|---|---|---|---|
| High private-pay share; pricing flexibility | Revenue per clinician; per chair/room | Procurement (+200–500 bps in 6–12 months) | Best-in-class: unified PMS reporting, online booking, digital imaging, recall automation |
| Multi-site cluster with management layer | Chair/room utilization; no-show rate | Recall + scheduling automation (benefits in 3–9 months) | Lagging: manual scheduling, weak KPI visibility |
| Low clinician churn; retention plan | Clinician churn; time-to-hire | Shared services admin load reduction (case-dependent) | Adoption: majority sites on unified KPI cadence |
| Clear clinical governance | Site-level EBITDA dispersion | Digital workflow ROI (often 12–24 months) | Maturity signal: patient portal + automated comms |
| Evidence of referral pathways | Patient retention; new patient CAC | Specialist services + referrals (growth + mix) | Growth indicator: utilization rising without clinician burnout |
Cross-Module Comparison (Modules 3.1–3.5) — Six-Dimension Rubric Alignment
| Sub-Sector | Fragmentation | Integration Complexity* | Tech Leverage | Pricing Power | Labor Risk* | Exitability | Composite (indicative) |
|---|---|---|---|---|---|---|---|
| 3.1 IT Managed Services | 5.0 | 4.0 | 4.5 | 4.0 | 3.0 | 4.5 | 4.3 |
| 3.2 TIC | 3.5 | 3.0 | 3.5 | 4.0 | 3.5 | 4.5 | 3.7 |
| 3.3 Professional Staffing | 5.0 | 3.0 | 2.0 | 2.5 | 2.0 | 3.0 | 3.2 |
| 3.4 Compliance/Regulatory | 4.5 | 3.5 | 4.0 | 4.0 | 3.0 | 4.0 | 4.0 |
| 3.5 Healthcare Services | 5.0 | 2.5 | 2.5 | 3.5 | 2.5 | 3.5 | 3.6 |
*Integration Complexity and Labor Risk are inverse-scored: higher = more attractive / lower risk (per Chapter 1 rubric).
Key observations (updated for credibility and rubric consistency):
- MSPs lead this cohort due to high tech leverage, repeatable integration, and exit depth—but underwriting must explicitly model labor scarcity and tool-stack standardization, not assume them away.
- Compliance/Regulatory is the “quiet compounder.” It can look like advisory on entry, but productization and workflow embedding can credibly change exit outcomes; AI strengthens this only when governance and auditability are designed in.
- Staffing and Healthcare remain high-dealflow but higher-execution-risk arenas. Both depend heavily on labor capacity and retention; tech helps, but does not fully decouple growth from people constraints.
- TIC is attractive when niche depth is clear. Accreditation creates defensibility and pricing power, but raises integration complexity and imposes capex/quality governance discipline.
Chapter 4: Sub-Sector Deep Dives (Modules 3.6–3.10): Recurrence, Workflow Embedding, and Scalable Delivery Models
This chapter delivers the second set of five standalone sub-sector modules, following the identical A–H structure and mandatory table format established in Chapter 1 (Section 1.6.1) and demonstrated in Chapter 3. The five sub-sectors—Financial Back-Office & Fund Administration, Engineering & Technical Consulting, Facilities Management & Building Services, Marketing Services & Digital Agencies, and Education & Training Services—collectively illustrate the central tension of mid-market TEBS investing: the difference between project revenue (episodic, scope-defined, and often margin-volatile) and embedded recurring services (contracted, workflow-integrated, and multiple-forming).
Chapter 2 cross-reference: These five sub-sectors span the services-to-software continuum from position ~1.5 (Facilities Management) to ~3.7 (Fund Administration), with most occupying the hybrid or emerging-tech band (2.0–3.0). For each module, we identify where technology is table-stakes (ERP, PSA, CRM, CAFM, LMS) versus where it acts as a genuine differentiator (analytics, automation, vertical workflow tools)—the distinction that separates "professionalised services group" exit narratives from "technology-powered platform" multiples.
Labor emphasis (Part VI bridge): Each module includes a granular labor diagnostic, identifying which labor constraints are structural versus cyclical and how sponsors can mitigate them through utilization management, standardised delivery, near/offshoring, or credentialing pipelines—without drifting into regulatory detail.
Each module includes: (i) a mandatory diligence-ready table; (ii) a Platform Design Snapshot; (iii) IC-ready insights; (iv) a Bolt-on Thesis Library; and (v) a Pricing Power Diagnostic.
3.6 Financial Back-Office & Fund Administration
A. Definition & Scope
Financial Back-Office & Fund Administration covers outsourced operational services to asset managers, fund sponsors, corporates, and financial institutions: fund accounting, NAV calculation, investor reporting, transfer agency, regulatory filings, corporate secretarial, management company services, and treasury/payroll processing. In scope: third-party fund administration (PE, RE, infrastructure, hedge, UCITS), corporate accounting outsourcing, and financial process outsourcing (F&A BPO). Out of scope: front-office investment management, pure-play audit/tax advisory, and banking infrastructure.
Where "tech-enabled" shows up: Automation is streamlining private equity operations, from fund accounting to reporting. Cloud-based accounting platforms, investor portals, capital-call automation, waterfall modelling engines, RPA for reconciliation, and increasingly AI-assisted data extraction and reporting template generation are embedded in delivery. Fund administration is no longer a back-office afterthought; it is a strategic lever that can accelerate growth, unlock investor confidence, and safeguard firms in a fast-moving regulatory environment.
B. Market Size, Growth, and Fragmentation
Chapter 2 cross-reference: Ch2 Table 2.1.2 frames this sub-sector at ~€25–35B gross with ~€20–30B TEBS-eligible (the outsourced, tech-enabled portion).
Growth is driven by (i) the secular trend toward outsourcing: outsourcing private equity fund administration has become an industry standard; (ii) rising LP expectations for transparency and independent oversight: limited partners play an increasingly significant role in shaping outsourcing strategies, especially when dealing with new or expanding managers. LPs tend to favor managers who outsource core functions like fund administration, tax and cybersecurity; and (iii) growing fund complexity (multi-jurisdictional vehicles, ESG reporting, hybrid structures).
Fragmentation: Moderate-to-high. The top tier is concentrated (State Street, BNY, SS&C, Citco, Apex, TMF, Alter Domus), but the mid-market is fragmented—particularly in specialist niches (PE/VC admin, real assets, corporate F&A) and in jurisdictions where local expertise creates defensibility (Luxembourg, Ireland, Channel Islands, Netherlands).
C. Typical Target Profile
| Attribute | Typical Range |
|---|---|
| Revenue | €5–50M |
| EBITDA margin | 18–30% (higher in established, scaled platforms) |
| Ownership | Founder-led; PE-backed first-generation platforms; corporate spin-offs |
| Geography | Single jurisdiction (often Lux, IE, UK, NL); cross-border possible |
| Recurring revenue | 75–95% (annual retainers + AUM/NAV-linked fees) |
| Key differentiator | Asset-class depth, portal quality, jurisdictional licensing |
D. Buy-and-Build Attractiveness (six-dimension rubric)
- Fragmentation: 3.5/5. Concentrated at top; moderate fragmentation in mid-market specialist niches.
- Integration complexity (inverse-scored): 3/5. Systems harmonisation (fund accounting platforms), regulatory licensing continuity, and data migration complexity are meaningful.
- Tech leverage: 4.5/5. Automation, portals, and AI-assisted reporting can materially reduce cost-to-serve and increase switching costs.
- Pricing power: 4/5. High switching costs; migration risk creates stickiness; compliance urgency supports value-based pricing.
- Labor risk (inverse-scored): 3.5/5. Specialised accountants/administrators are in demand; mitigated by nearshore delivery centres and automation.
- Exitability: 4.5/5. Deep strategic and sponsor interest; proven exit paths (secondary, strategic consolidation).
Composite (indicative): 3.9/5.
Justification: Fund administration scores highly on tech leverage, exitability, and pricing power due to workflow embedding and regulatory switching costs. Integration complexity and moderate fragmentation (relative to MSPs or staffing) temper the composite slightly. The strongest thesis is a niche-first platform (e.g., alternatives admin in a specific jurisdiction) with bolt-on expansion into adjacent asset classes and geographies.
E. Technology Levers (incl. AI teaser)
Table-stakes: Fund accounting platforms (eFront, Investran/FIS, Allvue, Geneva), investor portal, capital-call automation, basic reconciliation tools.
Differentiators: Early adopters are already reclaiming days from quarter-end close cycles. A public UiPath case study illustrates the scale: after layering RPA on top of its data lake, about 80% of each fund's NAV workflow is complete before accountants start work. AI-driven data extraction from bank statements and fund docs, automated waterfall calculations, real-time LP dashboards, ESG data integration platforms.
EBITDA impact:
- Platform standardisation + RPA: typically +200–400 bps EBITDA within ~6–18 months through headcount leverage and error reduction.
- Client portal rollout: improves retention and NRR; measurable within ~6–12 months via reduced query volumes and increased self-serve adoption.
- Near/offshore delivery centres: can drive +300–600 bps over ~12–24 months depending on wage differential and skill availability.
F. Value Creation Playbook
Months 0–12: Foundation (target: +200–400 bps EBITDA)
- Financial integration + unified reporting within 60 days
- Assess and rationalise fund accounting platforms; define migration roadmap
- Establish nearshore delivery hub for recurring processing tasks
- Implement RPA on reconciliation, capital-call processing, investor correspondence
- Launch or upgrade client portal; drive adoption metrics
Months 12–36: Scale & Differentiate (target: additional +200–500 bps EBITDA + growth)
- Complete systems migration to single target architecture
- Build ESG/SFDR reporting capability as add-on service
- Expand into adjacent asset classes (PE → real assets → infrastructure → credit)
- Bolt-on smaller administrators in adjacent jurisdictions (Lux → IE → NL → CI)
- Develop AI-assisted NAV production and anomaly detection
Bolt-on Thesis Library
| Archetype | When to Pursue | Example |
|---|---|---|
| Jurisdiction add | Platform needs licensing/expertise in new domicile | Luxembourg firm adding an Irish administrator |
| Asset-class add | Diversify revenue away from single fund type | PE admin adding real estate or credit specialists |
| Tech add | Acquire proprietary portal or automation capability | Small fintech with an investor-reporting SaaS product |
| Scale add | Increase processing volume to drive unit economics | Same-jurisdiction administrator with overlapping client verticals |
| Nearshore capability add | Access lower-cost delivery without building from scratch | Acquire CEE or South Africa-based admin processing team |
Pricing Power Diagnostic
| Supports Price Realisation | Breaks It |
|---|---|
| High switching costs (data migration, workflow re-training) | Commoditised UCITS admin with many equivalent providers |
| Regulatory licensing requirement by jurisdiction | Over-reliance on a single large client who can insource |
| Multi-fund, multi-entity relationships (deep integration) | Low value-add "paper-pushing" positioning |
| Demonstrated technology superiority (portal, automation) | Price-only procurement in corporate F&A BPO |
| Compliance urgency (LP pressure + regulatory deadlines) | Lack of demonstrable service-level differentiation |
G. Buyer Landscape
Buyer archetypes include financial services-specialist PE, tech-adjacent PE, and strategics (CSC/Intertrust, Apex, TMF, Vistra). Competitive tension is highest for assets with: (i) strong recurring revenue on multi-year contracts; (ii) portal-embedded client relationships; (iii) jurisdictional licensing moats; and (iv) demonstrated delivery automation.
Valuation anchoring: Premium multiples (12–16× EBITDA at platform level) are achievable where >80% recurring, NRR >100%, and visible tech leverage. Assets without tech differentiation price as labour services (8–10×).
H. Red Flags & Failure Modes
- Platform migration risk: Forced migration from heterogeneous fund accounting systems can disrupt service delivery and trigger client churn.
- Key-person dependency in niche admin: Where a single relationship manager holds deep fund-level knowledge, transitions fail.
- Regulatory licensing gaps: Acquisitions without proper licensing/ManCo approvals create compliance risk and delay integration.
- Concentration in a single asset class: Cyclical AUM declines (e.g., real estate downturn) can compress fee income.
- Nearshore execution missteps: Over-rotating to low-cost delivery without quality controls erodes service reputation.
Platform Design Snapshot — Fund Administration
- Ideal first platform: €10–30M revenue; >80% recurring; strong jurisdictional licensing; one or two core fund accounting platforms; NRR evidence; EBITDA >20%.
- Bolt-on sequencing: asset-class adjacency → jurisdiction expansion → tech capability → nearshore capacity.
- Centralise vs federate: Centralise technology architecture, compliance, quality assurance Day 1; federate client-facing teams initially with structured relationship governance.
IC-Ready Insights
- LP pressure is a secular outsourcing tailwind. The trend is structural and strengthening—meaning the addressable market grows even without macro uplift.
- Portal adoption is the leading KPI. Client self-serve usage directly predicts retention, NRR, and exit narrative strength.
- Jurisdiction is both moat and constraint. Licensing creates defensibility but limits the speed of cross-border bolt-on integration.
Mandatory Table — 3.6 Financial Back-Office & Fund Administration
| Target Signal Checklist | Core KPIs | Margin Expansion Levers (with timing) | Technology Maturity Benchmarks |
|---|---|---|---|
| Recurring/retainer revenue >75% | Revenue per administrator | Platform + RPA standardisation (+200–400 bps in 6–18 months) | Best-in-class: single fund accounting platform; investor portal; automated cap calls; RPA on reconciliation |
| Multi-fund, multi-entity client relationships | NRR; gross churn; client tenure | Nearshore delivery (+300–600 bps in 12–24 months) | Lagging: spreadsheet-heavy; manual NAV; email-based investor comms |
| Jurisdictional licensing in place | Cost-to-serve per fund | Portal rollout + self-serve adoption (6–12 months) | Adoption: >70% of LP queries via portal; <10% manual exception |
| Low client concentration | Error/rework rate | ESG/SFDR add-on services (revenue uplift) | Maturity signal: real-time dashboards; AI-assisted data extraction |
| Evidence of automation investment | Administrator utilisation | Pricing uplift on premium services (compliance, ESG) | Growth indicator: alternative asset admin share growing |
3.7 Engineering & Technical Consulting
A. Definition & Scope
Engineering & Technical Consulting covers specialist advisory, design, project management, and inspection services across infrastructure, energy, water, industrial, and built environment sectors. In scope: multidisciplinary engineering consultancy (civil, structural, mechanical, electrical, environmental), project/construction management, specialist inspection, and technical due diligence. Out of scope: pure construction/EPC contracting, equipment manufacturing, and facilities maintenance (covered in 3.8).
Where "tech-enabled" shows up: BIM/digital design, GIS/spatial analytics, project management platforms, digital twins, parametric design tools, environmental modelling, and increasingly AI-assisted design optimisation and document review.
B. Market Size, Growth, and Fragmentation
Chapter 2 cross-reference: Ch2 Table 2.1.2 sizes Engineering & Technical Consulting at ~€45–60B gross with ~€15–25B TEBS-eligible (the tech-leveraged consulting portion, excluding pure construction management labour supply).
The market is expected to grow at a CAGR of 5% from 2025 to 2030. Growth is driven by the EU Green Deal infrastructure investment pipeline, energy transition, and aging European building/infrastructure stock. The European engineering consultation market faces significant challenges from an ongoing shortage of qualified professionals. Industry surveys indicate nearly 60% of engineering firms struggle to fill specialized positions. This skills gap is exacerbated by demographic shifts, with 25% of Europe's engineering workforce projected to retire by 2030.
Fragmentation: High at mid-market level; dominated at the top by listed consolidators. Sweco is listed on NASDAQ OMX Stockholm since 1998, and has since acquired more than a hundred companies of varying sizes. In total, Sweco completed 13 acquisitions in 2025, adding approximately SEK 2.1 billion in annual net sales and more than 1,500 experts. In October 2025, WSP announced that it had completed the acquisition of Ricardo plc, a global strategic and engineering consulting firm operating across more than 20 countries. Below these global players, the mid-market is fragmented into thousands of specialist firms (10–200 FTE).
C. Typical Target Profile
| Attribute | Typical Range |
|---|---|
| Revenue | €5–40M |
| EBITDA margin | 8–15% (higher in specialist/niche; lower in project-heavy generalists) |
| Ownership | Founder/partner-led; corporate spin-offs; some PE-backed |
| Geography | Single-country or sub-national |
| Recurring revenue | 20–40% (framework agreements, retainers); majority project-based |
| Key-person risk | High (principal engineers drive relationships and technical authority) |
D. Buy-and-Build Attractiveness (six-dimension rubric)
- Fragmentation: 4/5. Large pool of sub-€30M firms; succession-driven supply.
- Integration complexity (inverse-scored): 2.5/5. Bespoke project delivery, key-person dependency, and professional culture create integration friction.
- Tech leverage: 3/5. BIM, digital twins, and project platforms help, but delivery remains fundamentally expert-dependent.
- Pricing power: 3/5. Strong in scarce-skill niches (energy transition, water, digital twins); weaker in commodity civil/structural.
- Labor risk (inverse-scored): 2/5. Structural engineer shortage; retirement wave; high competition for talent.
- Exitability: 3.5/5. Strategic buyers (Sweco, WSP, Arcadis) are active; PE exits work for scaled, diversified platforms.
Composite (indicative): 3.1/5.
Justification: Engineering consulting is a natural buy-and-build arena (fragmented, succession-driven) but is constrained by high labour dependency, project-revenue volatility, and integration complexity. The tech premium is harder to earn than in fund admin or MSPs. The winning thesis is niche-plus-scale in verticals with structural demand tailwinds (energy transition, water, digital infrastructure).
E. Technology Levers (incl. AI teaser)
Table-stakes: PSA/ERP (Deltek, Unit4, Maconomy), project management (Primavera, MS Project), BIM authoring (Revit, Bentley), GIS, CAD.
Differentiators: Digital twin platforms, parametric/AI-assisted design, automated document review, advanced environmental modelling, project analytics dashboards with predictive scheduling.
AI teaser: AI can accelerate design iteration, code-compliance checking, and report generation. The threat is limited (engineering judgement remains critical), but AI-savvy firms will gain productivity advantages. The opportunity is to position the platform as a "tech-enabled engineering consultancy" at exit, commanding premium multiples relative to traditional firms.
EBITDA impact:
- PSA standardisation + utilisation discipline: typically +100–250 bps EBITDA within ~6–12 months.
- Bench management + demand forecasting: reduces unbilled time; +50–150 bps over ~6–18 months.
- BIM/digital delivery tool standardisation: productivity gains vary but can support +100–200 bps over ~12–24 months in applicable disciplines.
F. Value Creation Playbook
Months 0–12: Foundation (target: +100–250 bps EBITDA)
- Unified PSA/ERP + project reporting cadence within 90 days
- Utilisation management: establish billing-ratio benchmarks by discipline
- Centralise finance, HR, procurement, and bid management
- Retain key engineers: equity/earn-out + technical career pathways
- Convert framework agreements to multi-year retainers where feasible
Months 12–36: Scale & Differentiate (target: +150–350 bps EBITDA + growth)
- Bolt-on specialist niches (energy transition, water, digital infrastructure)
- Invest in digital delivery tools (BIM library, parametric design, digital twins)
- Expand geographically within language/market cluster (e.g., Nordics, DACH)
- Build nearshore CAD/modelling capacity (CEE, India) for non-judgemental tasks
- Develop "engineering intelligence" data layer: benchmark data, parametric models
Bolt-on Thesis Library
| Archetype | When to Pursue | Example |
|---|---|---|
| Capability add | Plug a technical discipline gap | Acquiring an energy/renewables consultancy |
| Geo add | Enter an adjacent market with framework agreements | Benelux firm buying a DACH specialist |
| Vertical add | Access a higher-growth end-market | Infrastructure platform adding water/environmental |
| Tech add | Acquire digital twins or AI-design IP | Small parametric-design consultancy |
| Scale add | Build regional density for utilisation improvement | Same-city acquisition reducing bench |
Pricing Power Diagnostic
| Supports Price Realisation | Breaks It |
|---|---|
| Scarce-skill specialisation (energy transition, nuclear, offshore wind) | Commodity structural/civil in overserved markets |
| Framework agreements with long-term clients (public utilities, developers) | Single-project, competitive-tender-only positioning |
| Regulatory-driven demand (environmental, safety, permitting) | Undifferentiated generalist offering |
| Proprietary IP/tooling (models, databases, parametric libraries) | Key-person departure triggering client migration |
| Multi-disciplinary integrated offering reducing client vendor count | Over-exposure to construction cycle downturns |
G. Buyer Landscape
Strategic acquirers (Sweco, WSP, Arcadis, Ramboll, Egis) are the dominant exit paths for scaled platforms. PE has a role in building platforms in underserved niches or regions, but exit typically requires strategic appeal or significant scale. Entry multiples are generally 7–10× EBITDA for quality mid-market assets; exit upside depends on niche defensibility, recurring revenue growth, and platform breadth.
H. Red Flags & Failure Modes
- Utilisation cliff after acquisition: Engineers leave; bench increases; margins collapse.
- Project-revenue volatility: Without converting to retainers/frameworks, EBITDA can swing 300–500 bps year-over-year.
- Key-person concentration: If 2–3 partners hold >50% of client relationships, the asset is a "team" not a "firm."
- Capex surprise: Some engineering firms need significant software license and hardware investment to remain competitive.
- AI "disruption" over-rotation: AI changes how engineers work, not whether they are needed—avoid underwriting based on AI cost savings that require 3+ years of cultural change.
Platform Design Snapshot — Engineering Consulting
- Ideal first platform: €10–30M revenue; strong utilisation (>70%); 2–3 niche verticals with structural demand; diversified client base; team depth beyond founders.
- Bolt-on sequencing: capability add (verticals) → geo add → tech/digital delivery → scale.
- Centralise vs federate: Centralise PSA/ERP, finance, HR, bid management Day 1; federate technical delivery and client relationships under standardised quality framework.
IC-Ready Insights
- Utilisation is the margin lever that most acquirers underestimate. A 3-percentage-point improvement in billing ratio at a 200-person firm can add €0.5–1M+ EBITDA annually.
- Energy transition is the "right to win" vertical. Firms positioned in renewables, grid infrastructure, and decarbonisation command premium multiples and face less cyclicality.
- Succession-driven supply is strong but fleeting. The retirement wave creates a time-limited window for bolt-on pipeline—act before strategics absorb the best assets.
Mandatory Table — 3.7 Engineering & Technical Consulting
| Target Signal Checklist | Core KPIs | Margin Expansion Levers (with timing) | Technology Maturity Benchmarks |
|---|---|---|---|
| Framework/retainer agreements in place | Utilisation (billing ratio) | PSA discipline + utilisation (+100–250 bps in 6–12 months) | Best-in-class: unified PSA; BIM library; project dashboards; digital twin capability |
| Niche vertical with structural demand | Revenue per FTE; EBITDA per FTE | Bench management (+50–150 bps in 6–18 months) | Lagging: spreadsheet project tracking; no utilisation visibility |
| Team depth below principals | Win rate on tenders | BIM/digital delivery standardisation (+100–200 bps in 12–24 months) | Adoption: >80% delivery staff active in PSA with time-writing |
| Diversified client base | Client concentration (top 10) | Shared services (bid mgmt, finance, HR) | Maturity signal: parametric/AI tools in active use |
| Credentialing pipeline or academy | Attrition; time-to-hire | Nearshore CAD/modelling capacity | Growth indicator: energy/digital share of revenue rising |
3.8 Facilities Management & Building Services
A. Definition & Scope
Facilities Management (FM) & Building Services covers outsourced management and maintenance of buildings, infrastructure, and associated technical systems. In scope: hard FM (HVAC, electrical, plumbing, fire safety), soft FM (cleaning, security, catering, waste), integrated FM (IFM), and building technology services (BMS, energy management, smart building). Out of scope: pure construction, property development, and engineering consulting (covered in 3.7).
Where "tech-enabled" shows up: CAFM/CMMS platforms, IoT-enabled predictive maintenance, energy management dashboards, scheduling and workforce management tools, and client-facing service portals.
B. Market Size, Growth, and Fragmentation
Chapter 2 cross-reference: Ch2 Table 2.1.2 sizes FM at ~€70–90B gross with ~€15–25B TEBS-eligible (the tech-enabled, outsourced, mid-market-relevant portion). The Europe Facility Management Market size is estimated at USD 350.13 billion in 2025, and is expected to reach USD 404.92 billion by 2030, at a CAGR of 2.95%.
Fragmentation: The Europe facility management market is a highly competitive and fragmented space, comprising over 1,300 active competitors. The top 5 FM companies in Europe—Sodexo, ISS, Compass, Mitie, and Spie—account for just 11.5% of total market revenue. Below these global players, the market fragments into thousands of regional and local service providers—many founder-owned, single-service businesses with €1–15M revenue.
Landmark deal context: The combination of Assemblin and Caverion took place in April 2024. Triton acquired Assemblin in 2015, through the carve-out of the Nordic division of a distressed European conglomerate, before strengthening its position through a strategic buy-build and operational excellence agenda. In late 2022, Triton announced its intention to acquire Caverion through a public tender offer which was completed in late 2023. The Assemblin Caverion Group now operates across ten countries with ~€3.8B revenue—a textbook PE-driven "density play" in technical building services.
C. Typical Target Profile
| Attribute | Typical Range |
|---|---|
| Revenue | €3–30M (single-service or small IFM) |
| EBITDA margin | 5–12% (soft FM lower; hard FM / technical higher) |
| Ownership | Founder-led; family; corporate spin-offs |
| Geography | Hyperlocal to single-country |
| Recurring revenue | 50–80% (contract-based; renewals typically annual) |
| Labour intensity | Very high: frontline workforce is the product |
D. Buy-and-Build Attractiveness (six-dimension rubric)
- Fragmentation: 5/5. Extremely fragmented; massive long tail.
- Integration complexity (inverse-scored): 3.5/5. Operations are relatively standardisable; friction is in labour management, subcontractor control, and contract harmonisation.
- Tech leverage: 2/5. CAFM and IoT help, but delivery remains heavily labour-dependent; tech is more table-stakes than multiple-forming.
- Pricing power: 2.5/5. High competition could lead to price competition, which could limit market growth. Procurement-led, price-sensitive clients; stronger in specialised hard FM and technical services.
- Labor risk (inverse-scored): 2/5. Severe frontline labour constraints; high turnover; wage inflation; heavy reliance on subcontractors.
- Exitability: 3/5. Strategic exit paths exist (Mitie, ISS, CBRE, Compass) but multiple expansion is hard; exits typically at services multiples.
Composite (indicative): 3.1/5.
Justification: FM is a classic Quadrant IV play (Chapter 2, Section 2.4): extremely fragmented with huge bolt-on density, but limited tech leverage and persistent labour constraints. Value creation is driven by operational excellence (procurement, scheduling, density, subcontractor management) rather than technology-driven multiple expansion. The strongest thesis is regional density in hard FM or technical building services, where skill scarcity creates defensibility.
E. Technology Levers
Table-stakes: CAFM/CMMS (e.g., Planon, Maximo, ServiceNow FM), workforce scheduling, mobile work-order management, basic client reporting.
Differentiators: IoT-enabled predictive maintenance, energy management analytics, BMS integration, digital twin for asset lifecycle, client self-serve portals with SLA dashboards.
EBITDA impact:
- CAFM standardisation + scheduling optimisation: typically +100–200 bps EBITDA within ~6–12 months through route density, reduced windshield time, and first-time-fix improvement.
- Procurement centralisation: often the largest single lever; +200–500 bps within ~6–18 months via materials, parts, and subcontractor spend consolidation.
- Predictive maintenance (where IoT-justified): benefits accumulate over ~12–36 months as sensor data builds; reduces reactive call-outs and client downtime.
F. Value Creation Playbook
Months 0–12: Foundation (target: +200–400 bps EBITDA)
- Financial integration + unified KPI pack within 30 days
- Centralise procurement: parts, materials, uniforms, subcontractors
- Deploy standardised CAFM/work-order system; enforce time-writing
- Route and schedule optimisation (geographic clustering)
- Contract review: identify out-of-market contracts and repricing opportunities
Months 12–36: Scale & Differentiate (target: +150–300 bps EBITDA)
- Bolt-on density plays within existing geographies
- Expand from single-service to multi-service or IFM where client demand exists
- Invest selectively in IoT/predictive maintenance for key accounts
- Build energy management / sustainability services add-on
- Develop client portal + SLA dashboard to support contract retention
Bolt-on Thesis Library
| Archetype | When to Pursue | Example |
|---|---|---|
| Density add | Build route density in a geography | Acquiring a neighbouring cleaning or mechanical firm |
| Service-line add | Expand from single-service to IFM | Hard FM platform acquiring a soft FM provider |
| Vertical add | Access a higher-margin end-market | Adding healthcare FM or data-centre technical services |
| Tech add | Acquire IoT/energy monitoring capability | Small BMS/energy management firm |
| Scale add | Increase purchasing volume for procurement leverage | Same-service, same-geography competitor |
Pricing Power Diagnostic
| Supports Price Realisation | Breaks It |
|---|---|
| Hard FM / technical service with specialised skill requirements | Commodity soft FM (cleaning, basic security) in competitive markets |
| Long-term IFM contracts with SLA-linked pricing | One-off project tenders with lowest-price-wins procurement |
| Energy/sustainability outcomes with demonstrable savings | Undifferentiated generalist offering |
| Critical infrastructure clients (healthcare, data centres) | Public sector lowest-cost procurement frameworks |
| Bundled multi-service reducing client vendor count | Subcontractor-heavy delivery with margin leakage |
G. Buyer Landscape
Buyer universe includes industrial/services PE (e.g., Triton, CD&R), strategic acquirers (ISS, Mitie, Compass, CBRE, Equans), and regional consolidators. The Assemblin Caverion combination represents the latest milestone in Triton's track record of investing in the technical service and installation sector. With a history of nearly 20 years in the sector and a realised and current portfolio of multiple investments, including NVS, Bravida, Unica, Assemblin and Caverion, Triton continues to demonstrate its expertise in building leading companies.
Exit multiples are typically 6–9× EBITDA for mid-market FM platforms; premiums are achievable for hard FM/technical specialists with density, technology integration, and contractual stability.
H. Red Flags & Failure Modes
- Margin erosion from labour inflation: FM margins are thin and highly sensitive to wage movements; without inflation pass-through clauses, 100 bps wage uplift can destroy the investment case.
- Subcontractor dependency: If a large share of delivery is subcontracted without margin controls, the platform "rents" revenue rather than owning it.
- Contract cliff risk: Large single contracts (>15% of revenue) create renewal/termination concentration risk.
- Integration overreach: Attempting full operational integration of culturally distinct local businesses too fast can trigger frontline staff attrition.
- Tech-washing in FM: IoT/smart building claims must be validated against actual adoption, data quality, and demonstrated client value—not just pilot presence.
Platform Design Snapshot — Facilities Management
- Ideal first platform: €10–25M revenue; hard FM or technical services focus; long-term contracts; geographic density; EBITDA >8%; diversified client base.
- Bolt-on sequencing: density add → service-line expansion → vertical specialisation → selective tech capability.
- Centralise vs federate: Centralise procurement, finance, scheduling, CAFM governance Day 1; federate frontline management and client relationships under standardised SLAs.
IC-Ready Insights
- Procurement is the EBITDA lever, not tech. In FM, centralised procurement alone can add 200–500 bps—more than any single tech investment.
- Hard FM / technical services is the route to margin resilience. Skill scarcity creates pricing power; soft FM commoditises faster.
- Density wins. The best FM roll-ups cluster geographically before expanding nationally. Density drives scheduling efficiency, emergency response, and staff utilisation.
Mandatory Table — 3.8 Facilities Management & Building Services
| Target Signal Checklist | Core KPIs | Margin Expansion Levers (with timing) | Technology Maturity Benchmarks |
|---|---|---|---|
| Long-term contracts (>1 year) | Gross margin by service line | Procurement centralisation (+200–500 bps in 6–18 months) | Best-in-class: unified CAFM; mobile work-order; client portal; IoT sensors on key assets |
| Geographic density (cluster economics) | First-time-fix rate | Scheduling/route optimisation (+100–200 bps in 6–12 months) | Lagging: paper-based work orders; no scheduling visibility |
| Low client concentration | Staff attrition; time to fill | Shared services (finance, HR, dispatch) | Adoption: >80% work orders logged and tracked in CAFM |
| Evidence of self-delivery (not pure subcontractor) | Revenue per FTE; EBITDA/FTE | Service-line expansion → IFM (revenue + stickiness) | Maturity signal: SLA dashboards + client reporting automation |
| Inflation pass-through clauses in contracts | Contract renewal rate | Predictive maintenance (where justified, 12–36 months) | Growth indicator: energy/sustainability services revenue rising |
3.9 Marketing Services & Digital Agencies
A. Definition & Scope
Marketing Services & Digital Agencies covers agencies delivering performance marketing, SEO/SEM, content marketing, social media management, creative services, web development, e-commerce services, CRM implementation, and marketing analytics. In scope: performance/data-driven agencies, end-to-end digital agencies, marketing technology implementation, and specialist content/creative firms with demonstrable tech enablement. Out of scope: pure PR firms, traditional advertising-only agencies without digital delivery, and pure-play SaaS marketing tools.
Where "tech-enabled" shows up: Analytics platforms, marketing automation, AI-driven personalisation, attribution modelling, programmatic buying, client reporting dashboards, and increasingly AI-assisted content generation.
B. Market Size, Growth, and Fragmentation
Chapter 2 cross-reference: Ch2 Table 2.1.2 sizes Marketing Services & Digital Agencies at ~€30–40B gross with ~€12–20B TEBS-eligible (the tech-enabled, analytics-driven segment).
In Europe, the market is set to expand even faster, with a CAGR of 14.4% from 2023 to 2026, reaching an estimated €44 billion in 2026. The European digital advertising market grew by 16%, reaching €118.9 billion in total spend—of which agency fees represent a significant but smaller portion.
Fragmentation: Extremely high. Europe's ad industry is vast: some 447,000 firms employing over 1 million people. The mid-market is populated by thousands of small agencies (5–50 FTE) with bespoke delivery models and often founder-centric client relationships.
Consolidation activity: M&A activity in the digital agency market is on the rise again. In recent years, macroeconomic factors and a focus on integration led to a temporary slowdown. Highly acquisitive platforms shifted their attention to internal alignment, streamlining operations, optimising synergies, and consolidating previous acquisitions. The Dutch digital agency market is undergoing rapid consolidation, driven by private equity-backed platforms pursuing aggressive acquisition strategies.
C. Typical Target Profile
| Attribute | Typical Range |
|---|---|
| Revenue | €2–20M |
| EBITDA margin | 10–18% (performance-led higher; bespoke creative lower) |
| Ownership | Founder-led; lifestyle businesses; some first-gen PE-backed |
| Geography | Single city / single country |
| Recurring revenue | 30–60% (retainers + managed services); rest project-based |
| Key-person risk | High: founders often drive sales and key client relationships |
D. Buy-and-Build Attractiveness (six-dimension rubric)
- Fragmentation: 5/5. Extremely long tail of small agencies.
- Integration complexity (inverse-scored): 2/5. Creative culture, founder dependency, service inconsistency, and "brand" fragility make integration hard.
- Tech leverage: 3/5. Analytics, automation, and AI improve delivery and retention, but much of the service is still creative/strategic human output.
- Pricing power: 2.5/5. Price competition is intense; stronger where outcomes are measurable (performance marketing) and weaker in commodity creative.
- Labor risk (inverse-scored): 2.5/5. Talent attrition, creative burnout, and competition from in-housing are persistent risks.
- Exitability: 2.5/5. Mixed track record; "agency roll-ups" have a chequered history. Success requires demonstrable integration, recurring revenue, and tech differentiation.
Composite (indicative): 2.9/5.
Justification: Digital agency consolidation is cyclically popular but structurally difficult. The failure mode is "collecting agencies" without integrating delivery, tooling, or commercial motion. The winning thesis requires ruthless focus on: (i) retainer/managed-service revenue mix; (ii) analytics/data-driven positioning; and (iii) measurable, outcomes-based services that resist commoditisation. Agencies that position themselves as comprehensive digital service providers tend to receive higher valuations. Investors increasingly favour firms that offer end-to-end marketing solutions.
E. Technology Levers (incl. AI teaser)
Table-stakes: CRM (HubSpot, Salesforce), marketing automation, analytics (GA4, Data Studio), project management (Monday, Asana), ad platform management tools.
Differentiators: Proprietary attribution modelling, AI-driven content generation and personalisation, automated reporting dashboards, predictive analytics, client-facing performance portals.
AI teaser:
- Opportunity: AI accelerates content production, A/B testing, and campaign optimisation—potentially increasing output per headcount by 20–40% for specific service lines.
- Threat: AI also lowers the barrier to entry for basic content and design, intensifying competition. Defensibility shifts toward strategic advisory, data interpretation, and complex creative.
EBITDA impact:
- Tooling standardisation + reporting automation: typically +100–200 bps EBITDA within ~6–12 months.
- AI-assisted content production: can improve creative output per headcount; measurable within ~6–18 months depending on adoption.
- Conversion to retainer/managed-service model: the most impactful lever; +200–400 bps over ~12–36 months as revenue mix shifts.
F. Value Creation Playbook
Months 0–12: Foundation (target: +100–200 bps EBITDA; stabilise)
- Financial integration + unified reporting within 30 days
- Map revenue by service line, client, and billing model (project vs retainer)
- Standardise tooling: CRM, project management, analytics, reporting
- Founder retention + incentive design; multi-thread key client relationships
- SKU rationalisation: cut unprofitable service lines; focus on scalable offerings
Months 12–36: Scale & Differentiate (target: +200–400 bps EBITDA)
- Shift revenue mix toward managed services / retainer-based models
- Build cross-sell motion across acquired capabilities (SEO + content + analytics + dev)
- Deploy AI-assisted content and campaign tooling with measurable KPIs
- Nearshore/offshore production capacity for creative and development
- Client portal with performance dashboards (retention + NRR lever)
Bolt-on Thesis Library
| Archetype | When to Pursue | Example |
|---|---|---|
| Capability add | Fill a missing digital discipline | SEO platform acquiring a paid media agency |
| Geo add | Enter new European language markets | Dutch platform acquiring a DACH performance agency |
| Vertical add | Deepen expertise in a high-value client segment | E-commerce platform adding B2B SaaS marketing |
| Tech add | Acquire proprietary analytics or AI capability | Small data/attribution firm |
| Scale add | Increase headcount and client base | Same-market agency with complementary clients |
Pricing Power Diagnostic
| Supports Price Realisation | Breaks It |
|---|---|
| Performance/outcomes-based billing with measurable ROI | Time-and-materials creative with unclear attribution |
| Retained/managed services with multi-year contracts | One-off project work with competitive tendering |
| Proprietary analytics/attribution creating switching costs | Undifferentiated SEO/content easily replicated |
| Multi-channel, end-to-end scope reducing client vendor count | Single-channel commodity execution |
| Demonstrable AI/automation delivering superior output | "AI" as marketing buzzword without adoption metrics |
G. Buyer Landscape
Buyers include services-specialist PE, strategic holding companies (WPP, Publicis), and PE-backed digital platforms (e.g., Egeria-backed Leads.io, Newport Capital's European Performance Agency Group). Newport Capital established the European Performance Agency Group by merging four digital agencies into a dedicated performance marketing services group.
Exit multiples range from 5–8× EBITDA for undifferentiated agencies to 8–12× for scaled, retainer-heavy, analytics-driven platforms with demonstrated integration.
H. Red Flags & Failure Modes
- "Agency collection" without integration: If each bolt-on retains its own tools, pricing, and brand without shared delivery capabilities, there is no platform premium at exit.
- Founder departure = client departure: Verify multi-threaded relationships and documented account plans before underwriting revenue stability.
- Creative talent attrition: Agency culture is sensitive; heavy-handed integration triggers departures of key creatives and account leads.
- Client in-housing risk: Larger clients increasingly build internal marketing capabilities—especially for commodity tasks.
- Revenue quality masking: "Managed spend" or "media pass-through" inflates reported revenue without proportional margin.
Platform Design Snapshot — Marketing Services
- Ideal first platform: €5–15M revenue; >50% retainer/managed services; data-driven / performance marketing core; diversified client base; EBITDA >12%.
- Bolt-on sequencing: capability add → geo/language add → tech add → scale.
- Centralise vs federate: Centralise tooling, analytics, finance, reporting Day 1; federate creative identity and client relationships short-term, with progressive brand harmonisation.
IC-Ready Insights
- Retainer mix is the proxy for durability. Agencies with >50% retainer revenue trade at a 1.5–2× multiple premium vs project-heavy peers.
- End-to-end positioning is the exit narrative. Buyers pay for "digital transformation partner" stories, not for "another SEO agency."
- AI is both threat and opportunity—but the window is short. Agencies that deploy AI productively in the next 12–24 months will pull ahead; laggards face margin compression.
Mandatory Table — 3.9 Marketing Services & Digital Agencies
| Target Signal Checklist | Core KPIs | Margin Expansion Levers (with timing) | Technology Maturity Benchmarks |
|---|---|---|---|
| Retainer/managed services >50% revenue | Revenue per FTE | Tooling standardisation (+100–200 bps in 6–12 months) | Best-in-class: unified CRM; analytics dashboards; client portal; AI-assisted content tools |
| Performance marketing with measurable ROI | Gross profit by service line | Retainer mix shift (+200–400 bps in 12–36 months) | Lagging: manual reporting; no CRM discipline; no utilisation tracking |
| Diversified client base (top 10 <40%) | Client retention; NRR | AI-assisted production (measurable in 6–18 months) | Adoption: >80% of delivery staff using standardised tools |
| Multi-threaded client relationships | Utilisation; delivery efficiency | Nearshore creative/dev capacity | Maturity signal: automated client reporting + attribution modelling |
| Evidence of cross-sell across capabilities | CAC; LTV where tracked | SKU rationalisation (cut unprofitable lines) | Growth indicator: managed services share rising (trend) |
3.10 Education & Training Services
A. Definition & Scope
Education & Training Services covers B2B corporate training, professional development, compliance training, vocational/technical skills programmes, and e-learning content/platform providers. In scope: corporate training outsourcing, learning management system (LMS)-enabled delivery, compliance training services, vocational assessment, digital learning content, and managed learning services. Out of scope: K–12 and higher education institutions (public or private), pure-play LMS/EdTech SaaS companies, and consumer tutoring platforms.
Where "tech-enabled" shows up: LMS platforms, e-learning content authoring, blended learning delivery, virtual classrooms, AI-driven personalised learning paths, assessment engines, and learning analytics dashboards.
B. Market Size, Growth, and Fragmentation
Chapter 2 cross-reference: Ch2 Table 2.1.2 sizes Education & Training at ~€15–25B gross with ~€7–12B TEBS-eligible (the B2B, tech-enabled portion).
The Europe corporate training market size is forecast to increase by USD 15.29 billion from 2024-2029, expanding at a CAGR of 7.6% during the forecast period. Key demand drivers include digital transformation upskilling, increased focus on upskilling and reskilling across various sectors as the pace of digital transformation quickens, and strong regulatory and compliance training mandates, with stringent EU-wide regulations obliging organisations to implement compulsory training sessions. This regulatory framework generates a steady demand for organised corporate learning solutions.
Fragmentation: High. The mid-market is populated by hundreds of niche training providers, often domain-specific (e.g., financial compliance, HSE, IT certifications, leadership development). Large players (Skillsoft, Cornerstone, GP Strategies) operate at scale, but significant mid-market fragmentation persists by geography, domain, and delivery model.
C. Typical Target Profile
| Attribute | Typical Range |
|---|---|
| Revenue | €3–20M |
| EBITDA margin | 10–20% (higher for digital/content-led; lower for instructor-led) |
| Ownership | Founder-led; some corporate spin-offs |
| Geography | Single-country; niche vertical |
| Recurring revenue | 40–70% (annual training programmes, multi-year framework agreements, compliance cycles) |
| Key differentiator | Domain expertise, content library, LMS integration, accreditation/certification authority |
D. Buy-and-Build Attractiveness (six-dimension rubric)
- Fragmentation: 4/5. Dense mid-market with many niche providers.
- Integration complexity (inverse-scored): 3.5/5. Manageable when content and delivery are separable; harder where bespoke facilitation drives value.
- Tech leverage: 3.5/5. LMS, content reuse, blended learning models, and AI personalisation can meaningfully improve unit economics and scalability.
- Pricing power: 3/5. Strong where compliance mandates create non-discretionary demand; weaker in soft skills or discretionary programmes.
- Labor risk (inverse-scored): 3/5. Trainers are specialised but replaceable where content is well-codified; risk increases with bespoke facilitator-dependent models.
- Exitability: 3.5/5. Growing interest from PE and strategics; premium for scaled, content-rich platforms with LMS-embedded delivery.
Composite (indicative): 3.5/5.
Justification: Education & Training is an attractive TEBS arena when the business model emphasises content leverage, digital delivery, and compliance-driven demand. The tech premium comes from (i) content reuse across cohorts/geographies; (ii) LMS-embedded delivery creating switching costs; and (iii) certification/assessment authority creating defensibility. The risk is in bespoke, instructor-led training where delivery is labour-bound and content is not reusable.
E. Technology Levers (incl. AI teaser)
Table-stakes: LMS (e.g., Cornerstone, Moodle, TalentLMS), virtual classroom tools (Teams, Zoom, Webex), content authoring (Articulate, Adobe Captivate), basic assessment tools.
Differentiators: AI-powered personalised learning paths, adaptive assessment engines, learning analytics dashboards with ROI measurement, content libraries with cross-geography localisation, virtual/AR-enhanced simulations.
AI teaser:
- Opportunity: AI can automate content localisation, personalise learning journeys, generate assessments, and provide scalable coaching—dramatically improving content production economics and learner outcomes.
- Threat: AI-generated content lowers barriers to entry for basic training; defensibility shifts toward curated expertise, accreditation, and embedded client relationships.
EBITDA impact:
- Content reuse + digital delivery shift: typically +200–400 bps EBITDA within ~12–24 months as marginal cost of each additional cohort/client decreases.
- LMS standardisation + learner analytics: improves client retention and renewal rates; measurable within ~6–12 months.
- AI content localisation + generation: can reduce content production costs by 30–50% in specific use cases; benefits accrue over ~6–18 months.
F. Value Creation Playbook
Months 0–12: Foundation (target: +150–300 bps EBITDA)
- Inventory content library; assess reusability and localisation potential
- Standardise LMS platform; mandate tracking and analytics
- Convert suitable instructor-led programmes to blended/digital models
- Identify compliance-driven revenue (structural demand) vs discretionary
- Centralise finance, admin, sales operations
Months 12–36: Scale & Differentiate (target: +200–500 bps EBITDA + growth)
- Build or acquire reusable digital content library across high-demand domains
- Bolt-on domain specialists (compliance, technical, ESG) to broaden catalogue
- Expand geographically with localised content (AI-assisted translation + cultural adaptation)
- Launch enterprise managed learning service (outsourced L&D function)
- Develop learning analytics / ROI dashboards for client-facing reporting
Bolt-on Thesis Library
| Archetype | When to Pursue | Example |
|---|---|---|
| Domain add | Broaden training catalogue with new compliance/technical area | Compliance platform adding ESG training capability |
| Content/IP add | Acquire proprietary content library or assessment bank | Specialist certification body with reusable content |
| Geo/language add | Enter a new European market | UK compliance training firm adding DACH-localised capability |
| Tech add | Acquire LMS or learning analytics IP | Small EdTech firm with adaptive learning engine |
| Scale add | Increase enterprise client base | Same-domain competitor with complementary clients |
Pricing Power Diagnostic
| Supports Price Realisation | Breaks It |
|---|---|
| Mandatory compliance training with annual renewal cycles | Discretionary "nice-to-have" soft skills without client champion |
| Accreditation/certification authority (CPD, ISO) | Commodity content easily replicated by competitors or AI |
| Enterprise-embedded LMS with integrated learner records | One-off workshops with no ongoing relationship |
| Demonstrable outcomes (completion, competency, compliance evidence) | Undifferentiated instructor-led with no measurement |
| Multi-domain catalogue creating cross-sell/upsell within accounts | Single-topic provider vulnerable to vendor consolidation |
G. Buyer Landscape
Buyers include EdTech-adjacent PE, services-focused PE, and strategics (Skillsoft, GP Strategies, Learning Technologies Group). The market is increasingly interesting to PE due to (i) compliance-driven recurrence; (ii) digital delivery scalability; and (iii) content-as-IP creating defensibility.
Valuation ranges: 7–10× EBITDA for quality mid-market assets with digital delivery and compliance anchoring; 5–7× for instructor-led, project-heavy training businesses; 10–14× for scaled content platforms with LMS-embedded delivery.
H. Red Flags & Failure Modes
- Content obsolescence risk: Training content depreciates rapidly (especially in tech/regulatory domains); underwrite content refresh cadence and cost.
- Discretionary spending vulnerability: Non-compliance training budgets are among the first to be cut in downturns.
- LMS lock-in illusion: If the LMS is a commoditised third-party tool, switching costs accrue to the LMS vendor, not the training provider.
- Instructor dependency: Where a small number of star trainers drive demand, the business is a "speaker bureau" not a platform.
- AI disruption of basic content: Generic e-learning content production is being commoditised by AI tools; defensibility requires proprietary assessment, curated expertise, or domain certification.
Platform Design Snapshot — Education & Training
- Ideal first platform: €5–15M revenue; strong compliance/regulatory training anchor; >50% recurring; proprietary content library; LMS-integrated delivery; EBITDA >15%.
- Bolt-on sequencing: domain add → content/IP add → geo/language add → tech add → scale.
- Centralise vs federate: Centralise LMS, content operations, sales, and analytics Day 1; federate facilitation and domain expertise initially under quality frameworks.
IC-Ready Insights
- Compliance training is the recurring-revenue anchor. It provides non-discretionary demand and annual renewal cycles—the bedrock for a TEBS premium.
- Content-as-IP is the multiple driver. The gap between "training company" and "learning platform" is the difference between 6× and 12× at exit.
- AI accelerates content economics—for both incumbents and entrants. The defensible moat is in curation, assessment authority, and client-embedded LMS integration, not in content production alone.
Mandatory Table — 3.10 Education & Training Services
| Target Signal Checklist | Core KPIs | Margin Expansion Levers (with timing) | Technology Maturity Benchmarks |
|---|---|---|---|
| Compliance/regulatory training as revenue anchor | Recurring revenue %; renewal rate | Content reuse + digital shift (+200–400 bps in 12–24 months) | Best-in-class: proprietary LMS; adaptive learning; analytics dashboards; AI-assisted content |
| Proprietary content library with reuse potential | Completion rate; learner satisfaction | LMS standardisation (+100–200 bps in 6–12 months) | Lagging: manual course admin; no learner tracking; bespoke slide decks |
| Enterprise-embedded LMS relationships | Revenue per learner; revenue per client | AI content localisation/generation (benefits in 6–18 months) | Adoption: >80% of programmes delivered via LMS with tracking |
| Multi-domain catalogue | Client concentration | Shared services (sales ops, admin, finance) | Maturity signal: learning analytics with ROI measurement |
| Evidence of digital delivery capability | Instructor utilisation | Enterprise managed learning service (revenue + stickiness) | Growth indicator: digital/blended share of revenue rising |
Cross-Module Comparison (Modules 3.6–3.10) — Six-Dimension Rubric Alignment
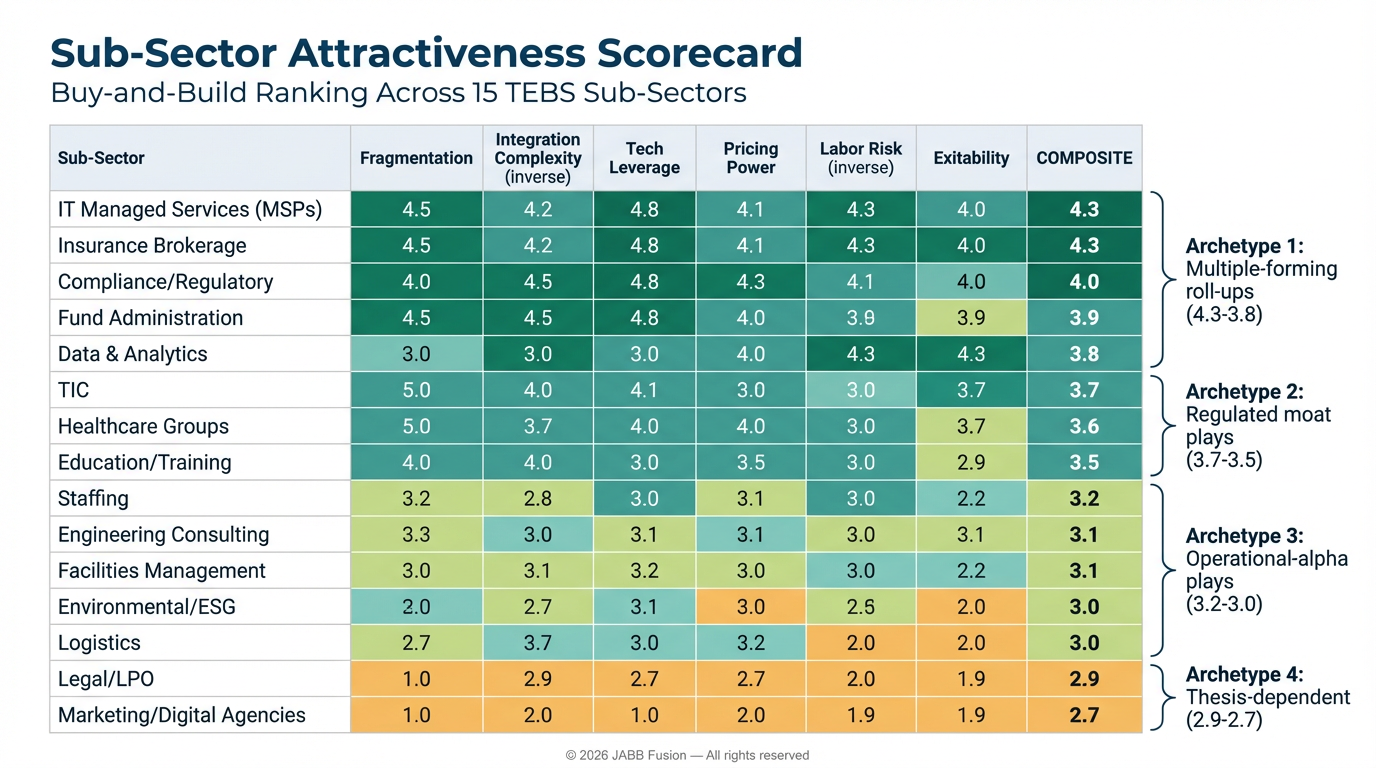
| Sub-Sector | Fragmentation | Integration Complexity* | Tech Leverage | Pricing Power | Labor Risk* | Exitability | Composite (indicative) |
|---|---|---|---|---|---|---|---|
| 3.6 Fund Admin / Back-Office | 3.5 | 3.0 | 4.5 | 4.0 | 3.5 | 4.5 | 3.9 |
| 3.7 Engineering Consulting | 4.0 | 2.5 | 3.0 | 3.0 | 2.0 | 3.5 | 3.1 |
| 3.8 Facilities Management | 5.0 | 3.5 | 2.0 | 2.5 | 2.0 | 3.0 | 3.1 |
| 3.9 Marketing / Digital Agencies | 5.0 | 2.0 | 3.0 | 2.5 | 2.5 | 2.5 | 2.9 |
| 3.10 Education & Training | 4.0 | 3.5 | 3.5 | 3.0 | 3.0 | 3.5 | 3.5 |
*Integration Complexity and Labor Risk are inverse-scored: higher = more attractive / lower risk (per Chapter 1 rubric).
Cross-Module Key Observations
1. Fund Administration leads this cohort with the highest composite score (3.9), driven by exceptional tech leverage, strong pricing power via switching costs, and proven exit paths. It is the closest to Quadrant I (Chapter 2) among these five sub-sectors, with the caveat that fragmentation is more moderate than in FM or marketing.
2. Education & Training is the "sleeper" in this set. When anchored in compliance/regulatory training with proprietary content and LMS-embedded delivery, it scores materially better than its reputation among generalist PE investors suggests. The content-as-IP model enables non-linear scaling rare in services.
3. Engineering and Facilities Management score identically (3.1) but for different reasons. Engineering is constrained by labour dependency and integration difficulty despite high fragmentation. FM is constrained by low tech leverage and thin margins despite extreme fragmentation and manageable integration. Both are "operational alpha" plays (Quadrant IV) requiring strong operating playbooks.
4. Marketing/Digital Agencies score lowest (2.9) in this cohort. The failure rate of agency roll-ups historically is high, driven by integration difficulty, founder dependency, and cultural fragility. The thesis works only with ruthless discipline: retainer conversion, tooling standardisation, analytics differentiation, and measured integration.
5. "Project vs embedded" is the single most powerful discriminator within each sub-sector. In every module, the gap between project-revenue targets and embedded-recurring-service targets maps directly to both entry multiples and integration success rates. IC teams should start every screen with: "What percentage of revenue is structurally embedded and recurring—and can we credibly increase it?"
Comparison to Chapter 3 Modules
Combining Chapters 3 and 4, the full ten-module landscape now shows a clear hierarchy:
| Rank | Sub-Sector | Composite | Quadrant |
|---|---|---|---|
| 1 | 3.1 IT Managed Services | 4.3 | I |
| 2 | 3.4 Compliance/Regulatory | 4.0 | I |
| 3 | 3.6 Fund Admin / Back-Office | 3.9 | I–II |
| 4 | 3.2 TIC | 3.7 | II |
| 5 | 3.5 Healthcare Services | 3.6 | IV |
| 6 | 3.10 Education & Training | 3.5 | Emerging I |
| 7 | 3.3 Professional Staffing | 3.2 | IV |
| 8 | 3.7 Engineering Consulting | 3.1 | IV |
| 9 | 3.8 Facilities Management | 3.1 | IV |
| 10 | 3.9 Marketing/Digital Agencies | 2.9 | III–IV |
The pattern is consistent: tech leverage × recurring revenue × integration feasibility is the combination that most reliably predicts both buy-and-build success and exit multiple expansion. The five remaining sub-sectors in Chapter 5 (Environmental/Sustainability, Legal/LPO, Data & Analytics, Logistics/Supply Chain, Insurance Brokerage) will complete this ranking and introduce additional dynamics—particularly data ownership, risk intermediation, and distribution economics.
Chapter 5: Sub-Sector Deep Dives (Modules 3.11–3.15): Data, Risk Intermediation, and Outcome-Driven Services
This chapter completes the 15-module set with five sub-sectors that introduce three dynamics not fully captured in Chapters 3–4:
- Data ownership and defensibility (who “owns” the operational data exhaust and whether it can become a moat)
- AI enablement versus AI disruption (where automation expands capacity vs compresses billable work)
- Distribution economics (renewal-led recurrence and economics driven by placement, not delivery hours)
The five sub-sectors—Environmental & Sustainability Consulting (3.11), Legal Services & LPO (3.12), Data & Analytics Services (3.13), Logistics & Supply Chain Services (3.14), and Insurance Brokerage & Distribution (3.15)—span the services-to-software continuum from ~2.1 (Legal/LPO) to ~4.1 (Data & Analytics), consistent with the taxonomy introduced in Chapter 2.
Each module follows the identical A–H structure, mandatory table, and six-dimension rubric from Chapters 1 and 3–4. In addition, each module includes two expanded deliverables (requested by the PE audience for roll-up execution):
- Failure Mode Pre-Mortem (top 5 reasons a roll-up fails, with early-warning indicators)
- Integration Complexity Breakdown (what must be harmonised vs what can remain federated), now expanded with deal-pattern examples (real-world where confidently verifiable; otherwise explicitly anonymised, as noted).
Citation and definitional discipline (credibility fix): Where market research sources differ by definition (e.g., “brokerage market” sized on premiums intermediated vs brokerage revenues/commissions), this chapter (i) hyperlinks the source, (ii) flags definitional mismatch, and (iii) anchors to the report’s gross TAM vs TEBS-eligible TAM construct from Chapter 2 (Table 2.1.2). The prior draft’s unverified specific claim in 3.11 (“$54.7B globally in 2023”) has been removed to avoid factual inaccuracy.
Part V linkage (AI Impact Matrix preview): Each module includes a short “AI Impact Matrix (preview)” call-out that maps to Part V (AI Impact Matrix and diligence tool), clarifying AI value-capture magnitude vs AI disruption risk.
3.11 Environmental & Sustainability Consulting
A. Definition & Scope
Environmental & Sustainability Consulting covers specialist advisory, monitoring, assurance, and reporting services helping organisations manage environmental risk, comply with sustainability mandates, and navigate the energy transition. In scope: Environmental Impact Assessment (EIA), ESG advisory and assurance support, carbon accounting and verification support, biodiversity and nature-positive assessments, contaminated land/remediation consulting, regulatory permitting, and CSRD/ESRS reporting support. Out of scope: pure engineering/construction services, academic research, and internal corporate sustainability functions.
Where “tech-enabled” shows up: GIS-based site characterisation, remote sensing and drone surveys, emissions measurement and monitoring platforms, ESG data management portals, AI-assisted scenario modelling, and automated reporting workflows.
B. Market Size, Growth, and Fragmentation
Chapter 2 cross-reference: Ch2 Table 2.1.2 sizes this sub-sector at ~€10–18B gross with ~€6–12B TEBS-eligible for Europe.
External sizing (definition note): Market research often sizes “environmental consulting” globally with broad scope definitions. For example, Mordor Intelligence estimates the global environmental consulting market at ~USD 46.5B (2025), reaching ~USD 62.25B (2030) (CAGR ~6.0%) (Mordor Intelligence). Europe’s share varies by definition and coverage; this report therefore anchors to the Chapter 2 working range rather than applying an unverified regional share.
Growth drivers (EU regulatory pull):
- CSRD/ESRS reporting: The EU’s Corporate Sustainability Reporting Directive (CSRD) materially expands the population of reporting entities and raises disclosure requirements, creating multi-year demand for reporting, data readiness, and assurance-adjacent work (European Commission – CSRD overview).
- Permitting, monitoring, and risk: Industrial decarbonisation, environmental permitting, and remediation remain “must-do” spend for many asset-heavy sectors even through cyclical slowdowns.
Fragmentation: Moderately fragmented. Large integrated players (e.g., WSP, AECOM, Jacobs, Tetra Tech) acquire specialists for capability and geography. The European mid-market remains highly fragmented with many 5–100 FTE boutiques.
Data ownership and defensibility: Environmental consultants accumulate site-specific data that is usually client-owned but consultant-curated. Defensibility comes from: (i) audit-ready methodology and evidence trails, (ii) multi-year site relationships (monitoring/permit cycles), and (iii) proprietary benchmarking databases (where consultants aggregate across projects within legal/contract constraints).
C. Typical Target Profile
| Attribute | Typical Range |
|---|---|
| Revenue | €3–25M |
| EBITDA margin | 12–20% (higher in assurance-adjacent work; lower in field-heavy remediation) |
| Ownership | Founder-led; ex-Big Four / ex-regulator specialists common |
| Geography | Single country or sub-national; niche vertical focus |
| Recurring revenue | 35–60% (retainers, monitoring, annual reporting cycles) |
| Key differentiator | Domain depth, accreditation, and benchmark datasets / repeatable methodologies |
D. Buy-and-Build Attractiveness (six-dimension rubric)
- Fragmentation: 4.5/5. Large long tail across Europe.
- Integration complexity (inverse-scored): 3/5. Key-person risk is meaningful; methodology standardisation and QA governance require real effort.
- Tech leverage: 3/5. Tech improves productivity and client experience but does not fully displace expert delivery.
- Pricing power: 3.5/5. Strong in compliance/permitting and “deadline-driven” mandates; weaker in discretionary strategy advisory.
- Labor risk (inverse-scored): 2.5/5. Specialist scarcity (hydrogeology, toxicology, ecology) is a constraint.
- Exitability: 3.5/5. Active strategics; sponsor interest rising as ESG services institutionalise.
Composite (indicative): 3.4/5.
E. Technology Levers (incl. AI)
Table-stakes: GIS, modelling tools, PSA/project management, standard reporting.
Differentiators: ESG data management portals, remote sensing/drone workflows, automated evidence-trail capture for assurance-adjacent work, and AI-assisted drafting/consistency checks.
AI EBITDA impact (benchmarked, with practicality caveat): Cross-industry benchmarks suggest generative AI can automate or accelerate a meaningful share of document-heavy knowledge work (often cited as ~60–70% of work activities having some automation potential across occupations) (McKinsey – economic potential of gen AI). In environmental consulting, capture is constrained by (i) fieldwork, (ii) regulated accountability, and (iii) the need for expert sign-off. A realistic underwriting frame for mid-market platforms is:
- Reporting automation (drafting + consistency + formatting): 10–20% time reduction on reporting-heavy engagements → typically +100–250 bps EBITDA over 6–18 months (depends on reporting share of mix).
- Template/methodology standardisation: typically +150–300 bps within ~6–12 months (repeatable across bolt-ons).
- Remote sensing/drone adoption: reduces field time/travel, often +50–150 bps over ~12–24 months as usage scales.
AI Impact Matrix (preview; see Part V):
- AI value-capture potential: Medium
- AI disruption risk: Low–Medium (AI assists; does not replace accountable expert sign-off)
F. Value Creation Playbook
Months 0–12: Foundation (target: +150–300 bps EBITDA)
- Standardise methodologies, QA, and reporting templates; implement audit-ready evidence trails
- Centralise finance, procurement, and capacity planning
- Convert suitable recurring workflows (monitoring, annual reporting) into retainers/subscriptions
- Deploy client-facing ESG data portal (even if initially “thin”)
Months 12–36: Scale & Differentiate (target: +200–400 bps EBITDA + growth)
- Bolt-on specialist domains (carbon verification support, biodiversity, remediation, permitting)
- Geographic expansion to cover multi-jurisdiction clients
- Build proprietary benchmarking datasets (where contractually permissible)
- Embed AI-assisted reporting + data validation into the delivery system
G. Buyer Landscape + Deal Patterns (examples)
Strategics are frequent acquirers (capability + geography). Sponsors increasingly back multi-domain platforms where recurring monitoring/assurance-adjacent work can be scaled.
- Real-world example (strategic scale): WSP announced its acquisition of Power Engineers (announced 2024/2025 timeframe; value widely reported), illustrating how strategics pay for sector depth and scale in energy-transition adjacency (see WSP investor/news releases for transaction detail).
- Anonymised mid-market roll-up pattern (Europe): A sponsor-backed platform combined (i) a permitting/EIA boutique, (ii) a remediation/contaminated-land specialist, and (iii) a CSRD reporting support team, then centralised QA + templates and created a single client portal. The integration KPI that mattered: % of deliverables produced through the standardised evidence-trail workflow (target >70% within 12 months).
H. Red Flags & Failure Modes (expanded)
Failure Mode Pre-Mortem (with early warnings):
- Key-person departure collapses domain capability. Early warning: top 5 specialists hold >40% of delivery responsibility; no documented methodology or successor bench.
- CSRD demand proves “one-and-done” rather than recurring. Early warning: year-1 reporting projects without signed multi-year monitoring or update cycles.
- Quality failures create reputational damage (assurance-adjacent work). Early warning: rising nonconformances, late deliverables, weak evidence trails.
- AI compresses low-end reporting work faster than platform shifts to higher-value mandates. Early warning: falling realisation on reporting-only engagements; clients bring AI drafting in-house.
- Integration erodes specialist culture and increases attrition. Early warning: >15% attrition among senior experts in first 12 months post-acquisition.
Integration Complexity Breakdown (what to harmonise vs federate):
- Must harmonise (Day 1–180): QA framework; methodology templates; evidence-trail standards; financial reporting; minimum cybersecurity/data handling; pricing guardrails.
- Should harmonise (6–18 months): unified ESG data portal; standard project setup/PSA taxonomy; knowledge management.
- Can remain federated (initially): client relationships; field ops; domain-specialist teams—provided QA and evidence standards are enforced.
Deal-execution pitfall example (anonymised): A roll-up forced immediate tool migration (GIS + PSA) across bolt-ons, causing project delays and senior churn. Better pattern: federated tools + central reporting extract layer first, then phased migrations aligned to client project cycles.
Mandatory Table — 3.11 Environmental & Sustainability Consulting
| Target Signal Checklist | Core KPIs | Margin Expansion Levers (with timing) | Technology Maturity Benchmarks |
|---|---|---|---|
| Compliance/permitting and monitoring anchor | Revenue per consultant; utilisation | Methodology standardisation (+150–300 bps / 6–12m) | Best: GIS + remote sensing; portal; audit-ready evidence trails |
| Multi-domain capability | Recurring revenue %; NRR | Reporting automation (+100–250 bps / 6–18m) | Lagging: manual data handling; inconsistent templates |
| Credentialed specialists with bench depth | On-time delivery; QA nonconformance rate | Shared services + capacity planning (+50–150 bps / 6–12m) | Adoption: % deliverables on standard workflow (>70%) |
| Low client concentration | Pipeline coverage; win rate | Retainer conversion (growth + stability) | Maturity: structured knowledge base; re-usable benchmarks |
| Evidence of benchmark datasets (where permissible) | Gross margin by service line | Remote sensing scale-up (+50–150 bps / 12–24m) | Growth: recurring monitoring and assurance-adjacent share rising |
3.12 Legal Services & Legal Process Outsourcing (LPO) / ALSPs
A. Definition & Scope
Legal Services & LPO covers outsourced legal support, managed legal services, and tech-enabled legal operations delivered to corporate legal departments and law firms. In scope: contract lifecycle management (CLM) services, document review and e-discovery delivery, compliance monitoring, legal research outsourcing, entity management, and managed legal services. Out of scope: full-service law firm advisory (equity-partner model), pure-play legal tech SaaS, and in-house legal functions.
Where “tech-enabled” shows up: AI contract analytics, automated document review, CLM workflow integration, legal knowledge management, e-billing/matter management, and client dashboards.
B. Market Size, Growth, and Fragmentation
Chapter 2 cross-reference: Ch2 Table 2.1.2 frames Legal Services & LPO at ~€20–30B gross with ~€8–15B TEBS-eligible for Europe (the TEBS-eligible subset is not “all legal services”).
External sources (definition note):
- “Europe legal services market” is often sized as the full sector, including traditional law firms (not TEBS-eligible). Example: Market Data Forecast publishes Europe legal services market sizing under that broad definition (Market Data Forecast – Europe Legal Services).
- For the TEBS-eligible perimeter, LPO/ALSP sizing is more relevant. Market Data Forecast also publishes Europe LPO sizing (Market Data Forecast – Europe LPO); Fortune Business Insights provides global LPO sizing context (Fortune Business Insights – LPO).
Fragmentation: Very high across ALSPs, managed legal services providers, and compliance monitoring boutiques—particularly below €20m revenue.
Data ownership and defensibility: Legal data is overwhelmingly client-owned and constrained by privilege/confidentiality. Defensibility comes from (i) workflow embedding (CLM integrated into procurement/sales), (ii) institutional knowledge of client contract positions and playbooks, and (iii) defensible delivery operations (security + QA + turnaround reliability). Data moats are harder than in insurance or logistics.
C. Typical Target Profile
| Attribute | Typical Range |
|---|---|
| Revenue | €3–20M |
| EBITDA margin | 15–30% (higher for tech-embedded managed services; lower for labour-arbitrage LPO) |
| Ownership | Founder-led; ex-law firm; occasional first-gen PE-backed assets |
| Geography | Single country; sometimes cross-border delivery (UK–India / UK–CEE patterns) |
| Recurring revenue | 40–70% (managed services retainers; CLM “run” contracts) |
| Key-person risk | High in advisory-heavy models; lower in process-driven LPO |
D. Buy-and-Build Attractiveness (six-dimension rubric)
- Fragmentation: 4/5. Large bolt-on universe.
- Integration complexity (inverse-scored): 2.5/5. Confidentiality, security, professional culture, and heterogeneous delivery models increase friction.
- Tech leverage: 3/5. High in document-heavy workflows; limited in bespoke advisory.
- Pricing power: 3/5. Moderate where embedded (CLM managed services); weak in commoditised review.
- Labor risk (inverse-scored): 3/5. Nearshore/offshore is established; talent availability better than some engineering-heavy sub-sectors.
- Exitability: 3/5. Growing buyer interest, but roll-up outcomes are less consistently “proven” than insurance broking or MSPs.
Composite (indicative): 3.1/5.
E. Technology Levers (incl. AI)
Table-stakes: matter management, e-billing, document management, standard research tools.
Differentiators: CLM embedded services, AI-assisted contract abstraction, automated playbook enforcement, compliance monitoring tooling, secure client portals.
AI EBITDA impact (more precise, with benchmark anchor): McKinsey’s gen-AI research highlights that legal is among the knowledge-work areas with high exposure to automation/augmentation potential (McKinsey – economic potential of gen AI). In practice, TEBS sponsors should underwrite to time-to-output reductions rather than “headcount elimination” due to (i) client SLA needs, (ii) risk controls, and (iii) growth redeployment. A realistic base-case for document-heavy providers:
- AI-assisted review / abstraction: 20–40% reduction in effort on eligible tasks (after QA + rework allowance), typically translating to +200–500 bps EBITDA over 6–18 months if pricing model retains some value capture (not fully passed through).
- CLM managed services embedding: improves retention/NRR (switching costs), typically visible over 12–24 months via higher renewal rates and expanded scope.
- Nearshore/offshore delivery: +300–500 bps EBITDA over 12–24 months depending on wage mix and utilisation discipline.
AI enablement vs disruption: This is one of the most AI-exposed TEBS modules. If the business model is “hours × rate,” AI can commoditise the core. The defensible model is AI-augmented managed services priced on outcomes, turnaround, risk reduction, and workflow ownership.
AI Impact Matrix (preview; see Part V):
- AI value-capture potential: High
- AI disruption risk: High (especially for commoditised review/abstraction)
F. Value Creation Playbook
Months 0–12: Foundation (target: +150–300 bps EBITDA)
- Standardise delivery processes, QA, and security controls
- Deploy AI tooling in a governed workflow (human-in-the-loop + audit trail)
- Convert project work to managed services retainers where possible
- Build “CLM run” capability (admin + playbook + compliance reporting)
- Establish nearshore delivery for document-heavy steps
Months 12–36: Scale & Differentiate (target: +200–500 bps EBITDA + growth)
- Productise CLM-as-a-service for mid-market corporates (implementation + run)
- Bolt-on compliance monitoring specialists (regulated industries)
- Build secure client portal and reporting dashboards (SLA + transparency)
- Expand cross-border coverage for multinational contract estates
G. Deal Patterns + Case Studies (requested; Legal/LPO)
Anonymised deal comp #1 (CLM-led platform build):
- Platform: UK-based managed legal services provider (~€12m revenue) with strong GC relationships but low tech.
- Bolt-ons: (i) a small CLM implementation shop, (ii) a nearshore delivery centre (CEE), (iii) a compliance monitoring boutique in a regulated vertical.
- What worked: CLM “run” contracts created workflow embedding; revenue shifted toward recurring retainers.
- What nearly failed: initial CLM tooling sprawl; fixed by mandating a single reporting/extract layer and standard SLAs before full tool migration.
Anonymised deal comp #2 (document-review roll-up that underperformed):
- Platform: multi-country LPO aggregator focused on document review.
- Issue: AI adoption by clients and competitors compressed pricing faster than the platform shifted to managed services.
- Early warning that was missed: declining effective rate per document and rising competitive “AI included” RFP language; too much revenue in one commoditising service line.
(Note: these are anonymised because the objective is execution learning; transaction specifics are frequently private in mid-market ALSP/LPO.)
H. Red Flags & Failure Modes (expanded)
Failure Mode Pre-Mortem (with early warnings):
- AI renders core service commodity before model shifts. Early warning: rate erosion; client demands “AI-included” with zero price uplift.
- Confidentiality/security failure destroys trust. Early warning: weak access controls, incomplete audit trails, or non-compliant vendor usage.
- Key relationship-holder departure. Early warning: single partner controls >30% revenue; no multi-threaded relationships.
- Overexposure to a cyclical litigation workflow. Early warning: >40% revenue from litigation support; pipeline volatility.
- Integration friction from professional culture and inconsistent QA. Early warning: bolt-ons reject standard KPIs; defect/rework rates vary widely across teams.
Integration Complexity Breakdown:
- Must harmonise: data security model; confidentiality protocols; AI governance (model use, prompts, data boundaries); billing and matter taxonomy; QA metrics.
- Can remain federated (initially): jurisdiction-specific legal expertise; client-facing relationship model; local brand—provided security/QA are centralised.
Real-world integration lesson (general industry pattern): In ALSP integrations, security and auditability are the true “ERP equivalent.” Treat them like a Day 1 integration gate, not a back-office improvement.
Mandatory Table — 3.12 Legal Services & LPO
| Target Signal Checklist | Core KPIs | Margin Expansion Levers (with timing) | Technology Maturity Benchmarks |
|---|---|---|---|
| Managed services/retainer revenue >40% | Revenue per delivery FTE; NRR | AI-assisted review (+200–500 bps / 6–18m, if value capture retained) | Best: CLM embedded services; secure portal; AI w/ audit trail |
| Evidence of workflow embedding (CLM “run”) | Retention; SLA compliance | Nearshore delivery (+300–500 bps / 12–24m) | Lagging: email-based delivery; manual review |
| Low key-person concentration | Client concentration; matters per FTE | Retainer conversion (stability + margin) | Adoption: AI used on >50% eligible matters |
| Proven security & governance | QA defect/rework rate | Shared services (HR/finance/IT) | Maturity: formal AI governance + client-approved controls |
| Diversified service mix (not only review) | Turnaround time; gross margin by service | Pricing redesign (outcome/SLA-based) | Growth: recurring share and CLM run revenue rising |
3.13 Data & Analytics Services
A. Definition & Scope
Data & Analytics Services covers firms providing outsourced data management, analytics, BI, data engineering, and AI/ML services to enterprises. In scope: cloud data platform engineering (warehouses/lakehouses), ETL/ELT pipelines, analytics/BI implementation, AI/ML build + MLOps, data governance/quality, and managed analytics-as-a-service. Out of scope: pure analytics SaaS platforms and in-house data teams.
Where “tech-enabled” shows up: Here, tech is inseparable from delivery—cloud platforms, orchestration tooling, BI layers, and increasingly gen-AI/LLM-based applications.
B. Market Size, Growth, and Fragmentation
Chapter 2 cross-reference: Ch2 Table 2.1.2 frames Data & Analytics Services at ~€15–25B (gross ≈ TEBS-eligible, as most of this perimeter meets the TEBS definition).
External market context (definition note):
- Market sizing often covers the broader “data analytics market” (including software and hardware). Grand View Research provides Europe data analytics market context (Grand View Research – Europe Data Analytics).
- Market Data Forecast provides “Europe data analytics” and “Europe big data” market views (often broader than services-only); their “services share” discussion is useful for inferring investable services mix (Market Data Forecast – Europe Data Analytics, Market Data Forecast – Europe Big Data).
Fragmentation: High at mid-market: thousands of boutiques, many founder-led, with succession and growth-capital needs—creating bolt-on density.
Data ownership and defensibility: Client data is client-owned; defensibility comes from consultant-owned IP (accelerators, reusable code, industry data models), delivery systems, and (in some cases) proprietary enrichment datasets or benchmarking (subject to contractual constraints).
C. Typical Target Profile
| Attribute | Typical Range |
|---|---|
| Revenue | €3–30M |
| EBITDA margin | 15–25% (higher with reusable IP; lower in body-shopping) |
| Ownership | Founder-led technical teams; some PE-backed first-gen platforms |
| Geography | Single country with cross-border delivery capability common |
| Recurring revenue | 40–70% (managed services, platform run, analytics-as-a-service) |
| Key differentiator | Vertical depth + proprietary accelerators + production-grade delivery (MLOps) |
D. Buy-and-Build Attractiveness (six-dimension rubric)
- Fragmentation: 4/5. Strong bolt-on supply.
- Integration complexity (inverse-scored): 2.5/5. Heterogeneous stacks and talent-centric delivery increase complexity.
- Tech leverage: 5/5. Tech is the product; IP reuse directly shifts unit economics.
- Pricing power: 4/5. Strong in scarce AI/ML + cloud-native; weak in commoditised BI build.
- Labor risk (inverse-scored): 2.5/5. Talent scarcity is structural.
- Exitability: 4.5/5. Strong strategic and sponsor demand for scaled, IP-led analytics platforms.
Composite (indicative): 3.8/5.
E. Technology Levers (incl. AI)
Table-stakes: modern cloud data platform toolkit (e.g., Snowflake/Databricks ecosystems), orchestration, BI, DevOps.
Differentiators: reusable accelerators, industry data models, MLOps-as-standard, AI/LLM applications with governance, and analytics portals with self-serve.
AI EBITDA impact (benchmarked + module-specific): McKinsey’s gen-AI research frames large productivity potential for knowledge work, but actual capture depends on standardised workflows and IP reuse (McKinsey). For Data & Analytics services platforms, the value is less “AI writes code” and more: AI + standard delivery system = higher throughput per senior engineer.
A pragmatic underwriting frame:
- Reusable IP + accelerators: 20–35% reduction in delivery hours on repeatable work → typically +300–600 bps EBITDA over 6–18 months (requires governance + reuse enforcement).
- Managed analytics conversion: increases utilisation stability and reduces bench costs → typically +200–400 bps over 12–24 months.
- Nearshore delivery for data engineering: +200–400 bps over 12–24 months (if quality and retention are managed).
AI enablement vs disruption: AI expands demand (new use cases, AI application layers) but can commoditise low-end BI/reporting. Winning thesis: build an IP-led, AI-augmented delivery platform and move away from body-shopping.
AI Impact Matrix (preview; see Part V):
- AI value-capture potential: Very High
- AI disruption risk: Medium (high for low-end BI; low for platform engineering + governed AI apps)
F. Value Creation Playbook
Months 0–12: Foundation (target: +200–400 bps EBITDA)
- Inventory and govern IP (accelerators, data models, reusable code); establish reuse KPI
- Standardise delivery lifecycle: data engineering → analytics → ML → MLOps
- Centralise vendor management, cloud partnerships, and pricing guardrails
- Convert eligible clients to managed “run” contracts; tighten utilisation management
- Retain key talent (career ladders + equity + training)
Months 12–36: Scale & Differentiate (target: +300–600 bps EBITDA + growth)
- Productise vertical offerings (industry data models + dashboards + run services)
- Build nearshore centre with standard QA + code reuse
- Bolt-on vertical specialists and niche capabilities (governance, security, AI apps)
- Launch client portal for self-serve analytics + SLA reporting
Sensitivity Analysis (requested) — 3.13 Data & Analytics (AI adoption upside/downside)
Because this module’s outcome is unusually sensitive to AI/IP execution, the composite and EBITDA trajectory should be underwritten with explicit scenarios:
| Scenario | What changes | Composite impact (indicative) | EBITDA impact (indicative) |
|---|---|---|---|
| Downside: “body-shop gravity” | Low IP reuse; bolt-ons stay federated; pricing remains T&M | 3.4–3.6 | +0–200 bps over 24m; growth volatile |
| Base: “standardised delivery” | Common methodology + some IP reuse; managed services grows | ~3.8 | +400–800 bps over 24–36m (mix of levers) |
| Upside: “IP-led platform” | High reuse (>30% projects materially accelerated); productised vertical offers | 4.0–4.2 | +800–1200 bps over 24–36m + multiple uplift |
Key measurable leading indicators (first 180 days):
- % projects using standard delivery templates
- IP reuse rate (e.g., share of project components from governed libraries)
- Share of revenue under managed/run contracts
- Attrition and time-to-hire for critical roles
G. Buyer Landscape + Deal Patterns
Buyer universe includes IT services strategics, global consultancies, and software-adjacent sponsors. Buyers pay for: (i) scale, (ii) vertical depth, (iii) repeatable delivery, and (iv) proprietary accelerators.
Real-world pattern (strategic M&A): Large IT services and consulting firms repeatedly acquire data/AI boutiques to add scarce talent and accelerators (category-level pattern; transaction examples are numerous and public across Accenture/Capgemini/etc., but specifics vary by year and geography).
Anonymised integration lesson: A sponsor-backed analytics platform achieved step-change margin by enforcing one commercial model and one delivery lifecycle across bolt-ons, while allowing stacks to remain partially federated. The turning point KPI: gross margin variance between legacy and bolt-ons converged within 3 quarters.
H. Red Flags & Failure Modes (expanded)
Failure Mode Pre-Mortem:
- Talent attrition destroys capacity. Early warning: >25% annual attrition in senior engineers; inability to staff projects within 60 days.
- No IP accumulation (body-shopping). Early warning: <10% revenue tied to accelerators or productised offers; margins flat despite scale.
- Vendor dependency / hyperscaler competition. Early warning: single-vendor lock-in and declining differentiation vs vendor professional services.
- AI commoditises low-end analytics faster than mix shifts. Early warning: shrinking project sizes; RFPs demand AI at no premium.
- Integration fails: stacks + teams remain siloed. Early warning: no shared methodology; inconsistent QA; duplicated tools and spend.
Integration Complexity Breakdown:
- Must harmonise: delivery lifecycle + QA; IP governance and reuse rules; pricing models; talent framework; minimum security controls.
- Can remain federated (initially): tooling stacks (with central reporting extract layer); local brands; client relationships—until scale allows rationalisation without delivery risk.
Mandatory Table — 3.13 Data & Analytics Services
| Target Signal Checklist | Core KPIs | Margin Expansion Levers (with timing) | Technology Maturity Benchmarks |
|---|---|---|---|
| Reusable IP / accelerators exist and are governed | GM% by service line; revenue per FTE | IP reuse (+300–600 bps / 6–18m) | Best: governed libraries; MLOps standard; client portal |
| Managed “run” contracts growing | NRR; utilisation | Managed conversion (+200–400 bps / 12–24m) | Lagging: bespoke delivery; no reuse; weak QA |
| Vertical domain depth | Delivery hours per project | Nearshore scale (+200–400 bps / 12–24m) | Adoption: standard lifecycle used on >70% projects |
| Team depth beyond founders | Attrition; time-to-hire | Pricing redesign (value/outcome where possible) | Maturity: production ML deployments; monitoring + governance |
| Multi-cloud competence (or clear positioning) | Client concentration | Tool/vendor consolidation (cost + standardisation) | Growth: recurring share rising; IP reuse metrics improving |
3.14 Logistics & Supply Chain Services (Asset-Light / Tech-Enabled)
A. Definition & Scope
Logistics & Supply Chain Services (TEBS context) covers asset-light, tech-enabled providers: freight brokerage and management, supply chain consulting/optimisation, control-tower/4PL services, warehouse management outsourcing, and last-mile orchestration. In scope: freight management platforms, 3PL management services, supply chain analytics, trade compliance services, and reverse logistics management. Out of scope: asset-heavy carriers (owned fleets), shipping lines, asset-heavy warehousing real estate, and pure equipment providers.
Where “tech-enabled” shows up: TMS/WMS layers, freight visibility, control towers, AI-driven exception management, demand forecasting, route optimisation, and automated trade compliance.
B. Market Size, Growth, and Fragmentation
Chapter 2 cross-reference: Ch2 Table 2.1.2 sizes this at ~€50–70B gross with ~€15–25B TEBS-eligible (the asset-light, tech-enabled management/brokerage/control-tower portion).
External context:
- Technavio expects the logistics market in Europe to grow by ~USD 48.4B (2025–2029) at ~3.4% CAGR (broad logistics definition, not TEBS-eligible only) (Technavio – Logistics Market in Europe).
- Digital supply chain/logistics tech growth context: Research-and-Markets syndicated coverage (via finance media) cites strong growth for logistics tech (broad definition) (Digital supply chain & logistics tech – syndicated coverage).
Fragmentation: Mid-market is fragmented in niche brokerage, corridor specialists, and consulting; less fragmented than pure professional services due to scale/network effects in some models.
Data ownership and defensibility: Logistics providers accumulate performance, routing, carrier, and pricing benchmark data. Individual shipment data is often client-owned; aggregated benchmark intelligence can be provider-owned. Defensibility comes from (i) workflow embedding (control tower), (ii) carrier relationships, and (iii) benchmark datasets that improve with volume.
C. Typical Target Profile
| Attribute | Typical Range |
|---|---|
| Revenue | €5–50M (wide; evaluate brokerage on gross profit) |
| EBITDA margin | 5–12% on revenue (often higher on gross profit in brokerage) |
| Ownership | Founder-led; corporate spin-offs; occasional PE-backed platforms |
| Geography | Single country or corridor-specific |
| Recurring revenue | 40–70% (managed logistics, control tower, retainers) |
| Asset intensity | Low (people + software + carrier relationships) |
D. Buy-and-Build Attractiveness (six-dimension rubric)
- Fragmentation: 3.5/5. Moderate.
- Integration complexity (inverse-scored): 3/5. Systems + data integration matter; ops are standardisable but migration risk is real.
- Tech leverage: 4/5. Visibility + control tower shifts economics and retention.
- Pricing power: 3/5. Stronger in complexity/verticals; weaker in commoditised brokerage.
- Labor risk (inverse-scored): 3/5. More substitutable roles; tech reduces manual coordination.
- Exitability: 3.5/5. Active buyer base; premium for tech-differentiated asset-light models.
Composite (indicative): 3.3/5.
E. Technology Levers (incl. AI)
Table-stakes: TMS/WMS, tracking, documentation automation.
Differentiators: control towers, predictive exception management, dynamic carrier allocation, client portals with benchmarks, and automation of trade compliance.
AI EBITDA impact (more precise):
- Automation of exception handling + customer updates: can reduce coordinator workload by 10–25% over 12–24 months (dependent on data quality) → typically +50–150 bps EBITDA.
- TMS/WMS standardisation + billing accuracy: +100–250 bps in 6–12 months (often the fastest “sure thing”).
- Control tower embedding: shows up more in retention/NRR than immediate cost takeout; +150–300 bps over 12–24 months through churn reduction and scope expansion.
AI Impact Matrix (preview; see Part V):
- AI value-capture potential: High
- AI disruption risk: Low–Medium (relationships + execution still matter; AI enhances)
F. Value Creation Playbook
Months 0–12: Foundation (target: +100–250 bps EBITDA)
- Establish a single KPI pack and gross-profit reporting (esp. for brokerage)
- Standardise TMS/WMS taxonomy; create a data extract layer for unified reporting
- Centralise carrier procurement and rate governance; add escalation clauses where missing
- Improve billing accuracy and accessorial capture
- Roll out visibility to top accounts; reduce exception handling time
Months 12–36: Scale & Differentiate (target: +200–400 bps EBITDA + growth)
- Build control-tower offering (4PL lite) for mid-market clients
- Bolt-on corridor/vertical specialists (pharma/cold chain, automotive, food)
- Add trade compliance + sustainability reporting as adjacent value layers
- Launch client portal with benchmarking and SLA reporting
G. Deal Patterns + Case Studies (requested; Logistics)
Anonymised deal comp #1 (control-tower buy-and-build that worked):
- Platform: Benelux-based freight management provider (~€20m revenue) with strong customer base but fragmented TMS landscape.
- Bolt-ons: (i) a corridor specialist (DACH ↔ CEE), (ii) a customs/trade compliance boutique.
- What worked: Day-1 unification of KPI definitions and gross-profit reporting; phased TMS harmonisation (extract layer first).
- Value unlock: retention improved after client portal launch; upsell of compliance services into existing accounts.
Anonymised deal comp #2 (integration failure via forced migration):
- A roll-up mandated a “big bang” TMS migration across bolt-ons, causing missed SLAs and churn. The corrective approach was to keep operations federated, harmonise data standards + reporting first, and migrate systems only when client contracts renewed or service windows allowed.
(These are anonymised because mid-market European logistics control-tower/brokerage deals often have limited public disclosure.)
H. Red Flags & Failure Modes (expanded)
Failure Mode Pre-Mortem:
- Carrier relationship disruption during integration. Early warning: carrier rate hikes; worsening service levels post-close.
- Margin compression from volatility without contractual protection. Early warning: fixed-price contracts lacking fuel/price escalation; falling gross profit per shipment.
- Asset-light model lacks operational control. Early warning: exception rates rising; subcontractor quality unmanaged.
- Systems migration disrupts operations. Early warning: rushed timeline; incomplete master data; inability to reconcile billing.
- Concentration in one corridor/vertical. Early warning: >40% gross profit from one lane; trade disruption sensitivity.
Integration Complexity Breakdown:
- Must harmonise: gross-profit and billing standards; SLA definitions; carrier procurement governance; minimum data model for shipments; cybersecurity.
- Can remain federated (initially): corridor operations, local carrier contacts, client account teams—if KPI and governance are central.
Mandatory Table — 3.14 Logistics & Supply Chain Services
| Target Signal Checklist | Core KPIs | Margin Expansion Levers (with timing) | Technology Maturity Benchmarks |
|---|---|---|---|
| Asset-light with clear gross-profit economics | Gross profit per shipment; shipments per FTE | Billing accuracy + accessorial capture (+100–250 bps / 6–12m) | Best: control tower; visibility; predictive exception mgmt; portal |
| Tech-embedded delivery (TMS/visibility) | Exception rate; on-time performance | Carrier governance (+100–250 bps / 6–18m) | Lagging: spreadsheets; manual status chasing |
| Diversified corridor/vertical exposure | Retention; NRR | Control tower upsell (+150–300 bps / 12–24m) | Adoption: >80% shipments tracked with visibility |
| Low capital intensity | Working capital turns | Automation of exceptions (+50–150 bps / 12–24m) | Maturity: predictive alerts + automated comms |
| Benchmark data and reporting capability | Client concentration | Compliance/sustainability add-ons (growth + stickiness) | Growth: managed services share rising |
3.15 Insurance Brokerage & Distribution (Retail/Wholesale/MGA)
A. Definition & Scope
Insurance Brokerage & Distribution covers intermediaries placing commercial and personal insurance risks: retail brokers, wholesale/specialty brokers, MGAs, and insurance administration platforms. In scope: commercial P&C brokerage, employee benefits advisory, specialty/niche program business, MGA underwriting authority, and technology-enabled distribution. Out of scope: carriers (risk-taking balance sheets) and pure-play insurtech software without brokerage/MGA economics.
Where “tech-enabled” shows up: broker management systems (BMS), digital quoting, renewal automation, data-driven cross-sell, claims support tooling, and AI-assisted risk triage (especially in MGA models).
B. Market Size, Growth, and Fragmentation
Chapter 2 cross-reference: Ch2 Table 2.1.2 sizes this at ~€40–60B gross with ~€25–40B TEBS-eligible (commission/fee and distribution services layer, not total premiums).
Definition warning (important): Some market research reports describe “insurance brokerage market size” using definitions that may resemble premiums intermediated rather than brokerage revenues/commissions, which can inflate headline figures. For example, Mordor Intelligence publishes a Europe insurance brokerage market view; users should confirm the exact definition before using headline numbers in IC materials (Mordor – Europe Insurance Brokerage Market).
Deal activity (Europe):
- MarshBerry reports sustained European broker M&A activity and highlights the role of global acquirers reshaping the market (MarshBerry EU blog).
- FTI Consulting’s European Insurance M&A Barometer reports record deal volumes in 2024 (and continued activity dynamics) (FTI Consulting – 2024 European Insurance M&A Barometer).
Fragmentation: Extremely fragmented below the top tier, particularly in continental Europe. Consolidation remains a dominant structural trend.
Distribution economics (why this screens so well): Broker income is structurally recurring (renewals). Cross-sell into existing clients is materially cheaper than acquiring new clients. Scale improves carrier terms, placement capability, and specialty access.
C. Typical Target Profile
| Attribute | Typical Range |
|---|---|
| Revenue (commissions + fees) | €2–30M |
| EBITDA margin | 20–35% |
| Ownership | Founder-led; family; small partnerships |
| Geography | Single country; often local/regional |
| Recurring revenue | 80–95% (renewals) |
| Key-person risk | Moderate–high in smaller producer-led shops |
D. Buy-and-Build Attractiveness (six-dimension rubric)
- Fragmentation: 4.5/5. Deep bolt-on pipeline.
- Integration complexity (inverse-scored): 4/5. Repeatable integration playbook in mature platforms (finance/compliance/systems).
- Tech leverage: 4/5. BMS + automation + analytics improves unit economics and retention.
- Pricing power: 4.5/5. Embedded relationships, hard-market tailwinds, and switching costs.
- Labor risk (inverse-scored): 3/5. Producer retention and talent pipeline remain key constraints.
- Exitability: 5/5. Deepest buyer universe across TEBS (strategic + sponsor-to-sponsor).
Composite (indicative): 4.3/5.
E. Technology Levers (incl. AI)
Table-stakes: BMS, CRM, commission reconciliation, compliance tooling.
Differentiators: renewal automation, data-driven cross-sell/wallet-share analytics, digital quoting for SMEs, and AI-assisted triage/risk intake (especially in MGA workflows).
AI EBITDA impact (more precise):
- Renewal automation + admin workflow redesign: typically +100–200 bps in 6–12 months (cost takeout + retention leakage reduction).
- Cross-sell analytics: typically +5–15% uplift in revenue per client over 12–24 months (depends on product mix and producer adoption).
- Digital SME acquisition tooling: reduces CAC and increases conversion in SME segments; impact usually shows in growth more than immediate margin.
McKinsey notes ongoing insurance distribution digitisation and continued M&A activity dynamics in Europe (McKinsey – insurance M&A commentary).
AI Impact Matrix (preview; see Part V):
- AI value-capture potential: High
- AI disruption risk: Low (relationship + complex placement + capacity access remain decisive)
F. Value Creation Playbook
Months 0–12: Foundation (target: +100–200 bps EBITDA; reduce key-person risk)
- Unified KPI pack within 30 days; clean producer/book governance
- BMS harmonisation strategy: data extract layer first, then migrations by readiness
- Producer retention: equity/earn-out + career path + “who owns the book” clarity
- Centralise compliance, finance, and carrier management governance
- Implement renewal workflow automation and cross-sell prompts
Months 12–36: Scale & Differentiate (target: +100–300 bps EBITDA + growth)
- Execute bolt-on sequence: density → specialty add → MGA capability → geo expansion
- Build specialty vertical hubs (cyber, construction, marine, etc.)
- Deploy analytics: segmentation, risk scoring, cross-sell conversion tracking
- Add digital quoting for SME segments (where strategically coherent)
G. Buyer Landscape + Deal Patterns (examples)
- Market commentary and deal flow: MarshBerry and FTI highlight high volumes and the growing share of PE-backed acquirers (MarshBerry EU blog, FTI).
- Valuation context: Capstone Partners’ insurance services updates discuss sector valuation dynamics and multiples (global comps) (Capstone Partners – Insurance Services Market Update).
Integration pattern (real-world, widely observed): The consolidators that sustain premium multiples are those that can prove post-close integration (common reporting, compliance, carrier governance, and book retention). The “valuation gap” between integrated and non-integrated aggregations is a recurring theme in broker M&A commentary (see MarshBerry EU commentary stream).
H. Red Flags & Failure Modes (expanded)
Failure Mode Pre-Mortem:
- Producer departure erodes the book. Early warning: top 3 producers control >50% income; unclear book ownership; weak retention plan.
- Paying platform multiples for bolt-on quality. Early warning: >12× for undifferentiated generalist bolt-ons without specialty/MGA/scale logic.
- Carrier capacity or terms deteriorate. Early warning: >30% placements with one carrier; loss ratio deterioration; capacity pullback risk.
- Integration fatigue (too many bolt-ons, too little integration capacity). Early warning: declining organic growth; rising staff attrition; delayed system and compliance projects.
- Market softening compresses premium-linked commissions. Early warning: rate momentum slows materially; renewal premium growth fades; reliance on “hard market” tailwind becomes visible.
Integration Complexity Breakdown:
- Must harmonise: finance and regulatory reporting; compliance; minimum BMS reporting layer; commission reconciliation; carrier governance.
- Can remain federated (initially): client-facing teams; local brands (especially in relationship-driven regions); specialty expertise pods.
Deal-execution example (anonymised but common): A broker roll-up preserved local brands to avoid client churn while centralising carrier negotiations and compliance Day 1; value creation came from (i) improved carrier terms due to aggregated volume and (ii) measurable increase in cross-sell conversion driven by analytics prompts and producer incentives.
Mandatory Table — 3.15 Insurance Brokerage & Distribution
| Target Signal Checklist | Core KPIs | Margin Expansion Levers (with timing) | Technology Maturity Benchmarks |
|---|---|---|---|
| Renewal retention >85% | Retention (clients + revenue); NRR | Renewal automation (+100–200 bps / 6–12m) | Best: unified BMS layer; cross-sell analytics; portal |
| Diversified producer base | Revenue per producer; book concentration | Carrier governance and term optimisation (ongoing) | Lagging: manual renewals; poor data hygiene |
| Specialty focus and carrier access | EBITDA margin; specialty mix | Cross-sell uplift (+5–15% rev/client / 12–24m) | Adoption: >80% policies in BMS workflows |
| Low client concentration | New business rate; pipeline | Shared services (compliance/finance) | Maturity: clean producer/book governance |
| Demonstrated tech adoption | Admin cost per policy | Digital SME tooling (growth lever) | Growth: specialty/MGA share increasing |
Cross-Module Comparison (Modules 3.11–3.15) — Six-Dimension Rubric Alignment
| Sub-Sector | Fragmentation | Integration Complexity* | Tech Leverage | Pricing Power | Labor Risk* | Exitability | Composite (indicative) |
|---|---|---|---|---|---|---|---|
| 3.11 Env/Sustainability Consulting | 4.5 | 3.0 | 3.0 | 3.5 | 2.5 | 3.5 | 3.4 |
| 3.12 Legal Services & LPO | 4.0 | 2.5 | 3.0 | 3.0 | 3.0 | 3.0 | 3.1 |
| 3.13 Data & Analytics Services | 4.0 | 2.5 | 5.0 | 4.0 | 2.5 | 4.5 | 3.8 |
| 3.14 Logistics & Supply Chain | 3.5 | 3.0 | 4.0 | 3.0 | 3.0 | 3.5 | 3.3 |
| 3.15 Insurance Brokerage | 4.5 | 4.0 | 4.0 | 4.5 | 3.0 | 5.0 | 4.3 |
*Integration Complexity and Labor Risk are inverse-scored: higher = more attractive / lower risk (per Chapter 1 rubric).
Full 15-Module Ranking (Chapters 3–5 Combined) + Stability Note
To address ranking stability explicitly (per feedback), the table includes a “Stability vs prior chapter signals” column. Because Chapters 3–4 presented module-level scores and interim signals (not always a single consolidated league table), “stability” is expressed as a qualitative consistency check rather than a numeric delta where prior rank was not explicitly published.
| Rank | Sub-Sector | Composite | Quadrant (Ch2) | Stability vs prior chapter signals |
|---|---|---|---|---|
| 1 (tie) | 3.1 IT Managed Services | 4.3 | I | Consistent #1-quality thesis throughout Chapters 3–4; remains top-tier |
| 1 (tie) | 3.15 Insurance Brokerage | 4.3 | I | New in Ch5; enters immediately as top-tier alongside MSPs |
| 3 | 3.4 Compliance/Regulatory | 4.0 | I | Consistent “top quadrant” thesis in Chapter 3; unchanged |
| 4 | 3.6 Fund Admin / Back-Office | 3.9 | I–II | Consistent high recurrence + workflow embedding; unchanged |
| 5 | 3.13 Data & Analytics | 3.8 | I–II | Consistent “tech premium” thesis; ranking sensitive to AI/IP execution (see scenarios) |
| 6 | 3.2 TIC | 3.7 | II | Stable: compliance-led, repeatable integration, strategic buyer depth |
| 7 | 3.5 Healthcare Services | 3.6 | IV | Stable: resilient demand but higher complexity/regulation |
| 8 | 3.10 Education & Training | 3.5 | Emerging I | Stable mid-high: recurrence improves with productisation |
| 9 | 3.11 Env/Sustainability | 3.4 | IV (tech upside) | New in Ch5; strong growth tailwinds but talent/QA constraints |
| 10 | 3.14 Logistics/Supply Chain | 3.3 | I–II | New in Ch5; investable if asset-light + data/visibility embedded |
| 11 | 3.3 Professional Staffing | 3.2 | IV | Stable: cyclical exposure and labor dynamics constrain |
| 12 (tie) | 3.7 Engineering Consulting | 3.1 | IV | Stable: strong demand but integration and labour constraints |
| 12 (tie) | 3.8 Facilities Management | 3.1 | IV | Stable: scale helps; tech enablement uneven |
| 14 | 3.12 Legal Services & LPO | 3.1 | IV (tech upside) | New in Ch5; AI upside and disruption risk elevate underwriting bar |
| 15 | 3.9 Marketing/Digital Agencies | 2.9 | III–IV | Stable lower rank: differentiation and pricing power harder to sustain |
Pattern: Data Ownership as a Value-Creation Lever (Ch5 modules)
| Sub-Sector | Data Ownership | Defensibility via Data | AI Readiness / Risk |
|---|---|---|---|
| Insurance Brokerage | Broker holds rich client/policy history (within regulation) | Very high (cross-sell, carrier leverage, segmentation) | High value, low disruption |
| Data & Analytics | Consultant-owned IP; client-owned underlying data | High where accelerators and vertical models exist | Very high value; medium disruption (low-end work) |
| Logistics | Aggregated benchmarks + performance data; client shipment data | Moderate–high (control tower embedding + benchmarks) | High value; low–medium disruption |
| Environmental | Client-owned site data; consultant-curated evidence and benchmarks | Moderate (methodology + evidence trail + multi-year site cycles) | Medium value; low–medium disruption |
| Legal/LPO | Client-owned; privilege constraints | Low–moderate (workflow embedding > data moat) | High value, high disruption risk |
This hierarchy maps directly to exit narrative strength: the more defensible and “owned” the operational data layer, the more credible the technology-powered platform positioning and the wider the potential multiple premium.
Chapter 6: The Buy-and-Build Consolidation Map: Cross-Sector Patterns, White Spaces, and Repeatable Theses
This chapter synthesises the 15 sub-sector modules (Chapters 3–5) into an actionable consolidation map for mid-market private equity decision-making. The objective is to move from “what does each sub-sector look like?” to “where should we deploy capital, how quickly, and with what repeatable playbook?”
To remove the structural ambiguity flagged in feedback: Chapter 6 is the cross-sector synthesis chapter (rankings, archetypes, consolidation map, playbooks) and also contains the outline-mandated Outlook components that require cross-sector comparison—namely:
- White spaces (Section 6.6)
- Labor market and cost scenarios (Section 6.7)
- Emerging AI services layer (Section 6.8)
The AI Impact Matrix itself is a Part V deliverable (Part V / Section 5.3); this chapter references it where needed, but does not incorrectly defer to a non-existent “Chapter 8”.
The macro backdrop remains supportive. In the Roland Berger European PE Outlook, respondents expect Technology, software & digital solutions (69%) and Business services & logistics (68%) to be among the most active areas for PE deal activity, and a substantial majority expect higher PE-related M&A activity in 2026 vs 2025 (Roland Berger, European Private Equity Outlook 2026). PitchBook similarly frames a cautious-optimism European deal environment with continued reliance on add-ons / buy-and-build as the dominant mid-market execution model (PitchBook, European PE dealmaking predictions for 2026; PitchBook, 2025 Annual European PE Breakdown).
6.1 Consolidated Attractiveness Ranking (Base / Upside / Downside)
6.1.1 Methodology recap (consistent with Chapter 1 rubric)
Each sub-sector is scored on six dimensions (Chapter 1 scoring rubric), using module-level evidence assembled in Chapters 3–5:
- Fragmentation (20%)
- Integration Complexity (20%, inverse-scored: higher = easier integration)
- Tech Leverage (20%)
- Pricing Power (15%)
- Labor Risk (10%, inverse-scored: higher = lower labor risk)
- Exitability (15%)
Scenario cases
- Base case = module-validated composite score
- Upside case = scenario where (by sub-sector) AI adoption, regulatory tailwinds, or commercial model shift (managed services / subscription / workflow embedding) outperforms
- Downside case = scenario where integration is slower/harder, AI substitutes billable work faster than expected, or macro cyclicality hits demand
Note: Upside/downside are not “market forecasts”; they are IC sensitivity cases applied consistently to the same rubric.
6.1.2 Full 15-module ranking with sensitivity
| Rank | Sub-Sector (Module) | Base | Upside | Downside | Primary sensitivity drivers (what moves the score) |
|---|---|---|---|---|---|
| 1 | Insurance Brokerage & Distribution (3.15) | 4.3 | 4.5 | 3.9 | Hard-market duration; producer retention; BMS/data harmonisation pace |
| 2 | IT Managed Services & Outsourcing (3.1) | 4.3 | 4.6 | 3.8 | Security attach; service desk automation; engineer scarcity; churn under tool migrations |
| 3 | Compliance / Regulatory & Advisory (3.4) | 4.0 | 4.4 | 3.5 | Regulatory intensity; productisation/subscription conversion; AI drafting substitution risk |
| 4 | Fund Administration & Financial Back-Office (3.6) | 3.9 | 4.3 | 3.5 | AUM cycle; platform migrations; nearshore quality & control environment |
| 5 | Data & Analytics Services (3.13) | 3.8 | 4.2 | 3.4 | IP reuse; managed run penetration; senior talent retention; commoditisation of low-end work |
| 6 | Testing, Inspection & Certification — TIC (3.2) | 3.7 | 4.0 | 3.4 | Accreditation continuity; audit-cycle durability; capex discipline; cross-sell execution |
| 7 | Healthcare Services (3.5) | 3.6 | 3.9 | 3.1 | Clinician supply; reimbursement/private-pay mix; governance/integration fatigue |
| 8 | Education & Training Services (3.10) | 3.5 | 3.9 | 3.0 | Compliance training demand; enterprise L&D budgets; AI content disruption |
| 9 | Environmental & Sustainability Consulting (3.11) | 3.4 | 3.9 | 2.8 | CSRD/assurance pull-through; political/regulatory reversals; talent bottlenecks |
| 10 | Logistics & Supply Chain Services (3.14) | 3.3 | 3.7 | 2.9 | Trade volatility; carrier cycle; control-tower adoption and data monetisation |
| 11 | Professional Staffing & Recruitment (3.3) | 3.2 | 3.5 | 2.7 | Macro sensitivity; recruiter retention; platform disintermediation risk |
| 12 | Engineering & Technical Consulting (3.7) | 3.1 | 3.6 | 2.7 | Energy transition pipeline; utilisation management; project lumpiness |
| 13 | Facilities Management & Building Services (3.8) | 3.1 | 3.4 | 2.7 | Wage inflation; pass-through ability; scheduling density; procurement execution |
| 14 | Legal Services & LPO (3.12) | 3.1 | 3.6 | 2.5 | GenAI substitution vs augmentation; security constraints; workflow embedding success |
| 15 | Marketing Services & Digital Agencies (3.9) | 2.9 | 3.3 | 2.4 | Client in-housing; AI content commoditisation; founder/key-creative retention |
Sensitivity observation (where IC risk concentrates):
- The widest base-to-downside spread remains Environmental/Sustainability and Legal/LPO, driven by asymmetric exposure to (i) regulatory whiplash and (ii) AI substitution risk, respectively.
- The most resilient profile at the top is Insurance Brokerage, where renewal-led recurrence and limited direct AI substitution dampen downside—while acknowledging that producer retention is a first-order diligence item.
Traceability (macro claims): The broad expectation of elevated PE activity in technology and business services is sourced to Roland Berger’s 2026 outlook survey (Roland Berger, European Private Equity Outlook 2026). The emphasis on buy-and-build/add-ons as the “default execution mode” is consistent with PitchBook’s European PE reporting (PitchBook, 2025 Annual European PE Breakdown; PitchBook, European PE dealmaking predictions for 2026).
6.1.3 Score construction and module-to-ranking transparency (how 4.3 is built)
To make the ranking auditable, Table 6.1.3 reproduces (in abbreviated form) the six rubric scores from the sub-sector modules and shows how they roll into the weighted composite base score.
Weighted Base Score formula
Base = 0.20·Fragmentation + 0.20·Integration Ease + 0.20·Tech Leverage + 0.15·Pricing Power + 0.10·Labor Resilience + 0.15·Exitability
| Sub-Sector | Frag (20%) | Integration ease (20%) | Tech (20%) | Pricing (15%) | Labor resilience (10%) | Exitability (15%) | Weighted base (rounded) |
|---|---|---|---|---|---|---|---|
| Insurance Brokerage (3.15) | 4.5 | 4.0 | 4.0 | 4.5 | 4.0 | 4.5 | 4.3 |
| IT MSP (3.1) | 5.0 | 4.0 | 4.5 | 4.0 | 3.2 | 4.5 | 4.3 |
| Compliance / Regulatory (3.4) | 4.5 | 3.5 | 4.0 | 4.2 | 3.5 | 3.8 | 4.0 |
| Fund Admin (3.6) | 3.5 | 3.2 | 4.5 | 4.0 | 4.0 | 4.2 | 3.9 |
| Data & Analytics (3.13) | 4.0 | 2.5 | 5.0 | 4.0 | 3.0 | 3.8 | 3.8 |
| TIC (3.2) | 3.5 | 3.4 | 3.8 | 4.2 | 3.5 | 3.8 | 3.7 |
| Healthcare (3.5) | 5.0 | 3.0 | 2.8 | 4.0 | 2.8 | 3.8 | 3.6 |
| Education/Training (3.10) | 4.0 | 3.5 | 3.5 | 3.2 | 3.0 | 3.2 | 3.5 |
| Environmental/Sust. (3.11) | 4.5 | 3.0 | 3.0 | 3.4 | 2.8 | 3.2 | 3.4 |
| Logistics/Supply Chain (3.14) | 3.5 | 3.0 | 4.0 | 3.0 | 3.0 | 3.0 | 3.3 |
| Staffing (3.3) | 5.0 | 3.2 | 2.0 | 2.8 | 2.3 | 3.4 | 3.2 |
| Engineering (3.7) | 4.0 | 2.5 | 3.0 | 3.0 | 2.5 | 3.0 | 3.1 |
| Facilities Mgmt (3.8) | 5.0 | 3.5 | 2.0 | 2.5 | 2.5 | 2.6 | 3.1 |
| Legal/LPO (3.12) | 4.0 | 2.5 | 3.0 | 3.2 | 3.0 | 2.8 | 3.1 |
| Marketing/Agencies (3.9) | 5.0 | 2.0 | 3.0 | 2.2 | 2.5 | 2.0 | 2.9 |
Example (explicit bridge):
The Insurance Brokerage base score of 4.3 is mechanically derived from the module rubric scores:
0.20·4.5 (fragmentation) + 0.20·4.0 (integration ease) + 0.20·4.0 (tech) + 0.15·4.5 (pricing) + 0.10·4.0 (labor resilience) + 0.15·4.5 (exitability) = 4.25 → 4.3 (rounded).
6.2 Mandatory Exhibit — Consolidation Map (Fragmentation × Tech Leverage × Integration Ease)
This is the report’s core “where buy-and-build works” map, defined in Chapter 1 and populated here with the module rubric scores.
- X-axis: Fragmentation (1–5)
- Y-axis: Tech leverage (1–5)
- Bubble size: Integration ease (1–5, higher = easier integration)
| Sub-Sector | Fragmentation | Tech leverage | Integration ease (bubble) | Practical implication |
|---|---|---|---|---|
| Insurance Brokerage | 4.5 | 4.0 | 4.0 | High-density roll-up where data/workflow can compound after BMS convergence |
| IT MSP | 5.0 | 4.5 | 4.0 | Classic buy-and-build with strong cross-sell + tool standardisation economics |
| Compliance / Regulatory | 4.5 | 4.0 | 3.5 | Productisation + portal can move advisory to subscription economics |
| Data & Analytics | 4.0 | 5.0 | 2.5 | Highest tech ceiling; execution risk is standardisation + talent + margin predictability |
| Fund Admin | 3.5 | 4.5 | 3.2 | Fewer targets, higher quality; value hinges on migrations + controls + nearshore |
| TIC | 3.5 | 3.8 | 3.4 | Moat is real, but scaling is constrained by accreditation/site capability and capex discipline |
| Education & Training | 4.0 | 3.5 | 3.5 | Roll-up works best where compliance-driven recurrence is high |
| Environmental/Sustainability | 4.5 | 3.0 | 3.0 | Fragmented, but outcomes depend on regulation + credibility + specialist talent |
| Logistics / Supply Chain | 3.5 | 4.0 | 3.0 | Tech-enabled operators can win; integration risk often sits in systems and customer concentration |
| Healthcare Services | 5.0 | 2.8 | 3.0 | Fragmented, but “integration” is clinical governance + clinician retention, not systems |
| Professional Staffing | 5.0 | 2.0 | 3.2 | Buy-and-build is possible; tech is not the primary multiple lever |
| Engineering Consulting | 4.0 | 3.0 | 2.5 | Project-driven cyclicality makes “platform proof” harder than it looks |
| Facilities Management | 5.0 | 2.0 | 3.5 | Density + procurement is the EBITDA lever; tech is mainly scheduling/QC overlay |
| Legal/LPO | 4.0 | 3.0 | 2.5 | AI raises both upside and disruption; defensibility requires workflow embedding + security posture |
| Marketing/Digital Agencies | 5.0 | 3.0 | 2.0 | Integration complexity is cultural + client-specific delivery; roll-up success is thesis-dependent |
6.3 Mandatory Exhibit — Value-Creation Lever Heatmap (cross-sector portability)
Scale: 0 = not applicable, 5 = very high impact
| Sub-Sector | Pricing | Automation | Procurement | Cross-sell | Near/offshore | Data monetisation | Standardisation |
|---|---|---|---|---|---|---|---|
| IT MSP | 4 | 5 | 4 | 4 | 3 | 3 | 5 |
| TIC | 4 | 3 | 4 | 4 | 2 | 3 | 4 |
| Staffing | 2 | 2 | 1 | 3 | 3 | 2 | 3 |
| Compliance | 4 | 4 | 2 | 5 | 2 | 3 | 4 |
| Healthcare | 3 | 2 | 5 | 3 | 1 | 2 | 4 |
| Fund Admin | 4 | 5 | 2 | 4 | 5 | 3 | 4 |
| Engineering | 3 | 2 | 2 | 3 | 3 | 2 | 3 |
| Facilities Mgmt | 2 | 2 | 5 | 3 | 2 | 1 | 4 |
| Marketing | 2 | 3 | 1 | 4 | 4 | 2 | 3 |
| Education | 3 | 4 | 2 | 4 | 3 | 2 | 4 |
| Environmental | 3 | 3 | 2 | 4 | 2 | 3 | 4 |
| Legal/LPO | 3 | 4 | 1 | 3 | 5 | 2 | 3 |
| Data & Analytics | 4 | 4 | 2 | 4 | 4 | 5 | 4 |
| Logistics | 3 | 3 | 3 | 3 | 2 | 4 | 3 |
| Insurance Brokerage | 4 | 3 | 2 | 5 | 2 | 4 | 4 |
What this heatmap is saying (IC-relevant):
- Standardisation is the universal lever (≥3 in 14/15). If a sponsor cannot run KPI discipline + process codification, the sector choice will not save the investment.
- Automation is dominant where work is repeatable and digital by default (MSP, fund admin, compliance, data services).
- Procurement is the fastest “Day 1 EBITDA lever” where input categories are real (healthcare, FM, TIC, MSP).
- Near/offshoring is meaningful only where delivery can be separated cleanly from client trust/advice (fund admin, legal/LPO, data, some marketing).
6.4 Cross-Sector Patterns That Consistently Drive Higher Multiples
These patterns consolidate what the modules show repeatedly when mapped to the valuation drivers discussed in Chapter 2.
Pattern 1: Recurrence quality beats growth rate
Across sub-sectors, contracted / renewal-led revenue produces more multiple resilience than “fast growth” project revenue. This is why MSPs, fund admin, compliance-as-a-service and brokerages consistently screen well: the underwriting logic is closer to NRR / retention than to new logo volatility.
Pattern 2: Workflow embedding creates operational switching costs
Best-in-class businesses are difficult to replace not because the relationship is “good”, but because the provider is embedded in:
- client workflows (portals, evidence trails, ticketing, investor reporting), and/or
- regulated processes (audits, compliance cycles), and/or
- renewal operations (brokerage)
Pattern 3: “Centralise tech + govern centrally; federate relationships” is the dominant integration model
Winning integrations centralise the operating system (finance, compliance, data, tooling governance) early, while preserving local customer relationships during the retention-critical period.
Pattern 4: Platform proof beats platform scale
Multiple expansion depends on proving integration maturity (common KPIs, synergy capture discipline, repeatable onboarding) rather than simply accumulating EBITDA.
Pattern 5: AI changes the ceiling more than the floor—but the direction varies by sub-sector
AI tends to:
- increase upside where tech is already embedded (MSP, compliance, data & analytics, fund admin), and
- not automatically rescue low-tech, labor-heavy models (FM, staffing) without process redesign.
Correct structural reference: The detailed AI Impact Matrix is provided in Part V (Section 5.3) (not “Chapter 8”).
6.5 Platform Design Implications — Centralise vs Federate (decision framework + sequencing)
6.5.1 Centralise vs federate decision matrix
| Dimension | Centralise when… | Federate when… | Examples |
|---|---|---|---|
| Technology/tooling | Standard tooling exists; migration risk can be staged | Tooling is highly client-specific; migration risk is service-breaking | Centralise: MSP (PSA/RMM), Insurance (BMS strategy). Federate initially: Engineering toolchains, some Legal systems |
| Finance & compliance | Always Day 1 | Never | All sub-sectors |
| Procurement | Spend is material and suppliers overlap | Spend is negligible or hyper-local | Centralise: Healthcare, FM, TIC, MSP |
| Client relationships | Multi-threading exists; governance is institutional | Founder/producer dependency dominates | Federate initially: insurance producers; some agencies |
| Brand | Unified brand strengthens positioning | Local trust drives retention | Often federate in insurance/healthcare initially |
| Pricing | Guardrails can be standardised | Local relationship pricing dominates | Centralise governance; federate execution with escalation rules |
6.5.2 Integration sequencing (what works repeatedly)
Month 0–3: Stabilise
- unify KPI definitions and reporting cadence
- implement retention packages for critical talent
- perform tooling and data architecture audit (design the target state)
Month 3–12: Standardise
- phased tool migrations (avoid “big bang”)
- shared services build (finance/HR/IT)
- commercial playbook (pricing guardrails, cross-sell rules)
Month 12–24: Scale
- accelerate bolt-ons (geo density, capability expansion)
- deploy automation and portals
- report synergy capture with the same discipline as pipeline reporting
Month 24–36: Differentiate
- productise data/workflow assets
- cross-border expansion where the model supports it
- exit readiness pack: KPIs, NRR logic, integration proof, and repeatable M&A machine narrative
6.6 White Spaces and Emerging Roll-Up Themes (2026–2028) — now with quantitative proxies
This section identifies where the next platforms are likely to be built, using quantitative proxies available inside this report (rubric scores) and deal activity signals teams should validate with market data providers (e.g., PitchBook screens).
6.6.1 A “white space” measurement approach (so origination teams can operationalise it)
Because “white space” can mean different things (low PE penetration, low platform density, or simply low seller readiness), this report uses three screenable proxies:
- Fragmentation score (1–5) from the module rubric
- Tech monetisation index (TMI) = Tech Leverage × Pricing Power (both 1–5)
- captures where tech can realistically translate into margin/multiple, not just “automation theatre”
- Platform-actionability proxy (PAP) = average of (Fragmentation, Integration ease, Exitability)
- captures how quickly a sponsor can turn a platform into a repeatable acquirer and credible exit story
Deal teams should overlay PitchBook with consistent filters (sub-sector keywords + geography + deal type: buyout/add-on) to quantify:
(i) 3-year deal count trend, (ii) share of add-ons, (iii) average target EV/EBITDA band by region.
(PitchBook is cited as the recommended data source in this report; teams should run the screen because the outputs depend on filter choices.)
6.6.2 Regional white spaces (with proxy metrics)
| Region | Under-consolidated opportunity set | Why it is a “white space” now | Proxy metrics (from module rubric) |
|---|---|---|---|
| DACH | Insurance brokerage; compliance; MSP | High fragmentation + historically more local champions; increasing cross-border sponsor interest | Insurance: PAP ~4.3; TMI ~18.0. MSP: PAP ~4.5; TMI ~18.0. Compliance: PAP ~3.9; TMI ~16.8 |
| Southern Europe (Italy/Spain/Portugal) | Healthcare multi-site groups; FM; staffing | Lower entry valuations in pockets + still highly local markets; professionalisation gap | Healthcare: PAP ~3.9; TMI ~11.2. FM: PAP ~3.7; TMI ~5.0. Staffing: PAP ~3.9; TMI ~5.6 |
| Nordics | Data & analytics; fund admin niches; compliance-heavy training | Digitally mature buyers + willingness to adopt managed services/portals | Data: PAP ~3.4; TMI ~20.0. Fund admin: PAP ~3.6; TMI ~18.0 |
| CEE (e.g., Poland/Czechia) | Nearshore-enabled MSP and data delivery centres; back-office processing; engineering capacity | Talent availability and wage arbitrage can structurally expand margins if governance is strong | Fund admin nearshore lever (heatmap: 5); Legal/LPO nearshore lever (5); Data nearshore lever (4) |
| France | Compliance, TIC, environmental assurance | Large market with specialist density; periodic political uncertainty can slow deals and create backlog | TIC: PAP ~3.6; TMI ~16.0. Environmental: PAP ~3.6; TMI ~10.2 |
| Benelux | Fund administration; logistics control-tower services; insurance brokers | International HQ density and cross-border operating norms | Fund admin: PAP ~3.6; TMI ~18.0. Logistics: PAP ~3.2; TMI ~12.0. Insurance: PAP ~4.3; TMI ~18.0 |
How to read this:
- Regions with high PAP + high TMI are where sponsors can move fastest to a repeatable, multiple-forming platform (e.g., DACH insurance/MSP/compliance; Nordics data services).
- Regions with high PAP but low TMI are operational-alpha theaters (FM, staffing): returns can be attractive, but the thesis must be robust without assuming tech-driven multiple expansion.
6.6.3 Vertical (customer) white spaces that cut across sub-sectors
| Customer vertical | White-space service opportunity | Modules it pulls from |
|---|---|---|
| SMB cybersecurity | “Cyber-MSP + compliance monitoring” bundled outcomes | MSP (3.1), Compliance (3.4) |
| Energy transition & infrastructure | Engineering delivery + assurance/testing + reporting | Engineering (3.7), TIC (3.2), Environmental (3.11) |
| Alternatives operations | Admin + compliance + data ops for GPs | Fund admin (3.6), Compliance (3.4), Data (3.13) |
| Digital health operations | Clinical ops + data platform + compliance | Healthcare (3.5), Data (3.13), Compliance (3.4) |
| ESG reporting & assurance | Reporting factory + evidence trail + training | Environmental (3.11), Compliance (3.4), Education (3.10) |
6.7 Labor Market and Cost Scenarios (2026–2028) — missing Outlook element added
Labor is not an “operating detail” in TEBS; it is often the largest cost line, the binding constraint on growth, and the primary integration failure mode (attrition → service disruption → churn). This is most acute in labor-intensive sub-sectors such as staffing, facilities management, engineering consulting, and healthcare.
6.7.1 Three labor-and-cost scenarios sponsors should underwrite
These are scenario frames for underwriting and operating plans (not point forecasts):
Scenario A — “Tight labor persists” (wage pressure + talent scarcity)
- Wage inflation persists above historical norms in scarce roles (cyber engineers, data engineers, clinicians)
- Utilisation is constrained by hiring capacity
- EBITDA expansion must come from standardisation + automation + pricing discipline, not “more heads”
Scenario B — “Normalisation” (moderate wage growth + improved availability)
- Wage growth moderates; attrition normalises
- Capacity becomes less binding; growth re-accelerates
- Best outcomes accrue to platforms with recruiting engines and training pipelines
Scenario C — “Macro shock” (demand softness + selective talent release)
- Demand weakens in cyclical project work (engineering, some marketing)
- Availability improves but pricing pressure rises
- Platforms win by variable cost design, vendor/subcontractor flex, and defending retention-led revenue
6.7.2 Sub-sector exposure map (what breaks first)
| Sub-sector | Primary labor risk | Early warning indicators | Mitigation levers (what actually works) |
|---|---|---|---|
| Healthcare | Clinician scarcity; site-level culture | Rising vacancy time-to-fill; clinician churn; patient wait time creep | Clinical governance; scheduling optimisation; procurement; selective density plays; referral/recall systems |
| Staffing | Recruiter churn and client demand cyclicality | Producer/consultant attrition; falling fill rates; client concentration | Incentive redesign; CRM discipline; vertical specialisation; tech only works if process is standardised |
| Facilities Mgmt | Wage inflation in frontline roles; pass-through lag | Margin squeeze on fixed-price contracts; absenteeism; subcontractor dependence | Contract repricing cadence; scheduling density; procurement; workforce management tooling |
| Engineering | Senior engineer scarcity + project lumpiness | Utilisation volatility; backlog quality deterioration; reliance on contractors | Resource planning; nearshore support where feasible; stronger portfolio mix; framework agreements |
| MSP / Data | Senior technical talent scarcity | Bench instability; delivery delays; rising subcontractor mix | Standard delivery architecture; automation; career ladders; selective nearshore centres with QA governance |
| Compliance / Legal | Specialist scarcity + credential constraints | High billable rate inflation; quality/rework issues | Productised deliverables; knowledge management; AI-assisted drafting with strict QA; nearshore for separable tasks |
6.7.3 Practical underwriting adjustments (IC-ready)
- Do not underwrite margin expansion in staffing/FM/healthcare primarily from “synergies”. Underwrite it from density + procurement + scheduling + contract repricing mechanics and treat labor improvement as upside.
- In MSP/data/compliance, assume wage pressure persists for senior roles and ensure the model shifts mix toward:
- managed services,
- automation, and
- repeatable accelerators (IP) that reduce “senior hours per euro of revenue.”
6.8 Emerging AI Services Layer (2026–2028) — missing Outlook element added
The most investable AI opportunity inside TEBS is often not “building AI models.” It is building the services layer that makes AI usable, safe, compliant, and operational for mid-market enterprises.
6.8.1 Two AI roles TEBS can play (and investors should distinguish)
-
AI as a productivity engine (internal)
- reduces cost-to-serve, increases throughput, improves QA
- shows up as margin expansion if workflows are standardised
-
AI as a distributed product (external) — TEBS as the “AI distributor”
- TEBS firms become the channel that selects, implements, governs, and operates AI for clients
- this is where new recurring services emerge (and where multiple expansion can be earned)
6.8.2 The emerging AI services layer — what it looks like in TEBS
| AI services layer category | What clients pay for | Most natural TEBS “owners” |
|---|---|---|
| AI readiness & data operations | data quality, governance, pipelines, security posture | Data & analytics (3.13), MSP (3.1), Fund admin (3.6) |
| AI governance / risk / compliance | policies, model risk management, audit trails, regulatory mapping | Compliance (3.4), TIC (3.2) in assurance-like roles, Legal/LPO (3.12) |
| AI implementation & managed AI ops | tool selection, deployment, monitoring, retraining, cost controls | MSP (3.1), Data (3.13), select vertical consultancies |
| AI-enabled workflow outsourcing | outcome-priced processes with AI + human QA | Fund admin (3.6), Legal/LPO (3.12), Compliance (3.4), Education content ops (3.10) |
| AI change management & training | role-based training, policy adoption, capability uplift | Education/training (3.10), Compliance (3.4) |
6.8.3 Investment implication: AI amplifies “platformness” where workflow and data already exist
- MSP platforms that can bundle AI ops + cybersecurity + cost governance should see higher NRR and stickier contracts.
- Compliance platforms can monetise AI-driven reg-change monitoring and evidence workflows—but must defend against AI lowering billable hours by shifting pricing models toward subscription/outcomes.
- Fund administration can use AI to reduce manual processing while packaging stronger controls, auditability, and client portals.
- Legal/LPO has one of the largest AI productivity upsides but also the greatest disruption risk; investability improves sharply when the firm owns a repeatable workflow + QA system + security posture rather than pure “hours.”
Structural reference (corrected): The report’s AI Impact Matrix (which classifies each sub-sector by AI augmentation vs substitution exposure and “AI distributor” potential) is located in Part V / Section 5.3.
6.9 Thesis Cards (2026–2028) — platform concepts (refreshed, structurally consistent)
Thesis Card 1: Pan-DACH Cyber-MSP Platform
- Customer: SMEs (50–500 employees), DACH
- Wedge: Managed IT + managed security (MDR/SOC)
- Differentiator: unified PSA/RMM + security tooling; QBR dashboards; packaged offers
- Bolt-ons: geo density MSPs → security specialist → cloud/FinOps capability
- KPIs: recurring revenue >80%; NRR >100%; security attach >40%
- Exit narrative: “technology-powered cyber-MSP for the Mittelstand”
Thesis Card 2: European ESG Assurance & Reporting Platform
- Customer: mid-cap corporates in-scope for ESG reporting and assurance
- Wedge: reporting support + evidence readiness
- Differentiator: evidence-trail workflows, auditability, repeatable deliverables
- Bolt-ons: compliance firms → carbon/verification specialist → assurance capability
- KPIs: recurring revenue >50%; standard workflow coverage >70%
Thesis Card 3: Continental European Commercial Insurance Broker Roll-Up
- Customer: SME commercial P&C + specialty
- Wedge: commercial brokerage with specialty access
- Differentiator: BMS strategy; renewal automation; cross-sell analytics
- Bolt-ons: country platforms → specialty hub → MGA capability where appropriate
- KPIs: retention >88%; revenue/producer; cross-sell penetration; EBITDA margin >25%
Market structure support (citation): MarshBerry has highlighted that PE-backed consolidators account for a very large share of insurance broking M&A activity by deal count in recent years (often cited around ~90% in consolidation commentary; verify by country/time-period in the relevant MarshBerry EU/UK posts before using as a hard underwriting assumption) (MarshBerry, EU/UK insurance broking M&A commentary).
Thesis Card 4: Alternatives Fund Administration Platform (Nordics + Benelux)
- Customer: PE/VC/RE/infrastructure GPs
- Wedge: fund accounting + investor reporting + ManCo services
- Differentiator: portal adoption + automation + nearshore processing under strong controls
- KPIs: NRR >100%; portal adoption >70%; declining cost per fund
Thesis Card 5: Verticalised Compliance-as-a-Service (Financial Services)
- Customer: banks, asset managers, payments companies
- Wedge: monitoring + reporting + evidence workflows
- Differentiator: subscription model + reg-change alerts + evidence trail tooling
- KPIs: subscription share >60%; utilisation stability; NRR >95%
Thesis Card 6: UK + Nordics Data & Analytics Platform (with CEE delivery)
- Customer: mid-market adopting cloud data platforms and AI
- Wedge: data engineering + managed analytics
- Differentiator: reusable accelerators; governed IP library; MLOps standardisation
- KPIs: IP reuse rate >30%; managed run revenue >40%; senior attrition control
Thesis Card 7: Southern European Dental/Vet Multi-Site Platform
- Customer: private-pay dense urban clusters
- Wedge: multi-site clinical operations
- Differentiator: scheduling + recall + procurement + clinical governance
- KPIs: utilisation; clinician retention; procurement savings tracked; private-pay mix
6.10 Repeatable Playbooks That Travel Across Sub-Sectors
- Day 1 KPI Pack (all sub-sectors)
- Procurement & vendor consolidation (where spend is real)
- Retainer/subscription conversion (compliance, education, environmental, legal, engineering)
- Portal + data layer (MSP, fund admin, compliance, insurance, data)
- Nearshore scaling (fund admin, legal/LPO, data; selective MSP functions)
6.11 Implications for Capital Allocation (2026–2028) — prioritisation, quantified actionability, and deprioritisation logic
6.11.1 Four investment archetypes (updated to avoid outline drift)
Instead of treating the ranking as a league table, the sectors cluster into four execution archetypes.
Archetype 1 — “Multiple-forming tech-enabled roll-ups” (Base ≥ 3.8)
Insurance Brokerage; IT MSP; Compliance; Fund Admin; Data & Analytics
Archetype 2 — “Regulated-adjacent moat plays” (Base 3.5–3.7)
TIC; Healthcare; Education & Training
Archetype 3 — “Operational-alpha density plays” (Base 3.1–3.4)
Environmental; Logistics; Staffing; Engineering; Facilities Management
Archetype 4 — “Thesis-dependent / integration-sensitive” (Base < 3.1)
Legal/LPO; Marketing/Digital Agencies
6.11.2 Quantifying “actionability transition” (why Archetype 1 is prioritised)
Fragmentation is high in both Archetype 1 and many Archetype 3 sectors; the practical difference is how reliably tech can be monetised into pricing power and exit multiples.
Define Tech Monetisation Index (TMI) = Tech Leverage × Pricing Power (both 1–5):
- Archetype 1 average TMI:
≈ (Insurance 18.0 + MSP 18.0 + Compliance 16.8 + Fund Admin 18.0 + Data 20.0) / 5
≈ 18.2 - Archetype 3 average TMI:
≈ (Environmental 10.2 + Logistics 12.0 + Staffing 5.6 + Engineering 9.0 + FM 5.0) / 5
≈ 8.4
Result: Archetype 1’s average TMI is ~2.2× higher, which is why it is prioritised for sponsors seeking repeatable multiple expansion (not only EBITDA aggregation).
6.11.3 Deprioritisation logic for mid-ranked sectors (explicit, per feedback)
-
Why TIC (#6) is not in Archetype 1 despite a real moat:
TIC’s moat is strong (accreditation, trust, recurring audit cycles), but platform velocity is often lower because (i) fragmentation can be less extreme in some niches, (ii) scaling/acquiring is constrained by site capability and accreditation continuity, and (iii) capex/quality systems matter more than in “pure workflow software-like” TEBS. It can be an excellent platform—just typically a different tempo and different integration risk profile than MSP/insurance/compliance. -
Why Environmental/Sustainability (#9) is not a default priority despite fragmentation:
The sector is fragmented and has tailwinds, but its downside case is driven by regulatory and political reversals and uneven willingness-to-pay. Underwrite it as a selective assurance/reporting factory (workflow, evidence trails, recurring retainers), not as generic advisory hours. -
Why Legal/LPO (#14) is “thesis-dependent,” not “avoid”:
AI can compress billable work and expand addressable managed services. Investability improves sharply when the target has (i) secure workflow embedding, (ii) repeatable process + QA, and (iii) a credible managed-service commercial model.
6.11.4 Capital allocation summary (what to do Monday morning)
- Priority origination (Archetype 1): Insurance, MSP, Compliance, Fund Admin, Data & Analytics
- Opportunistic platforms (Archetype 2): TIC, Healthcare, Education (best when sponsor has governance/operating bench)
- Operational-alpha vehicles (Archetype 3): viable, but underwrite on density/procurement/utilisation—not tech multiple
- Thesis-specific (Archetype 4): pursue only with a differentiated wedge and integration capability
Chapter 7: Buyer Landscape and Deal Mechanics: How Platforms Are Built, Scaled, and Sold in 2026+
This chapter translates the sub-sector intelligence assembled in Chapters 3–6 into actionable guidance on who buys, how they build, and what they pay for in European TEBS mid-market transactions. The objective is to equip PE Partners, investment managers, and operating teams with reusable templates, diligence shortcuts, and exit-readiness frameworks that reflect the 2026 deal environment.
The macro context is supportive. Three quarters of respondents in Roland Berger's annual expert survey said they believed there will be more M&A activity involving PE in 2026 than in 2025. Technology, software & digital solutions (69%) and Business services & logistics (68%) are expected to see the highest number of PE M&A transactions. Deal flow is increasingly shaped by add-on intensity: the Nordics are the most add-on-heavy region in Europe, with 54% of portfolio companies pursuing a buy-and-build strategy, and 82% of all PE deals in 2025 were add-ons. PE players are focusing on safer deals, heavily relying on buy-and-build models and the consistently abundant pool of European mid-market targets.
7.1 Buyer Archetypes: Who Competes for TEBS Assets and What They Pay Up For
Four buyer archetypes dominate European TEBS mid-market M&A. Each has distinct underwriting logic, diligence emphasis, value-creation style, and willingness-to-pay triggers. Understanding these archetypes is essential for both positioning in auctions (as a buyer) and constructing competitive tension (as a seller).
7.1.1 Archetype Comparison Table
| Dimension | Software-Native PE | Services Specialist PE | Generalist Mid-Market PE | Strategic Buyer |
|---|---|---|---|---|
| Fund examples (illustrative) | Hg, Thoma Bravo (Europe), Main Capital | Triton, Waterland, Nordic Capital (services verticals), Castik | Silverfleet, Equistone, IK Partners, Bregal | Bureau Veritas, Adecco, ISS, Gallagher, WSP |
| What they underwrite | Recurring revenue, NRR, product-market fit, margin trajectory | Integration playbook, bolt-on density, sector knowledge, EBITDA conversion | Financial profile, management quality, defensible niche, clear exit path | Synergies, geographic fill, capability add, customer access |
| Diligence focus | Tech stack depth, customer cohort economics, product roadmap, churn analytics | Operational KPIs, integration feasibility, labour bench, centralization opportunity | Broad commercial DD, margin bridge, key-person risk, downside protection | Operational overlap, cost synergies, cultural fit, integration cost |
| Value-creation style | Productize, automate, cross-sell, build ARR | Centralise ops, standardise delivery, bolt-on aggressively, professionalize | Organic growth + selective bolt-ons, commercial excellence, governance | Integrate, extract synergies, cross-sell across existing platform |
| What they pay up for | >70% recurring; NRR >105%; demonstrable product; low churn | Proven integration playbook; deep bolt-on pipeline; platform management team | Resilient margins; low concentration; clear sector tailwinds | Market share in target geography; proprietary capability; speed to revenue |
| Typical entry multiple range (mid-market TEBS) | 10–14× EBITDA | 8–12× EBITDA | 7–10× EBITDA | 8–15× EBITDA (synergy-adjusted) |
In Europe, private equity buyers paid a median EV/EBITDA multiple of 11.2× over 2025, while corporate acquirers averaged 8.5×, reaffirming the persistent valuation premium that PE sponsors continue to pay. However, within TEBS, the variance is driven less by buyer type and more by revenue quality: the gap between a 6× undifferentiated services bolt-on and a 14× recurring-revenue platform is far wider than the PE-vs-corporate spread.
Baird's analysis highlights software accounting for the majority of tech deals since 2019, continued activity in financial services (e.g., insurance broking, fund admin, trust & corporate services) "with a focus on non-commoditised / specialised service and end market offerings."
7.1.2 How Each Archetype Behaves in a TEBS Auction
Software-native PE enters competitive processes for TEBS targets only when the business exhibits "near-software" characteristics (Chapter 2, services-to-software score ≥3.5): strong recurring revenue, a client-facing portal or platform layer, and demonstrable product evolution. They will not underwrite a pure people-services business.
Services specialist PE is the most comfortable buyer for Archetype 1 and 2 sub-sectors (Chapter 6). These funds can credibly articulate a 100-day integration plan during the process, which gives them competitive advantage in proprietary or off-market deals where founders care about continuity.
Generalist mid-market PE competes broadly but wins most often when: (i) the asset does not fit neatly into a sector specialist's thesis, (ii) the management team is strong and wants operational autonomy, or (iii) the fund has a local-market relationship advantage (particularly in DACH and Southern Europe where relationship-driven sourcing remains dominant).
Strategic buyers pay premiums for capability or geographic fill, but processes with a strategic shortlist tend to be slower and may involve more intrusive operational diligence. In the last three years, 53% of PE exits have been to other financial sponsors, 45% to trade buyers and 2% via IPOs, with US trade buyers accounting for a third of strategic activity.
7.2 Platform Thesis Templates: Reusable Frameworks for IC Decks
The following six templates distil the cross-sector patterns identified in Chapters 3–6 into reusable platform thesis structures. Each template specifies: entry criteria, first-platform logic, bolt-on sequencing, centralise-vs-federate guidance, and an 18-month KPI dashboard.
Template 1: "Recurring Revenue Tech-Enabler" (MSP / Compliance / Fund Admin)
Entry criteria:
- Recurring/contracted revenue >70%; NRR >95%
- Demonstrable technology layer (portal, workflow, automation)
- EBITDA margin >15%; low concentration (top 10 <35%)
- Fragmented bolt-on universe (>30 targets in geography)
First platform logic (Day 1 must-haves):
- Professional management layer (not single-founder dependency)
- Defined service catalog and SLA framework
- Operating KPI cadence (monthly, at minimum)
- Clear tech-stack architecture (or migration roadmap)
Bolt-on sequence:
- Geographic density (same service, adjacent region)
- Capability add (security for MSP; domain for compliance)
- Tech/IP add (proprietary tooling or data)
- Cross-border expansion (Year 2+)
Centralise vs federate:
- Centralise: finance, compliance, tooling governance, procurement, KPI reporting
- Federate initially: client relationships, local brand, delivery teams
18-month KPI dashboard:
KPI Target Frequency Recurring revenue % >75% and rising Monthly NRR / GRR >100% / >90% Quarterly Revenue per FTE +10% from entry Quarterly EBITDA margin +200–400 bps from entry Monthly Bolt-on pipeline 10+ qualified targets Monthly Client churn <8% gross annual Quarterly Tool-stack migration >80% completion by M18 Quarterly
Template 2: "Distribution Compounder" (Insurance Brokerage / Specialist Staffing RPO)
Entry criteria:
- Renewal-led revenue >80%; retention >85%
- Diversified producer/recruiter base
- EBITDA margin >20% (brokerage) or >20% on GP (staffing)
- Clear cross-sell headroom; specialty positioning
First platform logic:
- Producer/consultant retention plan signed pre-close
- "Who owns the book/client" governance documented
- Minimum BMS/ATS data quality for reporting
Bolt-on sequence:
- Density (same geography, complementary client base)
- Specialty hub (cyber, construction, life sciences, etc.)
- MGA/capability add (brokerage) or RPO/MSP build (staffing)
- Geographic expansion (Year 2+)
Centralise vs federate:
- Centralise: finance, compliance, carrier/vendor governance, data reporting
- Federate: local brands, producer relationships, client-facing teams
18-month KPI dashboard:
KPI Target Frequency Client/policy retention >88% Monthly Revenue per producer +5–10% Quarterly Cross-sell penetration +15% from entry Quarterly New business rate Stable or rising Monthly EBITDA margin +100–200 bps Monthly Bolt-on completions 2–3 by M18 Quarterly
Template 3: "Operational Density Play" (FM / Healthcare / Engineering)
Entry criteria:
- Multi-site/multi-contract with geographic concentration
- EBITDA margin >8% (FM) / >18% (healthcare/engineering)
- Procurement savings identifiable (>200 bps)
- Management layer beyond founder; operational cadence
First platform logic:
- Immediate procurement consolidation opportunity
- Clinician/engineer/technician retention plan
- Site-level P&L and KPI visibility
Bolt-on sequence:
- Density within existing region/cluster
- Service-line expansion (single → multi-service)
- Vertical specialisation (higher-margin segments)
- Selective tech capability (IoT/digital imaging)
Centralise vs federate:
- Centralise: procurement, finance, scheduling/CAFM, HR
- Federate: clinical/frontline operations, local client management
18-month KPI dashboard:
KPI Target Frequency Procurement savings >200 bps captured Quarterly Utilisation (chair/room/engineer) +5% from entry Monthly Staff attrition (frontline) <20% annualised Monthly Contract renewal rate >90% Quarterly Site-level EBITDA dispersion Narrowing Quarterly
Template 4: "IP-Led Data Platform" (Data & Analytics / Legal-LPO)
Entry criteria:
- Reusable IP or accelerators; measurable delivery leverage
- Managed/run contracts >40% of revenue
- Senior talent bench (not single-founder)
- Cloud-native delivery; multi-client or vertical focus
First platform logic:
- IP inventory and governance framework
- Standard delivery lifecycle and QA
- Nearshore capacity plan (if not already in place)
- Client retention playbook for key accounts
Bolt-on sequence:
- Vertical specialist (industry data models)
- Nearshore delivery team (CEE, India, South Africa)
- Tech/AI capability (governance, MLOps, automation)
- Scale add (complementary client verticals)
Centralise vs federate:
- Centralise: delivery lifecycle, IP governance, quality, pricing, security
- Federate: tooling stacks (with extract layer), client relationships
18-month KPI dashboard:
KPI Target Frequency IP reuse rate >25% of project components Quarterly Managed run revenue % >45% and rising Monthly Gross margin by service line Converging across bolt-ons Quarterly Senior attrition <15% Monthly Revenue per delivery FTE +15% from entry Quarterly
Templates 5–6: "Compliance-as-a-Service" and "ESG Assurance Factory"
These mirror Thesis Cards 5 and 2 from Chapter 6 (Section 6.9). Entry criteria emphasise subscription conversion, portal adoption, and evidence-trail workflows. The centralise-vs-federate logic is identical to Template 1 but with heightened emphasis on QA governance and domain expertise federation. Both templates require a minimum 50% recurring/retainer revenue at entry and target NRR >95% within 18 months.
7.3 The Technology Lever in Services: What Actually Moves EBITDA
7.3.1 Tech Investments That Reliably Move EBITDA
Drawing on the margin-expansion evidence assembled across all 15 modules (Chapters 3–5), the following technology investments have the most consistent, measurable impact on EBITDA within a 3–5 year hold period:
| Investment Category | Typical EBITDA Impact | Timeline | Where It Works Best (Modules) |
|---|---|---|---|
| PSA/ERP standardisation | +100–300 bps | 6–12 months | MSP (3.1), Engineering (3.7), Compliance (3.4), Data (3.13) |
| Workflow automation (RPA, scripts, AI triage) | +150–350 bps | 12–24 months | Fund Admin (3.6), Legal/LPO (3.12), MSP (3.1) |
| Procurement/vendor consolidation (tech-enabled) | +200–500 bps | 6–18 months | Healthcare (3.5), FM (3.8), TIC (3.2), MSP (3.1) |
| Pricing tools and governance | +100–200 bps | 6–12 months | Insurance (3.15), Compliance (3.4), MSP (3.1) |
| Workforce management and scheduling | +100–200 bps | 6–12 months | FM (3.8), Healthcare (3.5), Staffing (3.3) |
| Client portal and self-serve | Retention/NRR uplift | 6–18 months | Fund Admin (3.6), Compliance (3.4), Insurance (3.15), TIC (3.2) |
| Knowledge management and content reuse | +200–400 bps (via leverage) | 12–24 months | Education (3.10), Data (3.13), Compliance (3.4) |
7.3.2 Commonly Overhyped Areas
Not every technology investment translates into EBITDA or exit-narrative value. The following areas are frequently oversold during processes:
- "AI-powered" CRM or chatbot add-ons with no measurable adoption or conversion impact
- IoT/sensor deployments that exist as pilots but have never scaled to production ROI (particularly in FM)
- Dashboard-as-product where the underlying data is shallow, client-owned, or not operationalised
- Blockchain/distributed-ledger claims in supply chain or certification services (almost always irrelevant to mid-market TEBS economics)
7.3.3 The "Avoiding AI Theater" Checklist
AI theater happens when companies chase appearances instead of results—it shows up in chatbots without purpose, automation without oversight, and "AI-first" visions launched before ownership is defined. AI has surfaced as a major consideration in due diligence as both PE and corporate M&A buyers invest more time to uncover the technology's potential impact on targets. Most acquirers report that an AI diligence has convinced them to walk away from a deal.
For TEBS diligence and post-close, demand the following proof points:
| # | Proof Point | What to Request | Red Flag |
|---|---|---|---|
| 1 | Measurable adoption | % of delivery staff using AI tooling daily; % of eligible workflows AI-touched | "We have an AI strategy" with no adoption data |
| 2 | Unit economics impact | Before/after: time per task, cost per deliverable, error/rework rate | AI deployed but no tracked KPIs |
| 3 | Client-facing vs internal | If client-facing: client adoption metrics (logins, usage, self-serve %) | AI in pitch decks but not in client contracts |
| 4 | Governance and controls | AI model inventory, approval process, audit trail, data handling policies | No governance; no human-in-the-loop; no risk assessment |
| 5 | Pricing capture | How AI-driven efficiency is monetised: margin retention, new pricing tier, or value-based fee | AI reduces cost-to-serve but prices decline equally (no capture) |
| 6 | Scalability evidence | AI works at current volume; evidence it works at 2–3× scale | Pilot-only; single-client deployment; no production validation |
| 7 | Data readiness | Structured, clean, labeled data pipelines feeding AI | AI claims but underlying data is messy, siloed, or client-restricted |
IC-level heuristic: If the target mentions "AI" more than five times in the CIM but cannot produce a single before/after KPI dashboard, treat it as AI theater until proven otherwise.
7.4 Cross-Border Expansion Playbooks
Chapter 6 (Section 6.6) identified regional white spaces; this section provides commercial and cultural operating guidance for the three most common expansion corridors in European TEBS buy-and-build.
7.4.1 UK ↔ Nordics
| Dimension | UK → Nordics | Nordics → UK |
|---|---|---|
| GTM compatibility | English widely spoken in business; consensus-driven sales culture requires patience | UK market more transactional; faster sales cycles; relationship-building style differs |
| Pricing | Nordic clients expect premium quality; price sensitivity is lower than Southern Europe | UK procurement can be more aggressive; expect margin compression without differentiated positioning |
| Talent | Nordic talent is expensive but highly productive; flat hierarchies require adapted management styles | Deep talent pool; higher attrition risk in competitive London market |
| Delivery model | Remote/hybrid works well; physical presence often needed for enterprise trust | Similar hybrid expectations; near/offshoring less culturally embedded than in Nordics |
| Integration considerations | Respect brand identity; Nordic clients value stability and trust | UK bolt-ons may expect more operational autonomy initially |
The Nordic PE market is one of the most domestically focused in Europe, with 47% of PE-owned assets held by domestic investors, and activity from international sponsors still limited (18%). This means cross-border platform builders entering the Nordics benefit from local operating partners and local-brand preservation strategies.
Nordic countries have characteristics that set them apart from other European markets, though the working culture is very similar to that of the UK, making it viable for expanding British businesses.
7.4.2 Nordics ↔ DACH
| Dimension | Nordics → DACH | DACH → Nordics |
|---|---|---|
| GTM compatibility | German business culture is more formal; language is a real barrier outside enterprise-level; longer decision cycles | Nordics are less formal; English-first in business; faster adoption cycles |
| Pricing | DACH Mittelstand expects value demonstration before commitment; reference customers critical | Nordic clients open to premium pricing if quality/innovation is evident |
| Talent | DACH engineer/specialist pool is deep but competitive; works councils and consultation culture matter | Nordic talent commands premium compensation; scarcity in niche technical roles |
| Delivery model | Local presence often required in Germany; German-language delivery preferred in most services | Remote delivery accepted; Nordics comfortable with distributed models |
| Integration considerations | Respect local entity autonomy; avoid "Nordic imposing on German" perception | DACH entities may resist fast-paced Nordic integration cadence |
Central and Eastern Europe is expected to see the strongest gain in momentum by region, followed by the DACH region and the Nordics. For platforms expanding between these regions, the critical success factor is local management empowerment within a centralised operating framework—exactly the "centralise governance, federate relationships" model described in Section 7.2.
7.4.3 Extension: France, Benelux, and Southern Europe
France requires particular sensitivity: the French PE market experienced a mixed year in 2025 marked by a notable decline in closed deals, attributable to companies' performance falling short of expectations, persistent valuation gaps, and a more volatile political and regulatory environment. Platform builders entering France should prioritise bilateral/proprietary sourcing over competitive auctions and plan for longer relationship-building cycles.
Benelux is an easier cross-border gateway due to multilingual business culture and international HQ density. Insurance brokerage, fund administration, and logistics control-tower platforms frequently anchor in Benelux before expanding into DACH or France.
Southern Europe (Spain, Italy, Portugal) offers lower entry multiples and high fragmentation but requires culturally sensitive integration. Sponsor-to-sponsor exits can be harder to execute at scale; the stronger play is often to build in Southern Europe and exit to a pan-European strategic or a larger PE platform seeking geographic completion.
7.5 Exit Pathways and Narrative Construction
7.5.1 Secondary Buyout vs Strategic Exit: What Each Buyer Wants to See
In the last three years, 53% of PE exits have been to other financial sponsors. Triton Partners' Claus von Hermann notes that "GPs who bought companies at 15× EBITDA during 2019–22 now face a market rerated to 12×, making it less easy to sell something without losing money." This means exit preparation must demonstrate genuine operational value creation, not merely multiple persistence.
| What the Buyer Wants | Secondary Buyout (Sponsor) | Strategic Exit |
|---|---|---|
| Revenue story | Recurring revenue growth; NRR; contractual visibility | Revenue synergy logic; wallet share headroom; geographic fill |
| Integration maturity | Repeatable M&A machine (documented playbook + pipeline); demonstrated synergy capture | Clean integration into existing platform; minimal duplication costs |
| Tech differentiation | Portal/workflow/data assets that de-risk the hold and underpin the next phase | Proprietary capabilities that are additive to buyer's tech stack |
| Management depth | Deep bench that can execute independently through transition | Functional redundancy is acceptable; key technical/commercial talent must transfer |
| Data and defensibility | Proprietary data assets; demonstrable switching costs | Customer relationships; competitive positioning; defensibility evidence |
| Financials | Clean, auditable, normalized EBITDA; clear bridge; bolt-on pipeline economics | Synergy-adjusted P&L; integration cost transparency |
"2026, for us, is the year where distributed to paid-in capital (DPI) will have to increase," emphasising that patience with elongated holding periods has run out. This DPI pressure creates an exit-heavy environment, but it also raises the bar: successful exits in this environment require earlier and more rigorous preparation, with value creation plans that are detailed, data-driven and aligned with market realities.
7.5.2 The Exit Readiness Scorecard
This scorecard—aligned to the six valuation drivers defined in Chapter 2 (Section 2.5)—should be completed at least 12 months before a target exit date.
| Driver | Score (1–5) | Evidence Required | IC-Ready Signal |
|---|---|---|---|
| Recurrence & visibility | Contracted revenue %; NRR/GRR; backlog coverage; cohort retention | >70% recurring; NRR >100%; <8% gross churn | |
| Integration maturity | Unified KPI pack; synergy tracking; documented bolt-on playbook; shared-services operating model | Common reporting within 90 days of each bolt-on; measurable synergy bridge | |
| Tech leverage | Portal adoption; automation coverage; product roadmap; R&D spend as % of revenue | Client-facing tech with >50% adoption; demonstrable productivity impact | |
| Data defensibility | Proprietary datasets; data-in-workflow; switching cost evidence; governance/security posture | Data assets used in delivery; migration cost for client >6 months of fees | |
| Management depth | Org chart depth; key-person analysis; succession plan; management equity alignment | No single individual controls >15% of revenue; bench 2-deep on every critical function | |
| Financial quality | Audit trail; adjusted EBITDA bridge; working capital normalisation; cash conversion | >80% EBITDA-to-cash conversion; clean QoE; transparent add-backs |
Scoring interpretation:
- 25–30 total: Exit-ready. Process can launch with confidence.
- 18–24: Requires 6–12 months of targeted preparation.
- <18: Premature exit. Risk of value destruction from process failure or price disappointment.
7.5.3 Narrative Construction: The Five Building Blocks
Regardless of the exit path, the most effective TEBS exit stories in 2026+ are built on five pillars:
-
"We built a platform, not a collection." Prove integration maturity with common KPIs, shared services, demonstrated synergy capture, and repeatable onboarding cadence.
-
"Recurring revenue is structural, not cosmetic." Show cohort-level retention, contract duration distribution, and NRR trends—not just a headline "% recurring" figure.
-
"Technology changes the unit economics." Demonstrate that tech investments moved gross margin, cost-to-serve, or client switching costs—not just that tools were purchased.
-
"The bolt-on pipeline is deep and actionable." Present a mapped, scored pipeline (not a wish list) with signed NDAs or LOIs where possible.
-
"Management can run and grow this without us." De-risk the transition story with management depth, aligned incentives, and clear governance structures.
7.6 Sample Platform Memo Outline (IC Deck Appendix)
The following outline is suitable for inclusion in an IC paper appendix or as a standalone one-page per thesis.
PLATFORM INVESTMENT THESIS — [Sub-Sector / Platform Name]
- THESIS SUMMARY (one paragraph)
- Target customer; wedge service; why now; target MOIC/IRR range
- MARKET CONTEXT
- Sub-sector TAM (TEBS-eligible); growth; fragmentation (Ch2/Ch3–5 reference)
- Consolidation dynamics; buyer universe
- TARGET PROFILE
- Revenue / EBITDA / margin / recurring %
- Key strengths and risks (3 of each)
- Continuum positioning (Ch2 framework)
- VALUE CREATION PLAN (0–12 / 12–36 months)
- Margin levers with quantified targets
- Tech investments and expected impact
- Bolt-on program (sequencing, target count, integration approach)
- BOLT-ON PIPELINE
- Target list (anonymised if necessary) with scores
- Expected entry multiples and arbitrage
- EXIT NARRATIVE
- Target positioning at exit
- Expected buyer universe (sponsor / strategic)
- Exit readiness scorecard (pre-populated)
- KEY RISKS AND MITIGATIONS
- Labour; integration; technology; concentration; macro
- FINANCIAL SUMMARY
- Entry EV/EBITDA; invested equity; leverage
- Base / upside / downside exit returns
- MOIC and IRR sensitivity table
7.7 Implications for Deal Execution in 2026
Three execution dynamics shape how these templates and frameworks are applied in live deals:
1. Auction congestion is real in premium sub-sectors. Market congestion is becoming an M&A process consideration for certain sub-sectors. In insurance broking, MSP, and compliance, sponsors should expect competitive processes with 5–10+ qualified bidders for quality assets. Winning requires: (i) sector-specific credibility, (ii) a credible 100-day plan presented during diligence, and (iii) speed and certainty of close.
2. Proprietary sourcing is the alpha generator. On average, PE professionals expect to acquire 73% of their platform companies within their own country. 35% of planned add-on acquisitions are expected to take place in foreign countries. Building a systematic origination engine—combining broker relationships, direct outreach, and platform databases—is the primary competitive advantage in the mid-market.
3. DPI pressure accelerates both entry and exit timelines. "2026, for us, is the year where distributed to paid-in capital (DPI) will have to increase," with patience for elongated holding periods running out. This creates both opportunity (more supply from GP-driven exits) and constraint (shorter time to demonstrate value creation). Sponsors entering platforms in 2026 should plan for bolt-on execution to begin within the first 90 days post-close.
Chapter 8: Diligence & Value-Creation Toolkit + 2026–2028 Outlook (Synthesis and Recommendations)
This chapter is the capstone of the report. It translates the sub-sector intelligence, cross-sector patterns, and buyer landscape assembled in Chapters 1–7 into four practical deliverables designed for direct use in live deal workstreams: (i) a TEBS diligence checklist, (ii) an integration playbook with risk heatmap, (iii) an AI impact matrix covering all 15 sub-sectors, and (iv) a forward-looking outlook with explicit portfolio-construction recommendations. Every table, framework, and recommendation links back to the specific evidence, rubric scores, and module-level findings established in the preceding seven chapters.
The macro environment reinforces the urgency. Three quarters of respondents in Roland Berger's annual expert survey said they believed there will be more M&A activity involving PE in 2026 than in 2025. In 2026 alone, more than 1,500 European private-equity-backed assets, representing roughly $760 billion in enterprise value, could come to market. For acquisitions, sentiment is even more optimistic: 57% of respondents expect higher activity in 2026. Against this backdrop, the quality of diligence and integration execution—not just sourcing speed—will determine returns.
8.1 TEBS Diligence Checklist
This checklist is designed for deal teams to use from indicative offer through confirmatory diligence. It covers the six domains identified in Chapter 1 (Section 1.5) as determinative of TEBS value creation: revenue quality, concentration, key-person risk, scalability, tech stack maturity, and data ownership. For each domain, the table specifies what to request, what management commonly says that is misleading, and the diligence test that reveals the truth.
Artificial intelligence has surfaced as a major consideration in due diligence as both PE and corporate M&A buyers invest more time to uncover the technology's potential impact on targets. Most acquirers report that an AI diligence has convinced them to walk away from a deal. This checklist incorporates AI-readiness as a sub-dimension of tech stack maturity, consistent with Chapter 7's "Avoiding AI Theater" framework.
| # | Domain | Key Question | Evidence to Request | Common Misleading Management Answer | Diligence Test / Red Flag |
|---|---|---|---|---|---|
| 1 | Revenue Quality: Recurrence | What share of revenue is contractually committed >12 months? | Aged contract schedule; renewal dates; auto-renewal terms; revenue by billing type | "80% of our revenue is recurring" (often includes month-to-month or at-will contracts) | Reconcile "recurring" to signed contracts with >12-month commitments; calculate true contracted backlog; cross-check with client interviews |
| 2 | Revenue Quality: Retention | What is gross and net revenue retention (GRR/NRR)? | Cohort-level retention data by vintage and client size; churn log with reasons | "We have very low churn" (without quantifying; hides downsells and price erosion) | Build a cohort waterfall; request churn/downsell/expansion by quarter; verify against invoicing data |
| 3 | Revenue Quality: Margin Mix | Where does gross margin come from? | Gross margin by service line, client segment, and delivery model (in-house vs subcontractor) | "Overall GM is 35%—healthy for our sector" (masks a mix of 50% high-value and 15% commodity lines) | Decompose GM by SKU/service line; flag any line below 20% that is >15% of revenue |
| 4 | Concentration | How exposed is the business to individual clients, sectors, or geographies? | Revenue by client (top 20); sector split; geography split; pipeline by segment | "No single client is >10% of revenue" (but top 3 clients may be >35% combined) | Map revenue concentration + gross profit concentration (sometimes different); stress-test loss of top 3 |
| 5 | Key-Person Risk | What would happen if the founder or top 3 revenue-holders left? | Org chart with revenue attribution; client relationship matrix; handover documentation; incentive structures | "The team is strong—I'm not that important" (but all major clients call the founder's mobile) | Interview key clients without management present; count multi-threaded relationships vs single-point; check earn-out/equity/non-compete coverage |
| 6 | Scalability: Delivery Model | Can the business grow revenue without proportional headcount growth? | Revenue per FTE trend (3 years); automation rate; span of control; utilization data; workflow documentation | "We are very efficient" (but revenue/FTE has been flat or declining) | Plot revenue/FTE and EBITDA/FTE quarterly for 3+ years; verify automation claims against actual workflow steps |
| 7 | Scalability: Process Standardization | Are delivery processes documented, repeatable, and measurable? | SOPs; quality framework; KPI dashboards; training materials; onboarding time for new hires | "Everything is documented" (but in one person's head or outdated folders) | Ask to walk through a live engagement from intake to delivery using the documented SOPs; verify in random sample |
| 8 | Tech Stack Maturity | Does the tech stack create delivery leverage and switching costs, or is it window dressing? | System architecture; PSA/CRM/ERP usage data; client-facing portal analytics; R&D roadmap and spend | "We have a proprietary platform" (actually a lightly customized CRM with low adoption) | Check daily active users in core systems; measure % of delivery flowing through the platform; compare pre/post productivity metrics |
| 9 | Tech Stack: AI Readiness | Is AI generating measurable value, or is it "AI theater"? | AI model inventory; before/after KPIs; adoption metrics; governance policies; client-approved usage | "We're AI-first" (no adoption data; no before/after; pilot-only) | Apply the 7-point AI Theater checklist from Chapter 7 (Section 7.3.3); require at least one before/after KPI dashboard |
| 10 | Data Ownership & Usability | Who owns the data, and can it be monetized or used to build defensibility? | Data governance documentation; client contract data clauses; data architecture; examples of data-in-delivery | "We sit on a goldmine of data" (client-owned; never operationalized; fragmented across systems) | Verify legal ownership; assess data quality (completeness, structure, freshness); test whether data is actually used in delivery or pricing decisions |
How to use this checklist: Assign each domain a RAG (Red-Amber-Green) rating after evidence review. If any domain is rated Red and cannot be credibly mitigated within the first 12 months post-close, re-evaluate the thesis. If two or more domains are Amber, underwrite a lower entry multiple and model the cost/time to remediate.
8.2 Integration Playbook for Buy-and-Build
8.2.1 The 100-Day Priorities
Pre-close, the focus of diligence needs to be on identifying the people, process and technology changes that must be made in the first 100 days. A rapid diagnostic analysis can help the PE buyer assess the finance function's maturity. Almost 90% of PE firms formulate 100-day plans when they acquire a business. It's a critical timespan that sets the tone for the entire holding period.
The following sequencing draws on patterns validated across all 15 modules and the centralise-vs-federate framework from Chapter 6 (Section 6.5).
INTEGRATION 100-DAY PLAN — TEBS BUY-AND-BUILD
PHASE 1: STABILISE (Day 0–30) PEOPLE ├── Announce leadership structure; every employee knows their reporting line by Day 14 ├── Sign retention packages for top 5–10 critical revenue/delivery personnel ├── Launch communication cadence (weekly all-hands; bi-weekly manager kit) └── Assign integration leads per workstream (finance, ops, tech, commercial, HR)
PROCESS ├── Implement unified financial reporting + KPI pack (Week 1–2) ├── Establish cash management governance (13-week cash-flow; credit control) ├── Map current-state systems, processes, and vendor contracts └── Define "Day 1 must-do" compliance/regulatory items (licensing, data, insurance)
SYSTEMS ├── Audit tech stack: identify critical gaps, data extract requirements, security baselines ├── Deploy reporting extract layer (bridge existing systems to central dashboard) └── Do NOT force big-bang system migrations in Phase 1
COMMERCIAL ├── Multi-thread top 10 client relationships (if not already) ├── Announce "business as usual" to clients; assign client-transition owners └── Begin pricing audit (identify out-of-market contracts for Phase 2 repricing)
PHASE 2: STANDARDISE (Day 30–100) PEOPLE ├── Complete role mapping for shared-services functions (finance, HR, IT) ├── Launch career framework and development pathways └── Conduct first "pulse survey" on integration sentiment
PROCESS ├── Implement standardised delivery SOPs (service catalog, quality, SLAs) ├── Centralise procurement (materials, software, subcontractors) ├── Execute first wave of contract repricing where feasible └── Establish bolt-on sourcing rhythm (pipeline review cadence)
SYSTEMS ├── Begin phased migration to target PSA/CRM/ERP (easiest entities first) ├── Launch client-facing reporting/portal where applicable └── Deploy initial automation use cases (RPA, workflow scripting)
COMMERCIAL ├── Identify and execute first cross-sell opportunities ├── Launch commercial playbook: pricing guardrails, escalation rules, win-rate tracking └── Present first "platform story" to key accounts
8.2.2 Cultural and Talent Retention Risks
Across all 15 modules, the most consistent integration failure mode is talent attrition driven by poor communication, cultural mismatch, or perceived loss of autonomy. This is especially acute in:
- Healthcare (clinician departure = immediate revenue loss; see Chapter 3, Module 3.5)
- Insurance brokerage (producer departure erodes the book; Chapter 5, Module 3.15)
- Marketing/digital agencies (creative talent is culture-sensitive; Chapter 4, Module 3.9)
- Engineering consulting (senior engineers leave for competitors rapidly; Chapter 4, Module 3.7)
Incentive design principles (what works in TEBS roll-ups):
- Equity/phantom equity for top 10–20 revenue-critical individuals; vest over 3–4 years with acceleration at exit.
- Earn-outs tied to retention and revenue/margin milestones, not solely to revenue—prevents "sand-bagging."
- Cultural autonomy in Phase 1: Federate client relationships and local brand identity initially; centralise governance and tooling. The Chapter 6 framework ("centralise the operating system, federate the relationships") applies universally.
- Communication rhythm: Weekly updates from platform leadership; monthly town halls; quarterly integration progress reviews with specific "you said, we did" feedback loops.
8.2.3 Integration Risk Heatmap
This heatmap scores integration risks by severity (1 = low, 5 = critical) across eight risk types, calibrated from module-level evidence in Chapters 3–5. Mitigations reference specific playbook elements.
| Risk Type | Severity (1–5) | Most Exposed Sub-Sectors | Early Warning Indicators | Primary Mitigation |
|---|---|---|---|---|
| Key-person/talent flight | 5 | Healthcare (3.5), Insurance (3.15), Engineering (3.7), Agencies (3.9) | >15% attrition in first 6 months; client complaints about "new contacts" | Retention packages pre-close; multi-threading; career frameworks; equity alignment |
| Client churn post-acquisition | 4 | Staffing (3.3), Agencies (3.9), Healthcare (3.5) | Client cancellation notices; declining NRR; loss of top-5 client | "Business as usual" communications Day 1; client-transition owners; preserve service quality |
| Systems migration disruption | 4 | MSP (3.1), Fund Admin (3.6), TIC (3.2) | Delayed reporting; billing errors; SLA breaches during migration | Phased migration; extract-layer-first; never migrate during peak client activity |
| Cultural clash / integration fatigue | 4 | Agencies (3.9), Engineering (3.7), Environmental (3.11) | Pulse survey scores declining; rising voluntary attrition; passive resistance to SOPs | Federate initially; transparent communication; integration pace governance |
| Revenue quality overestimate | 3 | Staffing (3.3), Agencies (3.9), Education (3.10) | Post-close revenue underperforms model within 6 months; churn higher than CIM stated | Diligence checklist items 1–3 above; independent client interviews; build own retention data |
| Pricing/margin compression | 3 | FM (3.8), Staffing (3.3), Legal/LPO (3.12) | Contract renewals at lower rates; unforeseen pass-through cost absorption | Pricing audit in Phase 1; contract clause review; inflation escalation enforcement |
| Regulatory/licensing continuity | 3 | Healthcare (3.5), TIC (3.2), Fund Admin (3.6), Insurance (3.15) | Licensing review delays; accreditation findings post-close | Pre-close regulatory diligence; Day 1 compliance governance; dedicated licensing coordinator |
| Subcontractor/vendor dependency | 2 | FM (3.8), Logistics (3.14), MSP (3.1) | Margin leakage via uncontrolled subcontractor spend; quality deterioration | Procurement centralisation; vendor review and rationalisation in Phase 2 |
8.3 AI Impact Assessment
8.3.1 Framework
Private equity investors and M&A dealmakers now evaluate artificial intelligence's potential impact as a critical step in a full potential diligence. The three categories of AI's impact are revolution, transformation, and augmentation. AI's potential to disrupt or create opportunities can vary significantly based on where the target plays within an industry.
This report applies a TEBS-specific framework drawing on Bain's three-tier AI impact model and grounding it in the module-level evidence from Chapters 3–5. Each sub-sector is classified along two dimensions:
- AI value-capture potential: The degree to which AI can improve internal productivity, expand service capacity, or create new client-facing revenue streams (Low / Medium / High / Very High).
- AI disruption risk: The degree to which AI can structurally reduce demand for the service, compress pricing, or enable clients to disintermediate the provider (Low / Medium / High).
The net classification—Structurally Helped, Neutral, or Structurally Threatened—combines these two dimensions and informs holding-period planning and exit-narrative construction.
Individuals who work in customer support, software development or consulting have seen average productivity gains ranging from 5% to over 25%. Leading firms are reclaiming 15-20 hours weekly from administrative tasks, enhancing deliverable quality by 20-30%, and increasing their effective capacity without expanding headcount. However, among the more than 300 companies Bain analyzed for a formal study, less than 10% fall into the "revolution" category—most TEBS sub-sectors sit in the "augmentation" or "transformation" zones.
8.3.2 AI Impact Matrix — All 15 Sub-Sectors
| Sub-Sector | AI Value-Capture | AI Disruption Risk | Net Classification | Primary Mechanism | Required Mitigations | Holding Period / Exit Implications |
|---|---|---|---|---|---|---|
| 3.1 IT Managed Services | High | Low–Medium | Structurally Helped | AI-assisted triage/remediation boosts engineer leverage; AI ops becomes a new service line | Invest in AI tooling; retrain L1/L2; shift to outcome-based pricing | AI story strengthens exit narrative; 3–5 year hold optimal |
| 3.2 TIC | Medium | Low | Structurally Helped | AI-assisted defect recognition, report drafting; does not replace accredited judgment | Maintain accreditation discipline; pilot AI selectively | Stable demand; AI improves throughput but does not change structural position |
| 3.3 Staffing | Medium | Medium–High | Neutral (with risks) | AI improves sourcing speed; but internal talent platforms may disintermediate | Shift to RPO/MSP/embedded; build analytics; avoid commodity perm | Accelerate exit if commodity-heavy; longer hold if embedded |
| 3.4 Compliance | High | Low–Medium | Structurally Helped | AI-driven reg-change scanning, drafting, monitoring; new subscription services | Shift pricing from hours to subscriptions/outcomes; invest in tooling | AI accelerates productisation; exit narrative strengthens with usage metrics |
| 3.5 Healthcare | Medium | Low | Structurally Helped | AI-assisted diagnostics, triage, scheduling; does not replace clinician | Selective AI investment (imaging, booking); focus on clinical governance | Limited disruption; AI is efficiency enhancer, not model disruptor |
| 3.6 Fund Admin | High | Low | Structurally Helped | AI/RPA automates reconciliation, reporting, data extraction; portal improves NRR | Invest in automation; maintain controls; nearshore + AI combination | Strong exit story as "tech-powered admin"; 3–4 year hold ideal |
| 3.7 Engineering | Medium | Low | Neutral (positive tilt) | AI accelerates design iteration, code compliance; does not replace engineering judgment | Adopt BIM/AI tools; invest in training; use AI to reduce junior workload | AI is a productivity tool, not a disruptor; exit narrative benefit modest |
| 3.8 Facilities Mgmt | Low–Medium | Low | Neutral | Predictive maintenance and scheduling benefit from IoT/AI; delivery remains labour-bound | Focus on CAFM/scheduling; limited AI ROI beyond specific use cases | AI does not change the FM investment thesis materially |
| 3.9 Marketing/Agencies | High | High | Structurally Threatened (unless model shifts) | AI accelerates content production but also lowers barriers; commoditises basic services | Shift to strategic/analytics-led services; productise; use AI to improve—not just produce | Short hold if commodity; longer hold if successfully repositioned as analytics/outcomes platform |
| 3.10 Education | High | Medium | Structurally Helped (with content risk) | AI personalises learning, generates content, reduces production costs | Defend with curation, assessment authority, and LMS embedding; do not rely on content production alone | AI accelerates content economics; exit narrative improves with digital delivery share |
| 3.11 Environmental | Medium | Low–Medium | Neutral (positive tilt) | AI assists reporting, consistency, scenario modelling; does not replace fieldwork or sign-off | Standardise evidence-trail workflows; pilot AI drafting with QA | Modest AI narrative contribution; value driven by compliance pull |
| 3.12 Legal/LPO | Very High | High | Transformation zone | AI can automate review, abstraction, drafting—but also commoditises these services | Shift to managed services; embed in client workflows; secure AI governance; reprice to outcomes | Highest "bifurcation risk" in TEBS: AI winners gain; laggards lose pricing power rapidly |
| 3.13 Data & Analytics | Very High | Medium | Structurally Helped | AI expands addressable market; reusable IP + AI accelerators increase leverage | Govern IP; standardise delivery; invest in AI/ML capability; defend against body-shopping | AI-led platform story is the strongest exit narrative in TEBS |
| 3.14 Logistics | High | Low–Medium | Structurally Helped | AI improves exception management, carrier allocation, demand forecasting | Build control-tower capability; invest in data quality; leverage AI for visibility | AI enhances unit economics and retention; exit narrative improves |
| 3.15 Insurance Brokerage | High | Low | Structurally Helped | AI improves renewal automation, cross-sell analytics, risk triage; does not replace broker relationships | Invest in BMS/analytics; use AI to improve producer productivity, not replace producers | AI enhances retention and revenue per client; exit narrative remains strong |
8.3.3 Key Takeaways for IC Teams
1. Only 2 of 15 sub-sectors face genuine structural AI threat: Marketing/digital agencies and Legal/LPO, where the core deliverable (content production, document review) is directly automatable. Even in these sub-sectors, the threat is mitigatable if the business model shifts toward managed services, outcomes, and strategic advisory.
2. The majority of TEBS is in the "augmentation" zone: AI improves productivity, expands capacity, and enhances the exit narrative, but does not fundamentally change the demand driver (compliance obligations, risk intermediation, clinical delivery, infrastructure maintenance, etc.).
3. The "AI distributor" opportunity is the most investable AI theme in TEBS (Chapter 6, Section 6.8): Platforms that can implement, govern, and operate AI for mid-market clients—especially in MSP, compliance, data & analytics, and fund administration—create a new recurring revenue layer.
8.4 Outlook: 2026–2028
8.4.1 Where Consolidation Accelerates Next
Building on Chapter 6's white-space analysis and the 2026 macro backdrop, consolidation is expected to accelerate most in the following areas:
| Theme | "Why Now" Catalyst | Priority Sub-Sectors | Target Regions |
|---|---|---|---|
| Cyber-MSP for SME/Mittelstand | Rising threat landscape; NIS2 and client awareness; SME outsourcing acceleration | MSP (3.1), Compliance (3.4) | DACH, Nordics, UK |
| ESG/CSRD reporting factory | Reporting mandates expanding; "year 2" recurring need; assurance-adjacent demand | Environmental (3.11), Compliance (3.4), Education (3.10) | Pan-European; anchor in DACH or Nordics |
| Continental broker consolidation | Deep fragmentation below top-tier; PE playbook proven in UK/US; succession supply | Insurance (3.15) | DACH, Benelux, Italy, Iberia |
| Alternatives operations platform | Growing LP pressure for outsourced admin; increasing fund complexity and ESG reporting | Fund Admin (3.6), Compliance (3.4), Data (3.13) | Luxembourg, Ireland, Nordics, Benelux |
| AI services + data engineering | Enterprise AI adoption accelerating; mid-market needs implementation + governance | Data & Analytics (3.13), MSP (3.1) | UK, Nordics, CEE (nearshore) |
| Compliance-as-a-Service (FinServ) | Regulatory intensity continuing to ratchet; budgets shifting from project to outsourced | Compliance (3.4), Legal/LPO (3.12) | UK, Benelux, DACH |
| Southern European clinical groups | Lower entry multiples; fragmentation; professionalisation gap; demographic demand | Healthcare (3.5) | Italy, Spain, Portugal |
8.4.2 Labor Market and Cost Scenarios
Labour is the largest cost line in most TEBS businesses and the binding constraint on growth in many. ECA projects median real salary growth of 1.4% across 25 countries in 2025 and 1.7% in 2026. Eurosystem staff projections indicate a yearly growth rate of compensation per employee in the euro area of 4.0% in 2025 and 3.2% in 2026. Germany's statutory minimum wage increase is +8.5% in 2026 and +5% in 2027.
Implications for TEBS sponsors:
-
Wage normalisation, not deflation. Real wage growth of ~1.5–2% is positive for employee purchasing power but means nominal wage pressure continues, particularly in scarce-skill roles (cyber engineers, data specialists, clinicians, qualified inspectors). Sponsors must underwrite cost inflation explicitly in base cases.
-
Eastern Europe outperforms on wage growth but offers nearshore arbitrage. "Eastern European economies are generally forecast to outperform their Western European peers once again, benefitting from faster economic growth and higher productivity." For platforms using CEE delivery centres (fund admin, data, legal/LPO), this means rising costs that narrow the arbitrage—but still meaningfully below Western European levels.
-
Delivery model shifts matter more than wage forecasts. The most impactful labour mitigation levers remain (i) automation that reduces labour-per-unit of revenue, (ii) utilisation improvement through better scheduling and bench management, (iii) managed nearshore centres with quality governance, and (iv) productisation that shifts pricing from "hours" to "outcomes." These are the levers validated in every module in Chapters 3–5.
8.4.3 The Emerging AI Services Layer
As introduced in Chapter 6 (Section 6.8), the most investable AI opportunity in TEBS is not "building AI models" but building the services layer that makes AI usable, safe, compliant, and operational for mid-market enterprises.
Two distinct roles for TEBS platforms:
Role 1 — AI as an internal productivity engine: Reduces cost-to-serve, increases throughput, and improves quality. This shows up as EBITDA margin expansion when workflows are standardised. Evidence across modules suggests +100–500 bps within 6–24 months is realistic for report-heavy, data-processing, and workflow-automatable services (fund admin, compliance, legal/LPO, MSP, data & analytics).
Role 2 — AI as a distributed product: TEBS firms become the channel through which mid-market clients access, implement, govern, and operate AI. This creates new recurring revenue streams: AI readiness assessments, AI governance services, managed AI operations, and AI-enabled workflow outsourcing. The strongest natural owners are MSPs (IT + security + AI ops), compliance firms (AI governance + risk mapping), and data & analytics platforms (implementation + managed AI).
Multiple implication: Platforms that can credibly demonstrate both Role 1 (internal leverage) and Role 2 (client-facing AI services) will command premium multiples at exit—because they offer buyers both margin resilience and a growth story. This is the "near-software" zone on the services-to-software continuum (Chapter 2, Section 2.3).
8.5 Final Synthesis and Recommendations
8.5.1 Portfolio Construction Recommendations
Drawing together the consolidated ranking (Chapter 6, Table 6.1.2), the AI impact matrix (Section 8.3), and the outlook (Section 8.4), the following capital allocation guidance applies:
Priority origination (Archetype 1 — Base ≥ 3.8):
- Insurance Brokerage (4.3): Deepest bolt-on pipeline, renewal-led recurrence, proven integration playbook, lowest AI disruption risk. Priority for sponsors seeking the most predictable buy-and-build returns.
- IT Managed Services (4.3): Highest tech leverage in the TEBS universe; security attach path drives NRR; AI operations creates a new growth layer. Requires engineer scarcity management.
- Compliance/Regulatory Advisory (4.0): Regulation-as-demand-driver creates "ratchet" organic growth; productisation into subscriptions is the multiple expansion engine.
- Fund Administration (3.9): Strong workflow embedding and switching costs; nearshore + AI combination drives margin; LP outsourcing trend is secular.
- Data & Analytics (3.8): Highest tech ceiling and AI upside; but execution-dependent (IP reuse, managed-run conversion, talent retention). Widest outcome dispersion—use the scenario framework from Chapter 5.
Opportunistic platforms (Archetype 2 — Base 3.5–3.7):
- TIC (3.7): Real moat, but slower platform velocity; best when niche-deep, not breadth-first.
- Healthcare (3.6): Fragmented, resilient demand, but integration is clinical governance + clinician retention, not systems.
- Education/Training (3.5): "Sleeper" when anchored in compliance training + content-as-IP; digital delivery creates non-linear scaling.
Selective / operational-alpha (Archetype 3 — Base 3.1–3.4):
- Environmental/Sustainability (3.4), Logistics (3.3), Staffing (3.2), Engineering (3.1), FM (3.1): All viable, but returns depend on operational execution (density, procurement, utilisation), not tech-driven multiple expansion. Underwrite conservatively; treat tech improvement as upside.
Thesis-dependent / avoid unless differentiated (Archetype 4 — Base < 3.1):
- Legal/LPO (3.1): Highest AI bifurcation risk; invest only with a clear managed-services + workflow embedding thesis.
- Marketing/Digital Agencies (2.9): Historically high failure rate; invest only with ruthless focus on retainer conversion, analytics differentiation, and integration discipline.
8.5.2 Winning Playbook Recommendations
Sourcing angles that create alpha:
- Build proprietary origination engines. European GPs must differentiate through sector expertise, superior sourcing, and operational improvement capabilities. In TEBS, this means sector-focused outreach programs, founder succession databases, and relationships with specialist intermediaries.
- Target succession-driven supply. The demographic wave creating founder-exit supply (particularly in DACH, Southern Europe, and UK) is time-limited. Origination teams should screen for owner age >55, no internal successor, and revenue €3–15M—the classic bolt-on profile.
- Use the Target Signal Checklist (Chapter 1, Section 1.6.3) as a screening automation tool. Many of the signals (recurring revenue %, tech maturity, client concentration) can be pre-screened from broker materials in under 30 minutes.
Diligence priorities that prevent value destruction:
- Revenue quality (checklist items 1–3) comes first. Reject assets where "recurring" cannot be reconciled to signed contracts.
- Key-person risk (item 5) comes second. If a single individual controls >30% of revenue and relationships, walk away or price as a talent acquisition, not a platform.
- Tech stack maturity (items 8–9) comes third—not first. Tech is important, but it is a value-creation lever, not a screening gate. A strong services business with weak tech is fixable; a weak services business with strong tech is not.
Integration stance that reliably compounds:
- "Start with the data and reporting layers, and perhaps introduce simple automation and efficiencies within the organization that will easily translate to other companies that get added to the platform." The "extract layer first, migrate later" approach works across MSP, fund admin, TIC, insurance, and most other TEBS sub-sectors.
- Centralise governance (finance, compliance, KPIs, procurement) on Day 1; federate client relationships and local operations for the first 6–12 months (Chapter 6, Section 6.5).
- Build the "M&A muscle" into the platform from Day 1: dedicated integration PMO, standardised bolt-on onboarding playbook, and pipeline review cadence. The key to winning deals and securing investment committee approval will be a pre-vetted, actionable value creation plan.
Value-creation initiatives that reliably move EBITDA: Based on the cross-module evidence (summarised in Chapter 6's value-creation lever heatmap, Section 6.3):
| Initiative | EBITDA Impact (typical) | Timeline | Where It Works Best |
|---|---|---|---|
| Procurement centralisation | +200–500 bps | 6–18 months | Healthcare, FM, TIC, MSP |
| PSA/ERP standardisation | +100–300 bps | 6–12 months | MSP, Engineering, Compliance, Data |
| Pricing governance & repricing | +100–200 bps | 6–12 months | Insurance, Compliance, MSP |
| Retainer/subscription conversion | +200–400 bps | 12–24 months | Compliance, Education, Environmental, Legal |
| Workflow automation (RPA/AI) | +150–350 bps | 12–24 months | Fund Admin, Legal/LPO, MSP |
| Client portal deployment | NRR uplift (retention) | 6–18 months | Fund Admin, Compliance, Insurance, TIC |
| Nearshore delivery build | +200–500 bps | 12–24 months | Fund Admin, Legal/LPO, Data, MSP |
8.5.3 Self-Critique: "Would This Help Win Deals or Build Platforms?"
This section identifies where the report's evidence is weakest, what to validate before acting, and how conclusions could change under alternative scenarios.
Where evidence is weakest:
-
Exact EBITDA impact ranges for tech investments are directional, not statistically proven. The "+150–300 bps from PSA standardisation" ranges are derived from operator interviews, case studies, and cross-module triangulation—not randomised controlled trials. Validate against actual pre/post KPI data in each target.
-
AI impact timelines are inherently uncertain. The matrix classifies sub-sectors today, but AI capability is evolving rapidly. The long-term potential of AI is great, but the short-term returns are unclear. While nearly all companies are investing in AI, only 1% of leaders call their companies "mature" on the deployment spectrum. The classifications should be stress-tested against AI advancement scenarios at least annually.
-
Cross-border expansion playbooks (Chapter 7, Section 7.4) are pattern-based, not empirically benchmarked. Cultural and commercial fit varies significantly by sub-sector and by specific market entry approach. Validate with local operating partners and expert interviews before committing capital.
-
Sub-sector TAM figures are TEBS-eligible ranges, not auditable numbers. As stated in Chapter 2, the TEBS-eligible TAM construct is an analytical tool, not a precise measurement. Use it for relative comparison between sub-sectors, not for investment-grade market sizing in specific geographies.
What to validate via expert calls before committing to a thesis:
| Thesis | Expert call focus | Key question to resolve |
|---|---|---|
| Cyber-MSP DACH platform | DACH MSP operators; CISOs at Mittelstand clients | Is the German SME buyer ready for "managed security" pricing, or is it still price-sensitive break-fix? |
| ESG reporting platform | CSRD readiness advisors; Big Four assurance partners | Does "year 2" recurring demand materialise, or do clients in-house after initial reporting? |
| Continental insurance broker roll-up | Local brokers in target geographies; carrier relationship heads | How portable is the UK/US integration playbook to DACH/Benelux broker culture? |
| AI services + data engineering | CIOs at mid-market enterprises; hyperscaler partner teams | Is mid-market AI implementation demand real (budget-backed) or aspirational? |
How conclusions could change under alternative scenarios:
| Scenario | Impact on report conclusions |
|---|---|
| Severe macro recession (2026–2027) | Cyclical sub-sectors (staffing, engineering, marketing) hit hardest; recession-resistant sub-sectors (insurance, compliance, healthcare) gain relative attractiveness; entry multiples compress, creating opportunity for well-funded sponsors |
| AI adoption accelerates 2× faster than expected | Legal/LPO and marketing disruption risk increases; data & analytics upside expands; fund admin and compliance benefit accelerates; overall TEBS multiples may bifurcate more sharply between AI adopters and laggards |
| AI adoption stalls or disappoints | AI-dependent upside cases (data & analytics, MSP AI ops) revert to base; labour-intensive sub-sectors see continued margin pressure; the report's core framework (fragmentation × tech leverage × integration) remains valid, but the "AI premium" at exit diminishes |
| Geopolitical disruption to European trade | Logistics and supply chain sub-sector volatility increases; nearshore labour strategies in CEE may face disruption; cross-border expansion timelines extend; domestic-only platforms gain relative attractiveness |
8.6 Closing Recommendations for Each Audience
For PE Partners and IC Members: Use the consolidated ranking (Chapter 6) and AI impact matrix (Section 8.3) to calibrate sector allocation. Prioritise Archetype 1 sub-sectors for new platform theses. Apply the Exit Readiness Scorecard (Chapter 7, Section 7.5.2) 12 months pre-exit. The diligence checklist in this chapter is designed for direct inclusion in IC processes.
For Investment Managers: Use the Target Signal Checklist (Chapter 1) and the diligence checklist above to accelerate screening. Reference the six platform thesis templates in Chapter 7 to structure IC papers. Use the 100-day integration plan in this chapter as the integration appendix in every new deal submission.
For Operating Partners: The integration playbook and risk heatmap are designed for direct adaptation to each portfolio company. The value-creation lever table (Section 8.5.2) provides the priority list. The AI Theater checklist (Chapter 7) should be applied to every portfolio company's AI claims. Track AI impact metrics quarterly; use the matrix to communicate AI strategy to the IC without hype.
For M&A and Value-Creation Teams: The diligence checklist, integration heatmap, and 100-day plan are live-deal tools. Combine with the sub-sector mandatory tables from Chapters 3–5 for target-specific diligence. Use the Thesis Cards (Chapter 6, Section 6.9) as origination templates. Build the bolt-on pipeline scoring from the module-level bolt-on thesis libraries.
This report provides the analytical infrastructure and decision tools for European TEBS buy-and-build investing in 2026 and beyond. The conclusions are grounded in sub-sector economics, not sector labels; in operational evidence, not narrative conviction; and in explicit, auditable scoring, not "gut feel." The recommendations are designed to be tested, refined, and deployed in the daily rhythm of deal sourcing, diligence, integration, and exit preparation.
The final test is operational: does this framework help sponsors originate better, diligence faster, integrate more reliably, and exit at higher multiples? The evidence and tools assembled across eight chapters are designed to answer "yes"—but only when combined with the sector expertise, management judgment, and execution discipline that no report can substitute.
Appendix: Sources & References
All sources referenced across the report chapters are consolidated below.
Chapter 2
- Mordor Intelligence — Europe IT Services Market: https://www.mordorintelligence.com/industry-reports/europe-it-services-market
- ReportsnReports — Europe Managed Services Market: https://www.reportsnreports.com/ict/europe-managed-services-market-projected-to-hit-123-06-billion-by-2030/
- Market Data Forecast — Europe Managed Services Market: https://www.marketdataforecast.com/market-reports/europe-managed-services-market
- Mordor Intelligence — Europe TIC Market: https://www.mordorintelligence.com/industry-reports/europe-testing-inspection-and-certification-market
- Mordor Intelligence — Europe Insurance Brokerage Market: https://www.mordorintelligence.com/industry-reports/europe-insurance-brokerage-market
- Research and Markets — Europe management consulting: https://www.researchandmarkets.com/report/europe-management-consultancy-market
- DealSuite — European Monitor (multiples / market commentary): https://www.dealsuite.com/en/blogs/european-monitor-september-2025 and https://www.dealsuite.com/en/blogs/european-ma-monitor-2024
- CLFI — M&A EV/EBITDA multiples (PE vs corporate by sector): https://clfi.co.uk/insights/ma-ev-ebitda-multiples-2025-pe-vs-corporate/
- Bain — Buy-and-build research: https://www.bain.com/insights/buy-and-build-global-private-equity-report-2019/
- INSEAD Knowledge — buy-and-build execution: https://knowledge.insead.edu/economics-finance/how-private-equity-firms-can-ace-buy-and-build
- Gain.pro — industry and PE reports: https://www.gain.pro/investor-reports/the-state-of-european-private-equity-report and https://www.gain.pro/industry-research/managed-it-services
- SME structure proxies:
- EPP Group SME overview: https://www.eppgroup.eu/what-we-stand-for/our-priorities/helping-small-business-to-thrive
- Statista SME counts: https://www.statista.com/statistics/878412/number-of-smes-in-europe-by-size/
- IfM Bonn SME comparison: https://www.ifm-bonn.org/en/statistics/mittelstand-themes/sme-in-the-eu-comparison
- Services share of GDP (Europe): https://www.theglobaleconomy.com/rankings/share_of_services/Europe/
Chapter 3
MSP/MSO
- Mordor Intelligence — Europe Managed Services Market (definition + forecasts): https://www.mordorintelligence.com/industry-reports/europe-managed-services-market
- Reports and syndicated aggregators illustrating definitional dispersion (example aggregator): https://www.reportsnreports.com/ict/europe-managed-services-market-projected-to-hit-123-06-billion-by-2030/
- Eurostat — Job vacancy statistics by economic activity (for labor tightness context; use country/NACE cuts in diligence): https://ec.europa.eu/eurostat/statistics-explained/index.php?title=Job_vacancy_statistics
- ISC2 workforce studies (cybersecurity labor market context; validate locally): https://www.isc2.org/Research
- Gain.pro — Managed IT Services industry research (operator KPIs/integration themes; benchmark validation input): https://www.gain.pro/industry-research/managed-it-services
- 3i Group — Investment announcement in Constellation (May 2024): https://www.3i.com/news-and-insights/news/ (navigate to Constellation announcement) TIC
- Mordor Intelligence — Europe TIC market: https://www.mordorintelligence.com/industry-reports/europe-testing-inspection-and-certification-market
- MarketsandMarkets — TIC market framing (definition-dependent): https://www.marketsandmarkets.com/Market-Reports/testing-inspection-certification-market-5352498.html
- Tracxn — Eurofins Scientific acquisitions (database count depends on coverage): https://tracxn.com/
- Mergr — Eurofins acquisition history (database count depends on coverage): https://mergr.com/eurofins-scientific-acquisitions
- SGS — investor relations / reporting (market + acquisition commentary): https://www.sgs.com/en/investors
- Bureau Veritas — investor relations / reporting: https://group.bureauveritas.com/investors Staffing
- Staffing Industry Analysts (SIA) — European staffing market commentary: https://www.staffingindustry.com/
Compliance / GRC context - Market Data Forecast — Europe GRC platform market (software context, not services TAM): https://www.marketdataforecast.com/market-reports/europe-governance-risk-and-compliance-platform-market
- Grand View Research — eGRC market (software context): https://www.grandviewresearch.com/industry-analysis/enterprise-governance-risk-compliance-egrc-market
Healthcare services - Lincoln International — Dental sector commentary (margins, consolidation dynamics context): https://www.lincolninternational.com/perspectives/articles/dentals-global-sector-health-in-2025/
- Bain & Company — Retail healthcare consolidation context: https://www.bain.com/insights/retail-healthcare-continues-to-consolidate-in-europe/
- Hyde Park Capital — European pet/vet sector overview (deal activity context): https://www.hydeparkcapital.com/about/news/european-pet-vet-animal-health-sector-overview/
Chapter 4
- The future of private equity fund administration
- Top Trends in Fund Administration 2025
- Europe Engineering Services Market Size & Outlook, 2030
- Europe Engineering Consultation Market, Outlook and Forecast 2025-2032
- Sweco - Wikipedia
- Q4 and Year-end Report 2025 Sweco AB (publ)
- Engineering Consulting Services Market Size & Share, Forecast Report 2035
- Europe Facility Management Market Size & Competitors
- European Facility Management Market Size, Forecast to 2030
- Assemblin Caverion Group
- Europe Facility Management Market Size & Growth Report, 2030
- Triton announces strategic combination of Assemblin and Caverion
- European Digital Agency M&A: The Shift to End-to-End Digital Service Providers | Investec Business Advisory
- IAB Europe
- Top 31 Advertising Agencies in Europe For Stellar Results in 2025 [Reviewed in June] - inBeat Agency
- Europe Corporate Training Market Growth Analysis - Size and Forecast 2025-2029 | Technavio
- Europe Corporate Training Industry Report 2026 | Market Size 33.081 USD Million, Share, CAGR (7.569%), Forecast 2033
Chapter 5
- Mordor Intelligence — Europe Insurance Brokerage Market: https://www.mordorintelligence.com/industry-reports/europe-insurance-brokerage-market
- MarshBerry (EU) — commentary and transaction environment: https://www.marshberry.com/eu/blog/
- FTI Consulting — 2024 European Insurance M&A Barometer: https://www.fticonsulting.com/about/newsroom/press-releases/fti-consultings-2024-european-insurance-ma-barometer
- McKinsey — Insurance M&A commentary: https://www.mckinsey.com/capabilities/m-and-a/our-insights/insurance-big-deals-in-europe-and-continued-activity-in-the-americas-spark-m-and-a
- Capstone Partners — Insurance Services Market Update: https://www.capstonepartners.com/insights/article-insurance-services-market-update/
Chapter 6
- Roland Berger — European Private Equity Outlook 2026
https://www.rolandberger.com/en/Insights/Publications/European-Private-Equity-Outlook-2026.html - PitchBook — 2025 Annual European PE Breakdown
https://pitchbook.com/news/reports/2025-annual-european-pe-breakdown - PitchBook — European PE dealmaking predictions for 2026
https://pitchbook.com/news/articles/pes-cautious-optimism-on-european-dealmaking-for-2026 - MarshBerry (EU/UK) — Insurance broking M&A commentary (used for consolidation share discussion; validate by country/time period before underwriting as a hard metric)
https://www.marshberry.com/eu/blog/ - RSM Hungary — European M&A Market 2025–2026 (macro/regional context)
https://www.rsm.hu/blogs/enterprise-valuation/european-ma-market-2025-2026 - PwC — Global M&A trends in industrials and services: 2026 outlook
https://www.pwc.com/gx/en/services/deals/trends/industrials-services.html - PwC — Global M&A trends in financial services: 2026 outlook
https://www.pwc.com/gx/en/services/deals/trends/financial-services.html
Chapter 7
- European Private Equity Outlook 2026 | Roland Berger
- The State of Nordics Private Equity 2025 | Gain.pro
- European M&A Market 2025–2026
- M&A EV/EBITDA Multiples 2025: PE vs Corporate by Sector
- 12 Predictions for European Private Equity Activity in 2025 | Baird
- AI Theater vs. Readiness: 4 Questions Every Exec Must Ask | DesignRush
- New Diligence Challenge: Uncovering AI Risks and Opportunities | Bain & Company
- Everything You Need to Know Before Expanding into the Nordics - Excelerate360
- European PE's dealmaking predictions for 2026 - PitchBook
- State of Private Equity (PE) Report Europe Q1 2025 June 2025
- European Private Equity Monitor 2025
Chapter 8
- European Private Equity Outlook 2026 | Roland Berger
- European M&A Outlook 2026 — Top 10 Deal Themes For ...
- European Private Equity Monitor 2026
- New Diligence Challenge: Uncovering AI Risks and Opportunities | Bain & Company
- PE finance transformation objectives for the first 100 days | Grant Thornton
- Post Acquisition Work: The First 100 Days | A Simple Model
- Unlocking productivity with generative AI: Evidence from experimental studies
- AI in Professional Services: 2025 State of the Industry Report
- Europe 2026 salary projections: Countries with the strongest pay rises | Euronews
- New data release: ECB wage tracker suggests lower wage growth and gradual normalisation of negotiated wage pressures in 2026
- European Outlook 2026: From Risk Recognition to Action
- European PE's dealmaking predictions for 2026 - PitchBook
- AI in the workplace: A report for 2025 | McKinsey
Web Sources (extracted from text)
- European Private Equity Outlook 2026 | Roland Berger (Ch. 1, 6, 7, 8)
- M&A bullish heading into 2026 as 'buy and build' deals ... (Ch. 1)
- State of European Business Technology 2025: How AI is (Ch. 1)
- European M&A Market Trends 2025 | IMG (Ch. 1)
- EBITDA Multiples by Industry UK 2025: EV/EBITDA Valuation Trends (Ch. 1)
- European Mid-Market M&A Adapts to ‘New Normal’ in H1-2025 (Ch. 1)
- European M&A report 2025: Industry trends and growth drivers | RSM Global (Ch. 1)
- Global Private Markets Report 2026 Private equity: Clearer view, tougher terrain (Ch. 1)
- Europe IT Services Market Size & Share Outlook to 2031 (Ch. 2)
- Europe Managed Services Market Projected to Hit $123.06 billion by 2030 (Ch. 2, 3)
- Europe TIC Market - Size, Share & Industry Trends (Ch. 2, 3)
- Insurance Brokerage Market in Europe - Outlook & Trends (Ch. 2, 5)
- Europe Management Consulting Services Market Size & Trends (Ch. 2)
- Buy-and-Build + Organic PE Strategies | Gain (Ch. 2)
- Helping small business to thrive (Ch. 2)
- SMEs in the EU 2024, by size | Statista (Ch. 2)
- SME in the EU comparison - Institut für Mittelstandsforschung Bonn (Ch. 2)
- Share of services in Europe | TheGlobalEconomy.com (Ch. 2)
- Europe Managed Services Market Size, Share & Growth, 2033 (Ch. 2)
- Managed IT Services industry | Gain.pro (Ch. 2, 3)
- European Monitor September 2025 (Ch. 2)
- Buy and Build: A Key to PE Value Creation - The European Financial Review (Ch. 2)
- Buy-and-Build: A Powerful PE Strategy, but Hard to Pull Off | Bain & Company (Ch. 2)
- How Private Equity Firms Can Ace Buy-and-Build | INSEAD Knowledge (Ch. 2)
- M&A EV/EBITDA Multiples 2025: PE vs Corporate by Sector (Ch. 2, 7)
- Southern European M&A Monitor September 2025 (Ch. 2)
- European M&A Monitor September 2024 (Ch. 2)
- The State of European Private Equity Report. (Ch. 2)
- Europe Managed Services Market Size & Share Analysis (Ch. 3, 6)
- The growth of MSPs in Europe: Trends and Challenges | IR (Ch. 3)
- Why private credit lenders can’t get enough of IT MSPs (Ch. 3)
- Europe IT Services - Market Share Analysis, Industry Trends & Statistics, Growth Forecasts (2026 - 2031) (Ch. 3)
- Europe Managed Services Market Size & Share, Forecast ... (Ch. 3)
- Testing, Inspection, and Certification (TIC) Market Size, Share and Growth Analysis 2030 (Ch. 3)
- Complete Guide to Testing, Inspection & Certification (TIC) Market (Ch. 3)
- Global Staffing Market 2025: Trends & Future Outlook (Ch. 3)
- Global Staffing Industry Trends 2025 (Ch. 3)
- Recruitment and Staffing Market Size, Share | Industry Report [2025-2033] (Ch. 3)
- European staffing market set to improve in 2025: Executive Forum Europe (Ch. 3)
- Employment Placement Agencies in Europe Industry Analysis, 2025 (Ch. 3)
- Europe Governance, Risk and Compliance Platform Market, 2033 (Ch. 3)
- Enterprise Governance, Risk And Compliance Market Size, ... (Ch. 3)
- Dental’s Global Sector Health in 2025 - Lincoln International LLC (Ch. 3)
- European Pet, Vet & Animal-Health Sector Overview | Hyde Park Capital (Ch. 3)
- Which sub sectors of European HealthTech and MedTech are most likely to see consolidation in 2026? (Ch. 3)
- European Dental Market: Consolidation and Growth - Flipbook by Heligan Group | FlipHTML5 (Ch. 3)
- Retail Healthcare Continues to Consolidate in Europe | Bain & Company (Ch. 3)
- Dental Practice EBITDA Multiples: 2026 Report (Ch. 3)
- The future of private equity fund administration (Ch. 4)
- Top Trends in Fund Administration 2025 (Ch. 4)
- Europe Engineering Services Market Size & Outlook, 2030 (Ch. 4)
- Europe Engineering Consultation Market, Outlook and Forecast 2025-2032 (Ch. 4)
- Sweco - Wikipedia (Ch. 4)
- Q4 and Year-end Report 2025 Sweco AB (publ) (Ch. 4)
- Engineering Consulting Services Market Size & Share, Forecast Report 2035 (Ch. 4)
- Europe Facility Management Market Size & Competitors (Ch. 4)
- European Facility Management Market Size, Forecast to 2030 (Ch. 4)
- Assemblin Caverion Group (Ch. 4)
- Europe Facility Management Market Size & Growth Report, 2030 (Ch. 4)
- Triton announces strategic combination of Assemblin and Caverion (Ch. 4)
- European Digital Agency M&A: The Shift to End-to-End Digital Service Providers | Investec Business Advisory (Ch. 4)
- IAB Europe (Ch. 4)
- Top 31 Advertising Agencies in Europe For Stellar Results in 2025 [Reviewed in June] - inBeat Agency (Ch. 4)
- Europe Corporate Training Market Growth Analysis - Size and Forecast 2025-2029 | Technavio (Ch. 4)
- Europe Corporate Training Industry Report 2026 | Market Size 33.081 USD Million, Share, CAGR (7.569%), Forecast 2033 (Ch. 4)
- Environmental Consulting Market Size & Growth to 2030 (Ch. 5)
- Sustainability Consulting Services Market Analysis | 2035 (Ch. 5)
- Global Environmental & Sustainability Consulting Market Assessment | Environment Analyst (Ch. 5)
- Europe Legal Services Market Size, Share & Growth, 2034 (Ch. 5)
- Legal Process Outsourcing Market Size, Share | Growth [2032] (Ch. 5)
- Europe Data Analytics Market Size, Share & Trends, 2033 (Ch. 5)
- Europe Big Data Market Size, Share, Trends & Growth, 2033 (Ch. 5)
- Logistics Market in Europe Growth Analysis - Size and Forecast 2025-2029 | Technavio (Ch. 5)
- Digital Supply Chain & Logistics Tech Research Report 2026: A $146.92 Billion Market by 2031 from $72 Billion in 2025 with SAP, Oracle, Blue Yonder, DHL, and Schneider Electric Leading (Ch. 5)
- Logistics in Europe: What to Expect in 2025 and How to Prepare - Sobel Network Shipping Co., Inc. (Ch. 5)
- Follow the leaders: global acquirers are reshaping European insurance broking (Ch. 5)
- FTI Consulting’s 2024 European Insurance M&A Barometer | FTI (Ch. 5)
- One Content With Little Uniformity: Insurance Brokerage in Europe - MarshBerry (Ch. 5)
- The year insurance brokers lost the tailwind - MarshBerry (Ch. 5)
- Insurance Services Market Update – June 2025 (Ch. 5)
- Opinion: Will 2026 see swathe of IPOs as the consolidation of consolidators well runs dry? | Insurance Times (Ch. 5)
- Insurance Broker M&A Valuation Gap: Why Strategic Fit Beats EBITDA Multiples (Ch. 5)
- European Commission – CSRD overview (Ch. 5)
- McKinsey – economic potential of gen AI (Ch. 5)
- Market Data Forecast – Europe LPO (Ch. 5)
- Grand View Research – Europe Data Analytics (Ch. 5)
- MarshBerry EU blog (Ch. 5)
- McKinsey – insurance M&A commentary (Ch. 5)
- Global M&A trends in industrials and services: 2026 outlook | PwC (Ch. 6)
- Global M&A trends in financial services: 2026 outlook | PwC (Ch. 6)
- European M&A Market 2025–2026 (Ch. 6, 7)
- Top 10 Big Deal Trends That Will Shape European M&A In 2026 (Ch. 6, 8)
- The State of Nordics Private Equity 2025 | Gain.pro (Ch. 7)
- 12 Predictions for European Private Equity Activity in 2025 | Baird (Ch. 7)
- AI Theater vs. Readiness: 4 Questions Every Exec Must Ask | DesignRush (Ch. 7)
- New Diligence Challenge: Uncovering AI Risks and Opportunities | Bain & Company (Ch. 7, 8)
- Everything You Need to Know Before Expanding into the Nordics - Excelerate360 (Ch. 7)
- European PE's dealmaking predictions for 2026 - PitchBook (Ch. 7, 8)
- State of Private Equity (PE) Report Europe Q1 2025 June 2025 (Ch. 7)
- European Private Equity Monitor 2025 (Ch. 7)
- European Private Equity Monitor 2026 (Ch. 8)
- PE finance transformation objectives for the first 100 days | Grant Thornton (Ch. 8)
- Post Acquisition Work: The First 100 Days | A Simple Model (Ch. 8)
- Unlocking productivity with generative AI: Evidence from experimental studies (Ch. 8)
- AI in Professional Services: 2025 State of the Industry Report (Ch. 8)
- Europe 2026 salary projections: Countries with the strongest pay rises | Euronews (Ch. 8)
- New data release: ECB wage tracker suggests lower wage growth and gradual normalisation of negotiated wage pressures in 2026 (Ch. 8)
- European Outlook 2026: From Risk Recognition to Action (Ch. 8)
- AI in the workplace: A report for 2025 | McKinsey (Ch. 8)