The €450B Roll-Up Opportunity in Europe's Service Economy
An investment-grade consolidation map for mid-market PE — 15 sub-sectors ranked, scored, and equipped with platform thesis templates.
The €450 Billion Roll-Up Opportunity Hiding in Europe's Service Economy
An executive briefing distilled from JABB Fusion's 8-chapter deep research report mapping the buy-and-build consolidation opportunity across 15 European tech-enabled business services sub-sectors.
While the world obsesses over AI valuations, SaaS multiples, and whether the next GPT model will replace software companies, the largest private equity opportunity in Europe is hiding in plain sight — in the unsexy, fragmented, founder-owned services businesses that form the backbone of every economy on the continent.
We're talking about the IT managed services provider in Stuttgart with €8M revenue, 80% recurring contracts, and a 60-year-old founder with no succession plan. The compliance advisory firm in Amsterdam running €5M through a proprietary monitoring portal. The insurance broker in Manchester whose renewal book generates 90%+ retention and the owner wants to retire.
These are not venture-backed unicorns. They do not have pitch decks. Many don't even have a website worth mentioning.
And yet, when assembled into platforms — with technology standardized, operations centralized, and bolt-ons integrated at pace — they routinely generate 2–3× gross MOIC for mid-market PE sponsors.
This is the European Tech-Enabled Business Services (TEBS) opportunity. It is a €350–450 billion addressable market spanning 15 sub-sectors, six country clusters, and thousands of acquisition candidates. And it is the dominant theme in European mid-market private equity heading into 2026.
This briefing distills the core findings from our comprehensive 8-chapter research report — covering 15 sub-sector modules, cross-sector rankings, diligence toolkits, and platform thesis templates — into a single, actionable executive briefing.
What Is TEBS — and Why It Matters More Than SaaS for Mid-Market PE
Let's be precise about what we mean. Tech-Enabled Business Services are service businesses where technology is a material driver of delivery efficiency, workflow embedding, data leverage, or revenue quality — without being pure software companies.
The service is the commercial offer. Technology amplifies the margin, the stickiness, and the scalability.
A company qualifies when at least one of these is demonstrable:
- Delivery efficiency — technology reduces labour hours per unit of revenue
- Workflow embedding — client-facing tools create switching costs beyond contracts
- Data leverage — proprietary data from service delivery enhances the value proposition
- Revenue model quality — tech enables a shift from project billing to recurring streams
What TEBS is not: pure SaaS, legacy labour-only services with cosmetic technology wrappers, or firms where tech is an internal back-office function that doesn't change client delivery.
Why this matters for PE: TEBS sits at the intersection of contracted services revenue (downside protection) and technology-driven margin expansion (upside optionality). Unlike SaaS — where entry multiples now regularly exceed 12–15× revenue — mid-market TEBS platforms can be entered at 7–10× EBITDA with immediate cash flow, and exited at 12–16× when platform proof is established.
The maths is straightforward: buy fragmented, tech-enable during the hold, prove the platform, exit at a premium. The execution is where alpha comes from.
The Services-to-Software Continuum: Where Value Actually Accretes
The single most important framework in this report is the services-to-software continuum — a five-point spectrum from pure labour delivery (score 1) to near-software (score 5). Every TEBS business sits somewhere on this spectrum, and its exact position determines entry multiple, margin trajectory, and exit narrative.
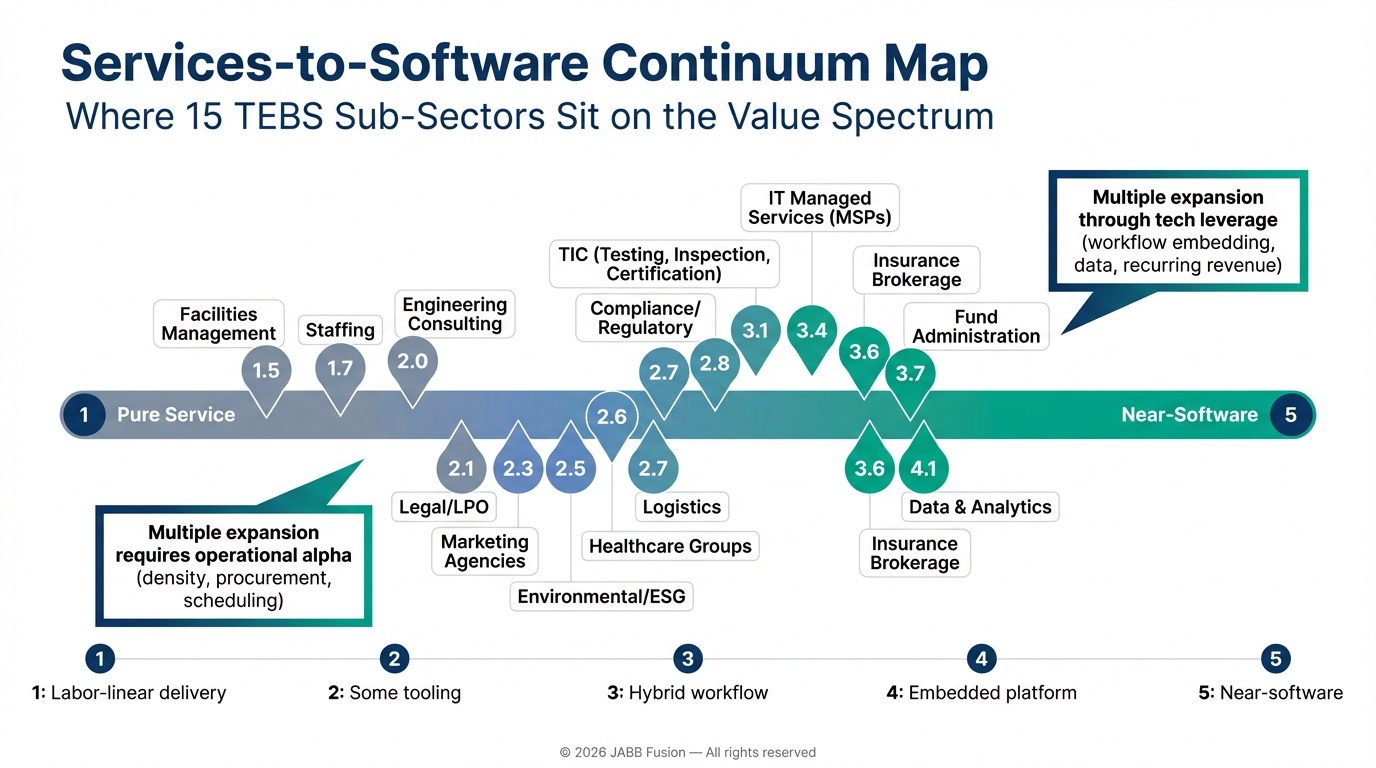
The key insight: value accretion is not linear. The most material valuation step-ups occur when a business crosses two practical thresholds:
Transition 1: "Hours" → "Managed outcome" (score ~2.0 to ~3.0) The company standardizes delivery, deploys tool-assisted workflows, and shifts toward measurable outcomes. Margin improves and underwriting confidence increases.
Transition 2: "Managed outcome" → "Embedded workflow" (score ~3.0 to ~4.0) Client switching costs become operational — integrations, data models, portals, compliance routines — not just contractual. This is where PE buy-and-build creates the most value: you enter at a "services" multiple and exit at a "tech-enabled platform" multiple.
The PE thesis in a sentence: Move the portfolio company rightward on the continuum during the hold period. Increase recurring revenue, deepen workflow embedding, build data assets. Justify a higher exit multiple.
Within-sector variance often exceeds between-sector variance. An MSP with automated remediation, a standardized PSA stack, and 80%+ recurring revenue behaves economically very differently from a break-fix reseller — even though both are "IT services." The target-level diagnostic matters more than the sector label.
The Consolidation Map: Where to Deploy Capital
We scored all 15 sub-sectors on six dimensions — fragmentation, integration complexity, tech leverage, pricing power, labour risk, and exitability — using a 1–5 weighted rubric. The results define four investment archetypes.
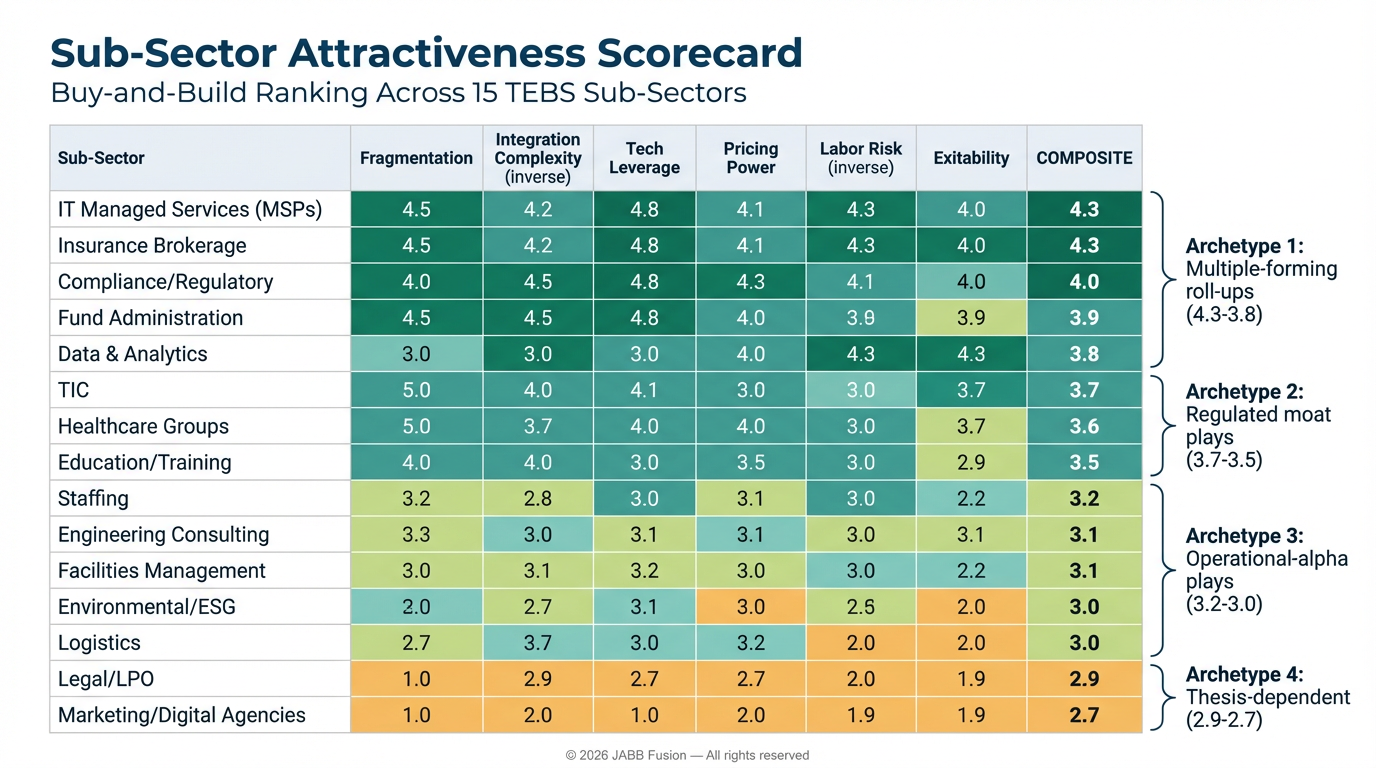
Archetype 1: "Multiple-Forming Tech-Enabled Roll-Ups" (Composite ≥ 3.8)
These are your priority origination targets — the sectors where technology, fragmentation, and integration feasibility jointly support both bolt-on density and multiple expansion.
Insurance Brokerage & Distribution — 4.3/5 The most consistent buy-and-build return profile in European TEBS. Renewal-led recurrence (retention typically >88%), deep bolt-on density, and data-enabled cross-sell make this the "compounder's dream." PE-backed consolidators already account for the vast majority of deal count in the space. The central diligence item: producer retention. If your top 5 producers walk, the thesis breaks.
IT Managed Services (MSPs) — 4.3/5 Recurring revenue + automation + security attach create a repeatable integration and re-rating pathway. Thousands of founder-led sub-€15M MSPs across Europe, many approaching generational transition. The key risk: tool-stack standardization and cyber talent scarcity. The key upside: a "Cyber-MSP" platform bundling IT operations + managed security + compliance for the Mittelstand is a thesis with 15×+ exit potential.
Compliance/Regulatory Services — 4.0/5 Strong productization potential. Value creation hinges on converting projects to monitoring subscriptions and building workflow portals. Regulatory tailwinds (CSRD, DORA, NIS2) create multi-year demand. The red flag: "portal as file dump" — technology that does not actually change switching costs.
Fund Administration — 3.9/5 High switching costs and automation potential. Portal adoption and embedded workflows create real stickiness. Integration risk concentrates in platform migrations and control environments. The alternatives operations boom (PE/VC/RE) creates structural demand growth.
Data & Analytics Services — 3.8/5 Highest tech ceiling, but also highest execution dispersion. Winners institutionalize IP reuse, managed "run" contracts, and standardized delivery. The best platforms combine senior talent with CEE delivery centers and a governed IP library. This is where AI genuinely amplifies the thesis — not as narrative, but as delivery leverage.
Archetype 2: "Regulated-Adjacent Moat Plays" (Composite 3.5–3.7)
TIC, Healthcare Groups, Education & Training — sectors with real defensibility (accreditation, clinical governance, certification) but slower platform velocity and more complex integration constraints.
Archetype 3: "Operational-Alpha Density Plays" (Composite 3.1–3.4)
Facilities Management, Staffing, Engineering, Environmental, Logistics — these can be excellent buy-and-build arenas, but the tech premium must be built, not expected. Underwrite on density, procurement, scheduling, and contract repricing. Tech-enabled re-rating is upside, not the plan.
Archetype 4: "Thesis-Dependent" (Composite < 3.1)
Legal/LPO and Marketing Agencies — high disruption risk from AI (especially in marketing content and basic legal process). Investable only with an explicit repositioning thesis toward managed services, outcomes pricing, and workflow embedding.
What Separates 6× from 12× EBITDA
Sector labels don't determine multiples. Quality does. The gap between a 6× undifferentiated services bolt-on and a 14× recurring-revenue platform is far wider than any PE-versus-corporate spread.
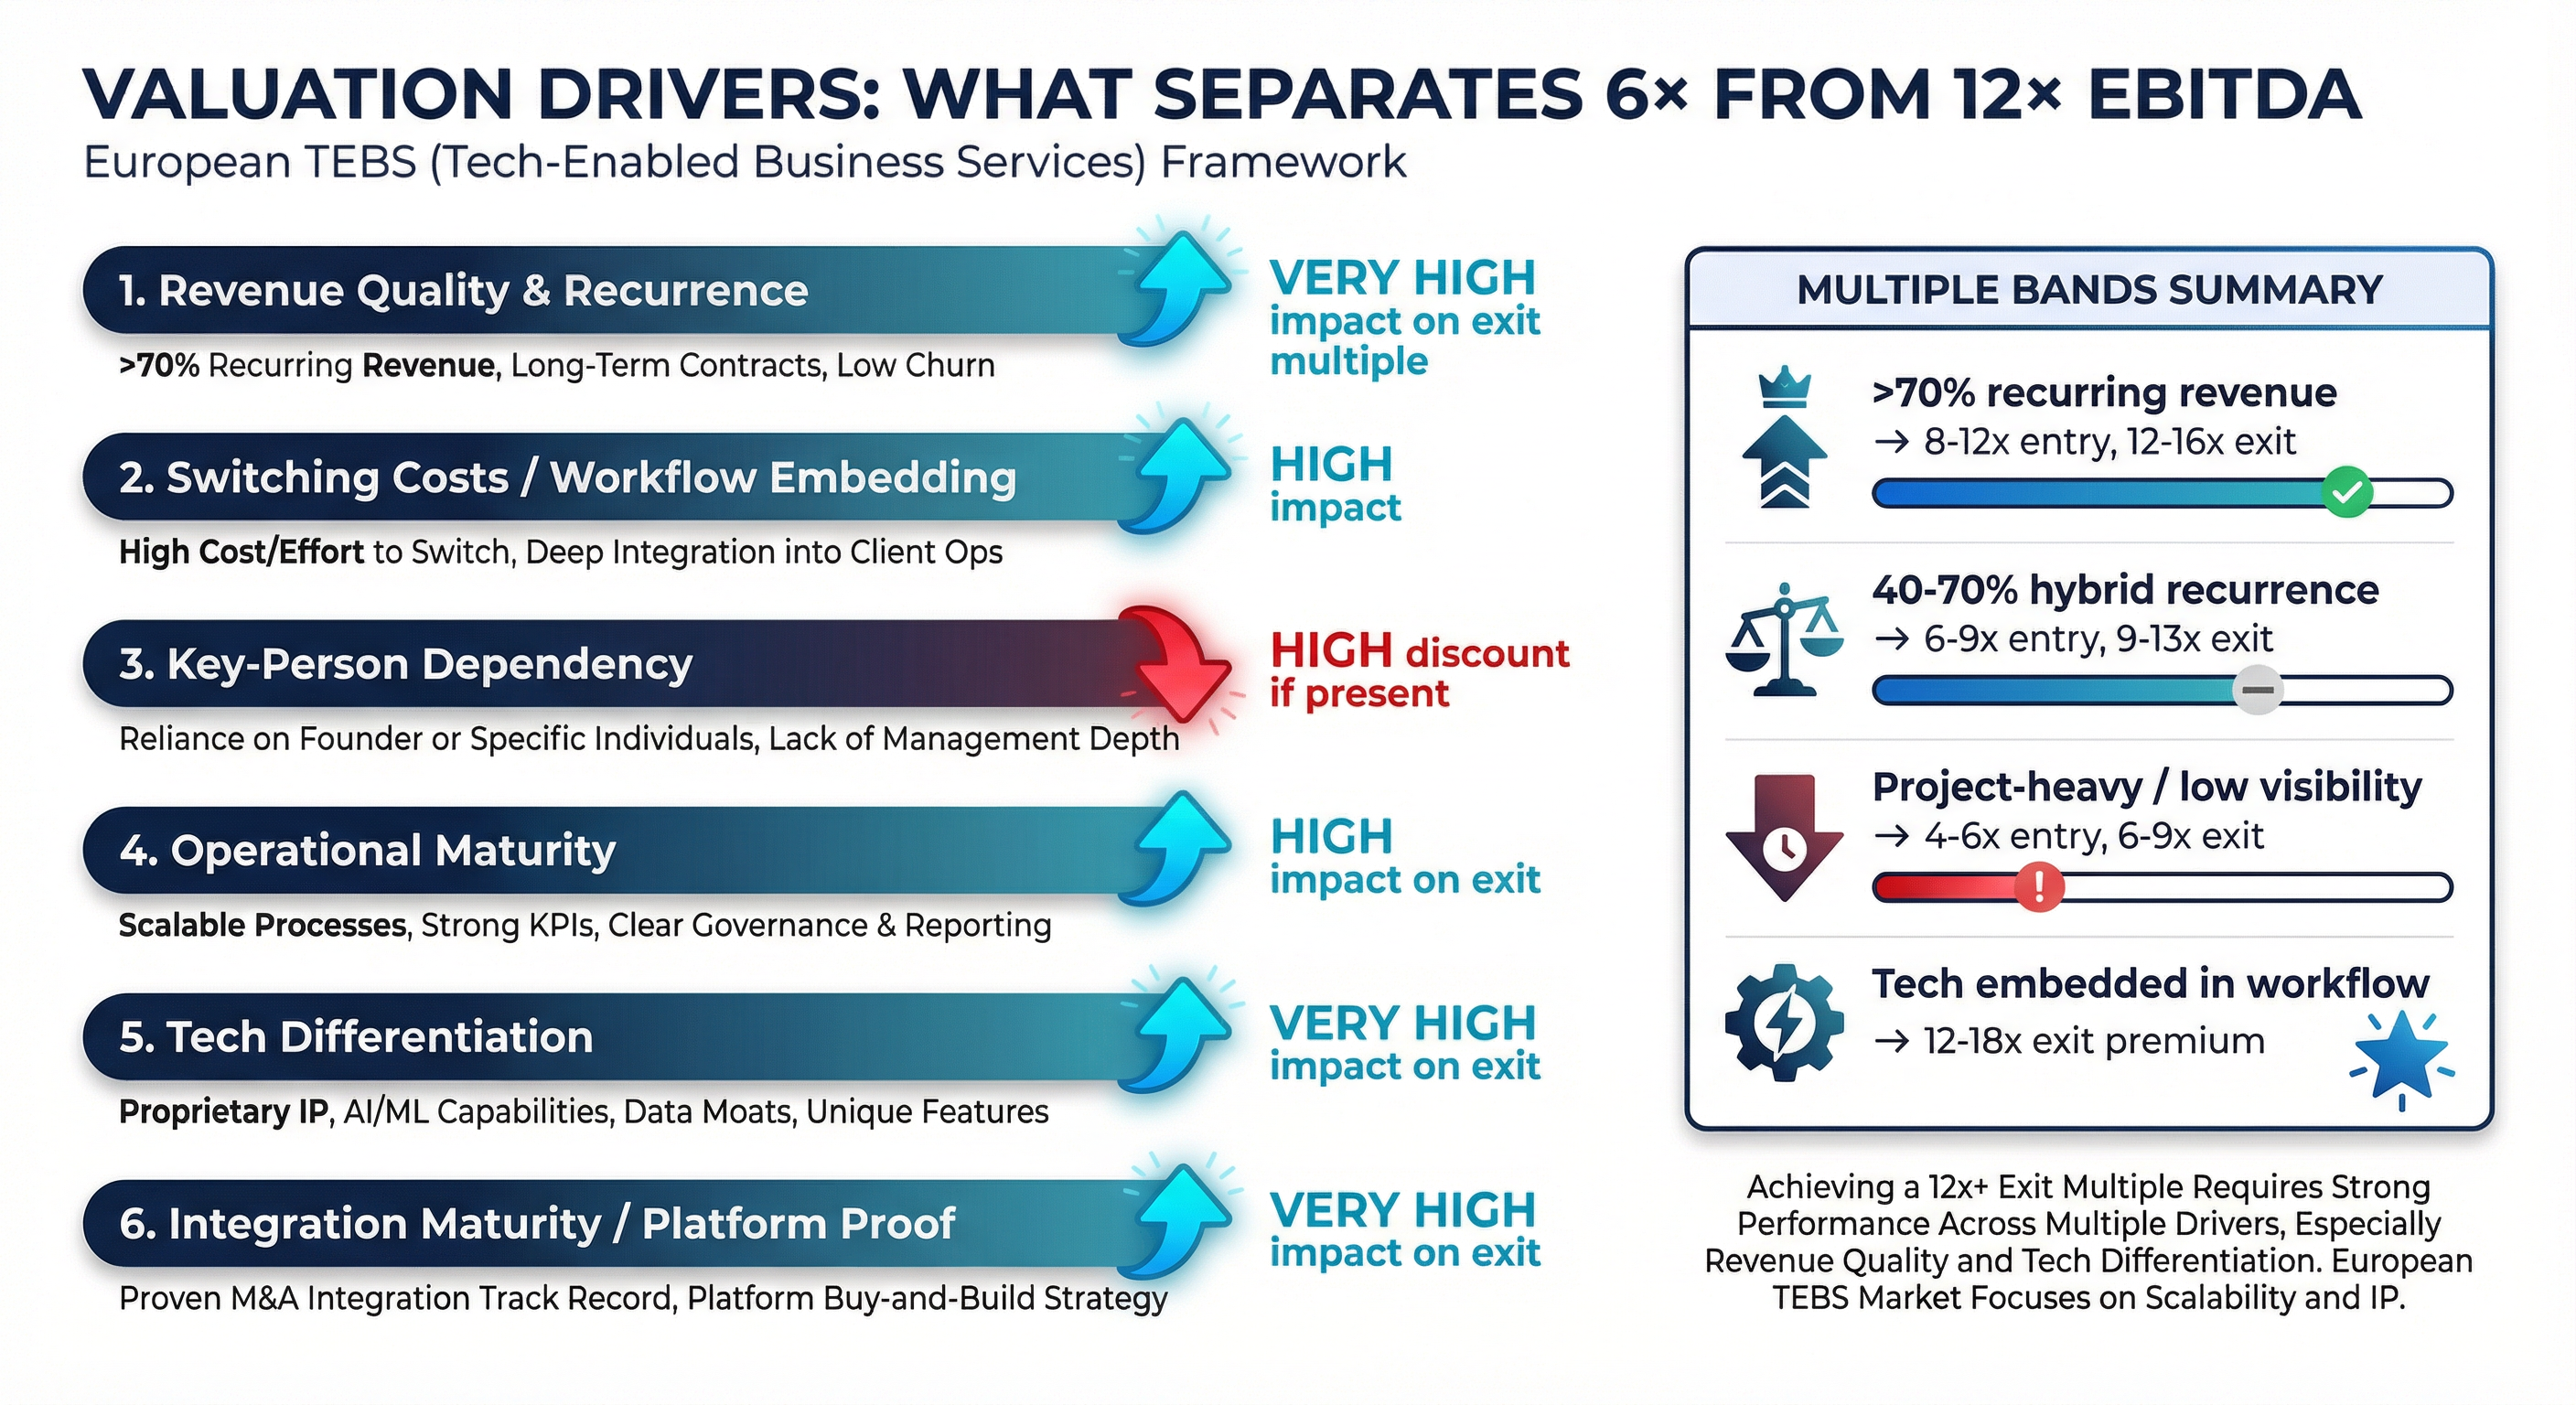
Six drivers explain essentially all of the valuation dispersion in European mid-market TEBS:
| Observable Condition | Entry Multiple | Exit Multiple |
|---|---|---|
| >70% recurring revenue | 8–12× | 12–16× |
| 40–70% hybrid recurrence | 6–9× | 9–13× |
| Project-heavy / low visibility | 4–6× | 6–9× |
| Tech embedded in client workflow | 8–12× | 12–18× |
| Top 3 clients >40% of revenue | −1–2× discount | Exit constrained |
| Federated group, weak integration | N/A | Discount at exit |
The screening question is explicit: Does technology change the unit economics of delivery and switching costs — or does it merely support the back office?
If the answer is "back office only," you're buying a services consolidator, not a tech-enabled platform. The multiple will reflect that at exit.
The Buy-and-Build Maths: A Worked Example
This is how the return engine actually works in European mid-market TEBS:
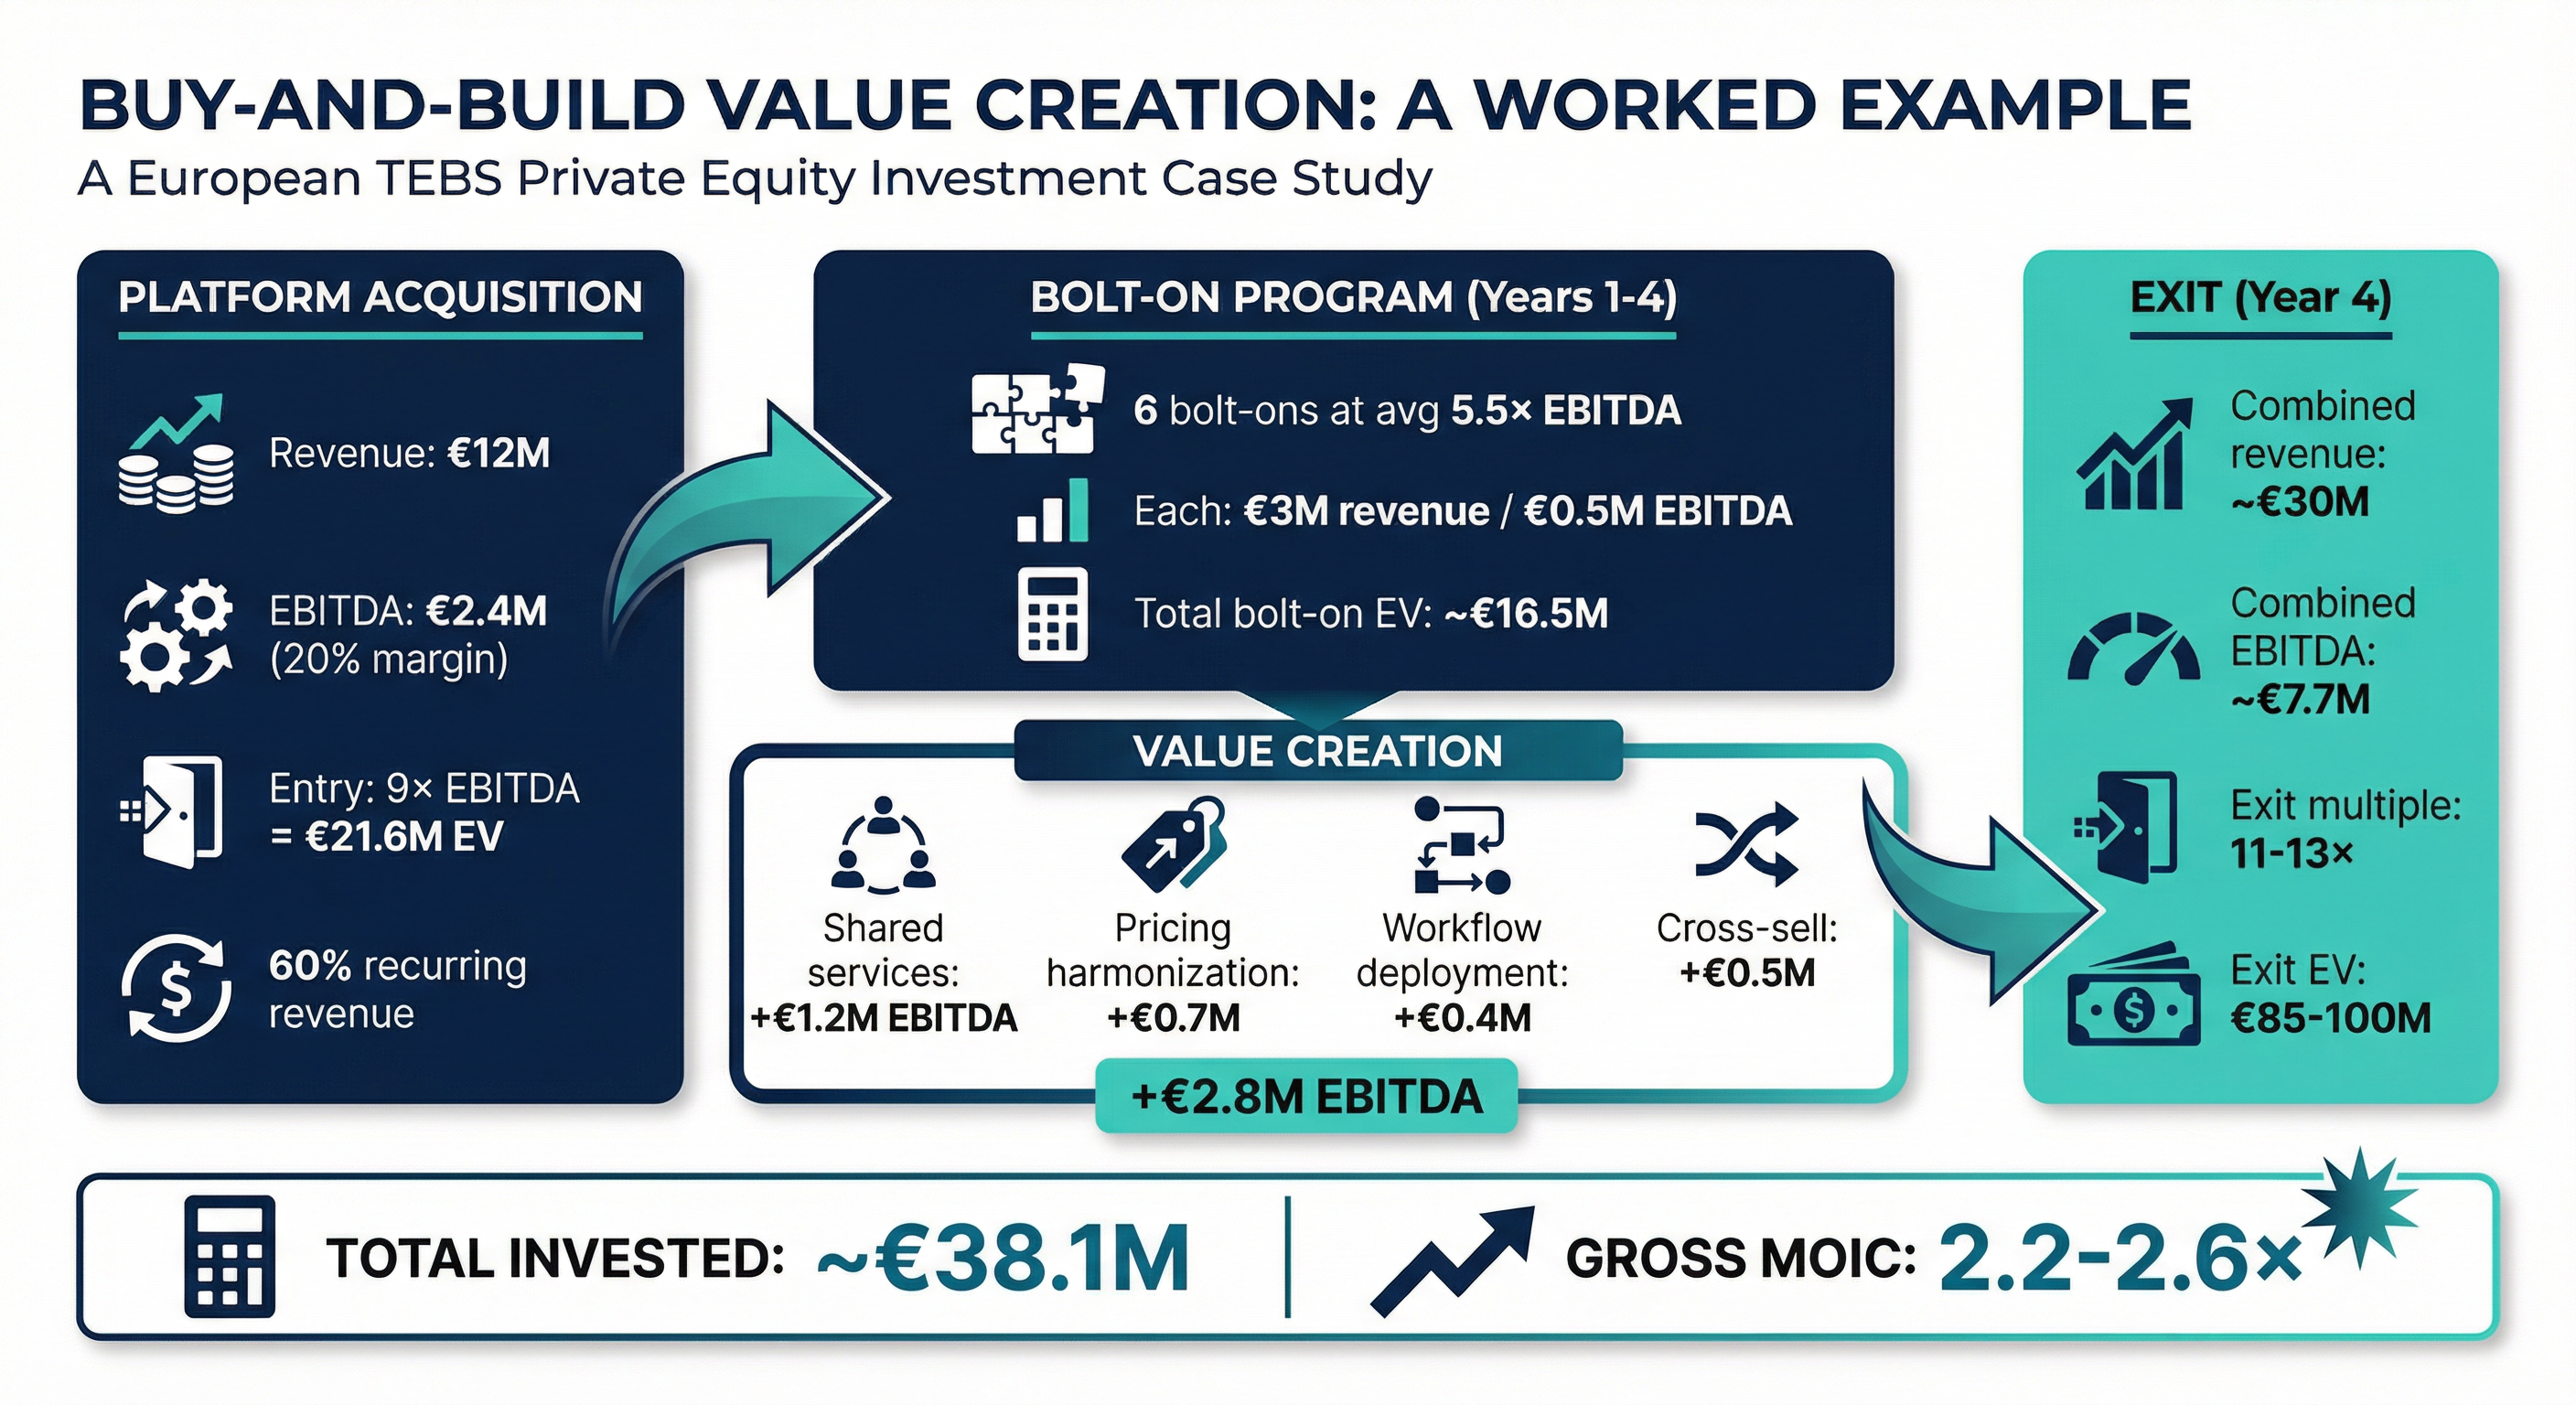
Platform acquisition: Compliance advisory firm, €12M revenue, €2.4M EBITDA (20% margin), entered at 9× (€21.6M EV). 60% recurring. Proprietary workflow tool.
Bolt-on program (years 1–4): Six bolt-ons at average 5.5× EBITDA. Each €3M revenue / €0.5M EBITDA. Total bolt-on EV: ~€16.5M.
Value creation levers:
- Shared services centralization: +€1.2M EBITDA
- Pricing harmonization: +€0.7M
- Platform workflow deployment: +€0.4M
- Cross-sell revenue (€2M at 25% margin): +€0.5M
Exit (year 4): Combined revenue ~€30M. Combined EBITDA ~€7.7M. Exit multiple 11–13× (credible workflow/recurrence/platform proof). Exit EV: €85–100M.
Total invested: ~€38.1M. Gross MOIC: 2.2–2.6× (pre-leverage).
The return engine is: multiple arbitrage + integration synergies + tech-enabled operational leverage, with the exit multiple earned through platform proof — not assumed at entry.
The Quadrant That Matters: Fragmentation × Tech Leverage
Not every fragmented market is a good roll-up. And not every tech-enabled vertical lends itself to buy-and-build. The intersection is what matters.
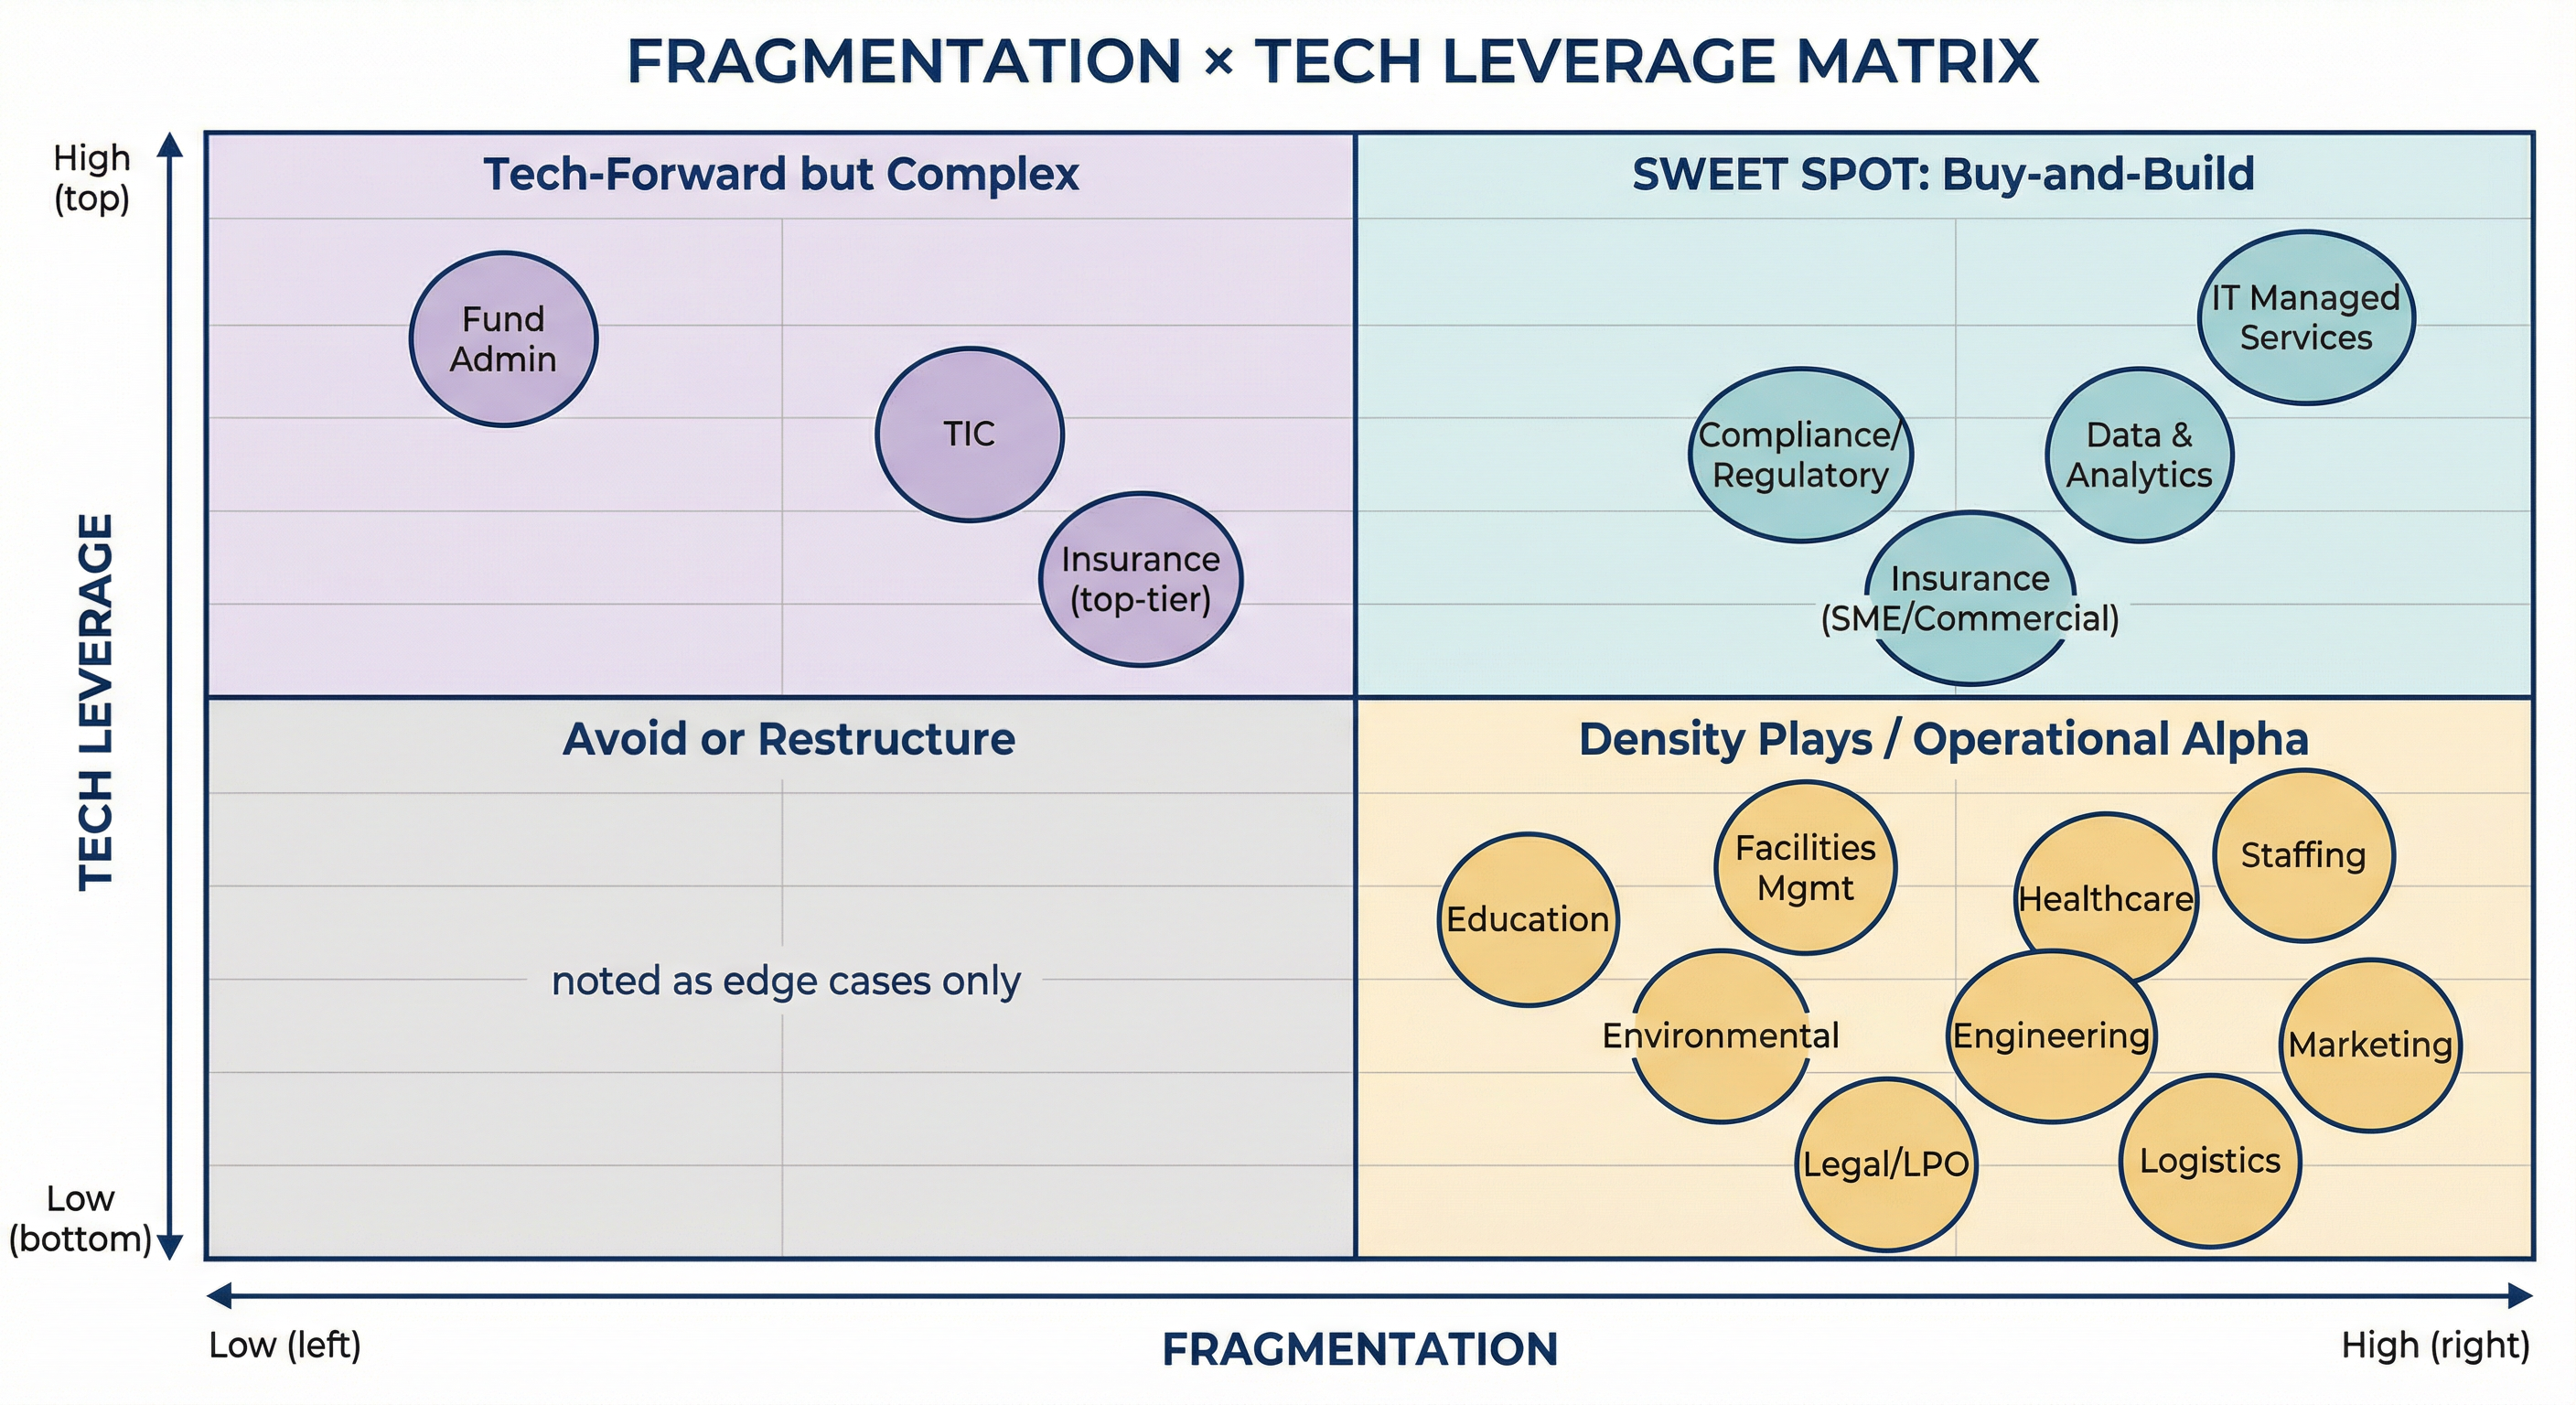
Quadrant I ("Sweet Spot") — high fragmentation + high tech leverage: IT MSPs, Compliance, Data & Analytics, Insurance Brokerage (SME/commercial). These are the sub-sectors where platform building works at pace.
Quadrant II ("Tech-Forward but Complex") — Fund Admin, TIC, and top-tier Insurance: high tech leverage but more consolidated markets and heavier integration constraints. Fewer, higher-quality deals.
Quadrant IV ("Density Plays") — Staffing, Facilities, Healthcare, Education, Engineering, Environmental, Marketing, Legal, Logistics: highly fragmented but lower tech leverage. Returns depend on operational alpha — procurement, scheduling, utilization — not technology re-rating.
Quadrant III ("Avoid or Restructure") — edge cases only. Low tech leverage + high integration complexity = unattractive risk-return.
The Seven Thesis Cards: Where to Build Platforms in 2026–2028
Our report identifies seven specific, actionable platform concepts with real-world entry criteria:
1. Pan-DACH Cyber-MSP Platform — Managed IT + managed security for SMEs (50–500 employees). Target: 80%+ recurring, NRR >100%, security attach >40%. Exit as "technology-powered cyber-MSP for the Mittelstand."
2. European ESG Assurance & Reporting Platform — Reporting support + evidence readiness for CSRD-scope corporates. Evidence-trail workflows and auditability.
3. Continental European Commercial Insurance Broker Roll-Up — SME commercial P&C + specialty. BMS strategy, renewal automation, cross-sell analytics. EBITDA margin >25%.
4. Alternatives Fund Administration Platform (Nordics + Benelux) — Fund accounting + investor reporting + ManCo services for PE/VC/RE/infrastructure GPs. Portal adoption + automation + nearshore processing.
5. Verticalised Compliance-as-a-Service (Financial Services) — Subscription monitoring + reporting + evidence workflows for banks, asset managers, payments companies.
6. UK + Nordics Data & Analytics Platform (with CEE delivery) — Data engineering + managed analytics with reusable accelerators and governed IP library.
7. Southern European Dental/Vet Multi-Site Platform — Private-pay dense urban clusters with scheduling, recall, procurement, and clinical governance.
Each thesis card maps to specific entry criteria, bolt-on sequencing, KPI targets, and exit narratives detailed in the full report.
The AI Question: Structural Help, Not Hype
The most investable AI opportunity inside TEBS is usually not building AI models. It is building the services layer that makes AI usable, safe, compliant, and operational for mid-market enterprises.
TEBS firms increasingly act as the "AI distributor" — selecting, implementing, governing, and operating AI for clients. This is where new recurring services emerge and where multiple expansion can genuinely be earned.
The AI impact across TEBS sub-sectors is nuanced:
- Structurally helped (augmentation): MSPs, Fund Admin, Compliance, Data & Analytics, Insurance, TIC, Healthcare, Education — AI improves delivery economics and creates new service lines
- Mixed (augmentation + selective substitution): Staffing, Engineering, Environmental, Logistics — AI helps with scheduling, matching, reporting, but doesn't transform the core delivery model
- Genuine substitution risk: Marketing/Agencies (AI content commoditization) and parts of Legal/LPO (AI can automate basic contract and review work) — investable only with a repositioning thesis
The IC-level heuristic: If the target mentions "AI" more than five times in the CIM but cannot produce a single before/after KPI dashboard, treat it as AI theatre until proven otherwise.
The Screening Toolkit: Go/No-Go in Three Minutes
For deal teams evaluating live TEBS opportunities, we distill the report's frameworks into a rapid screening filter:
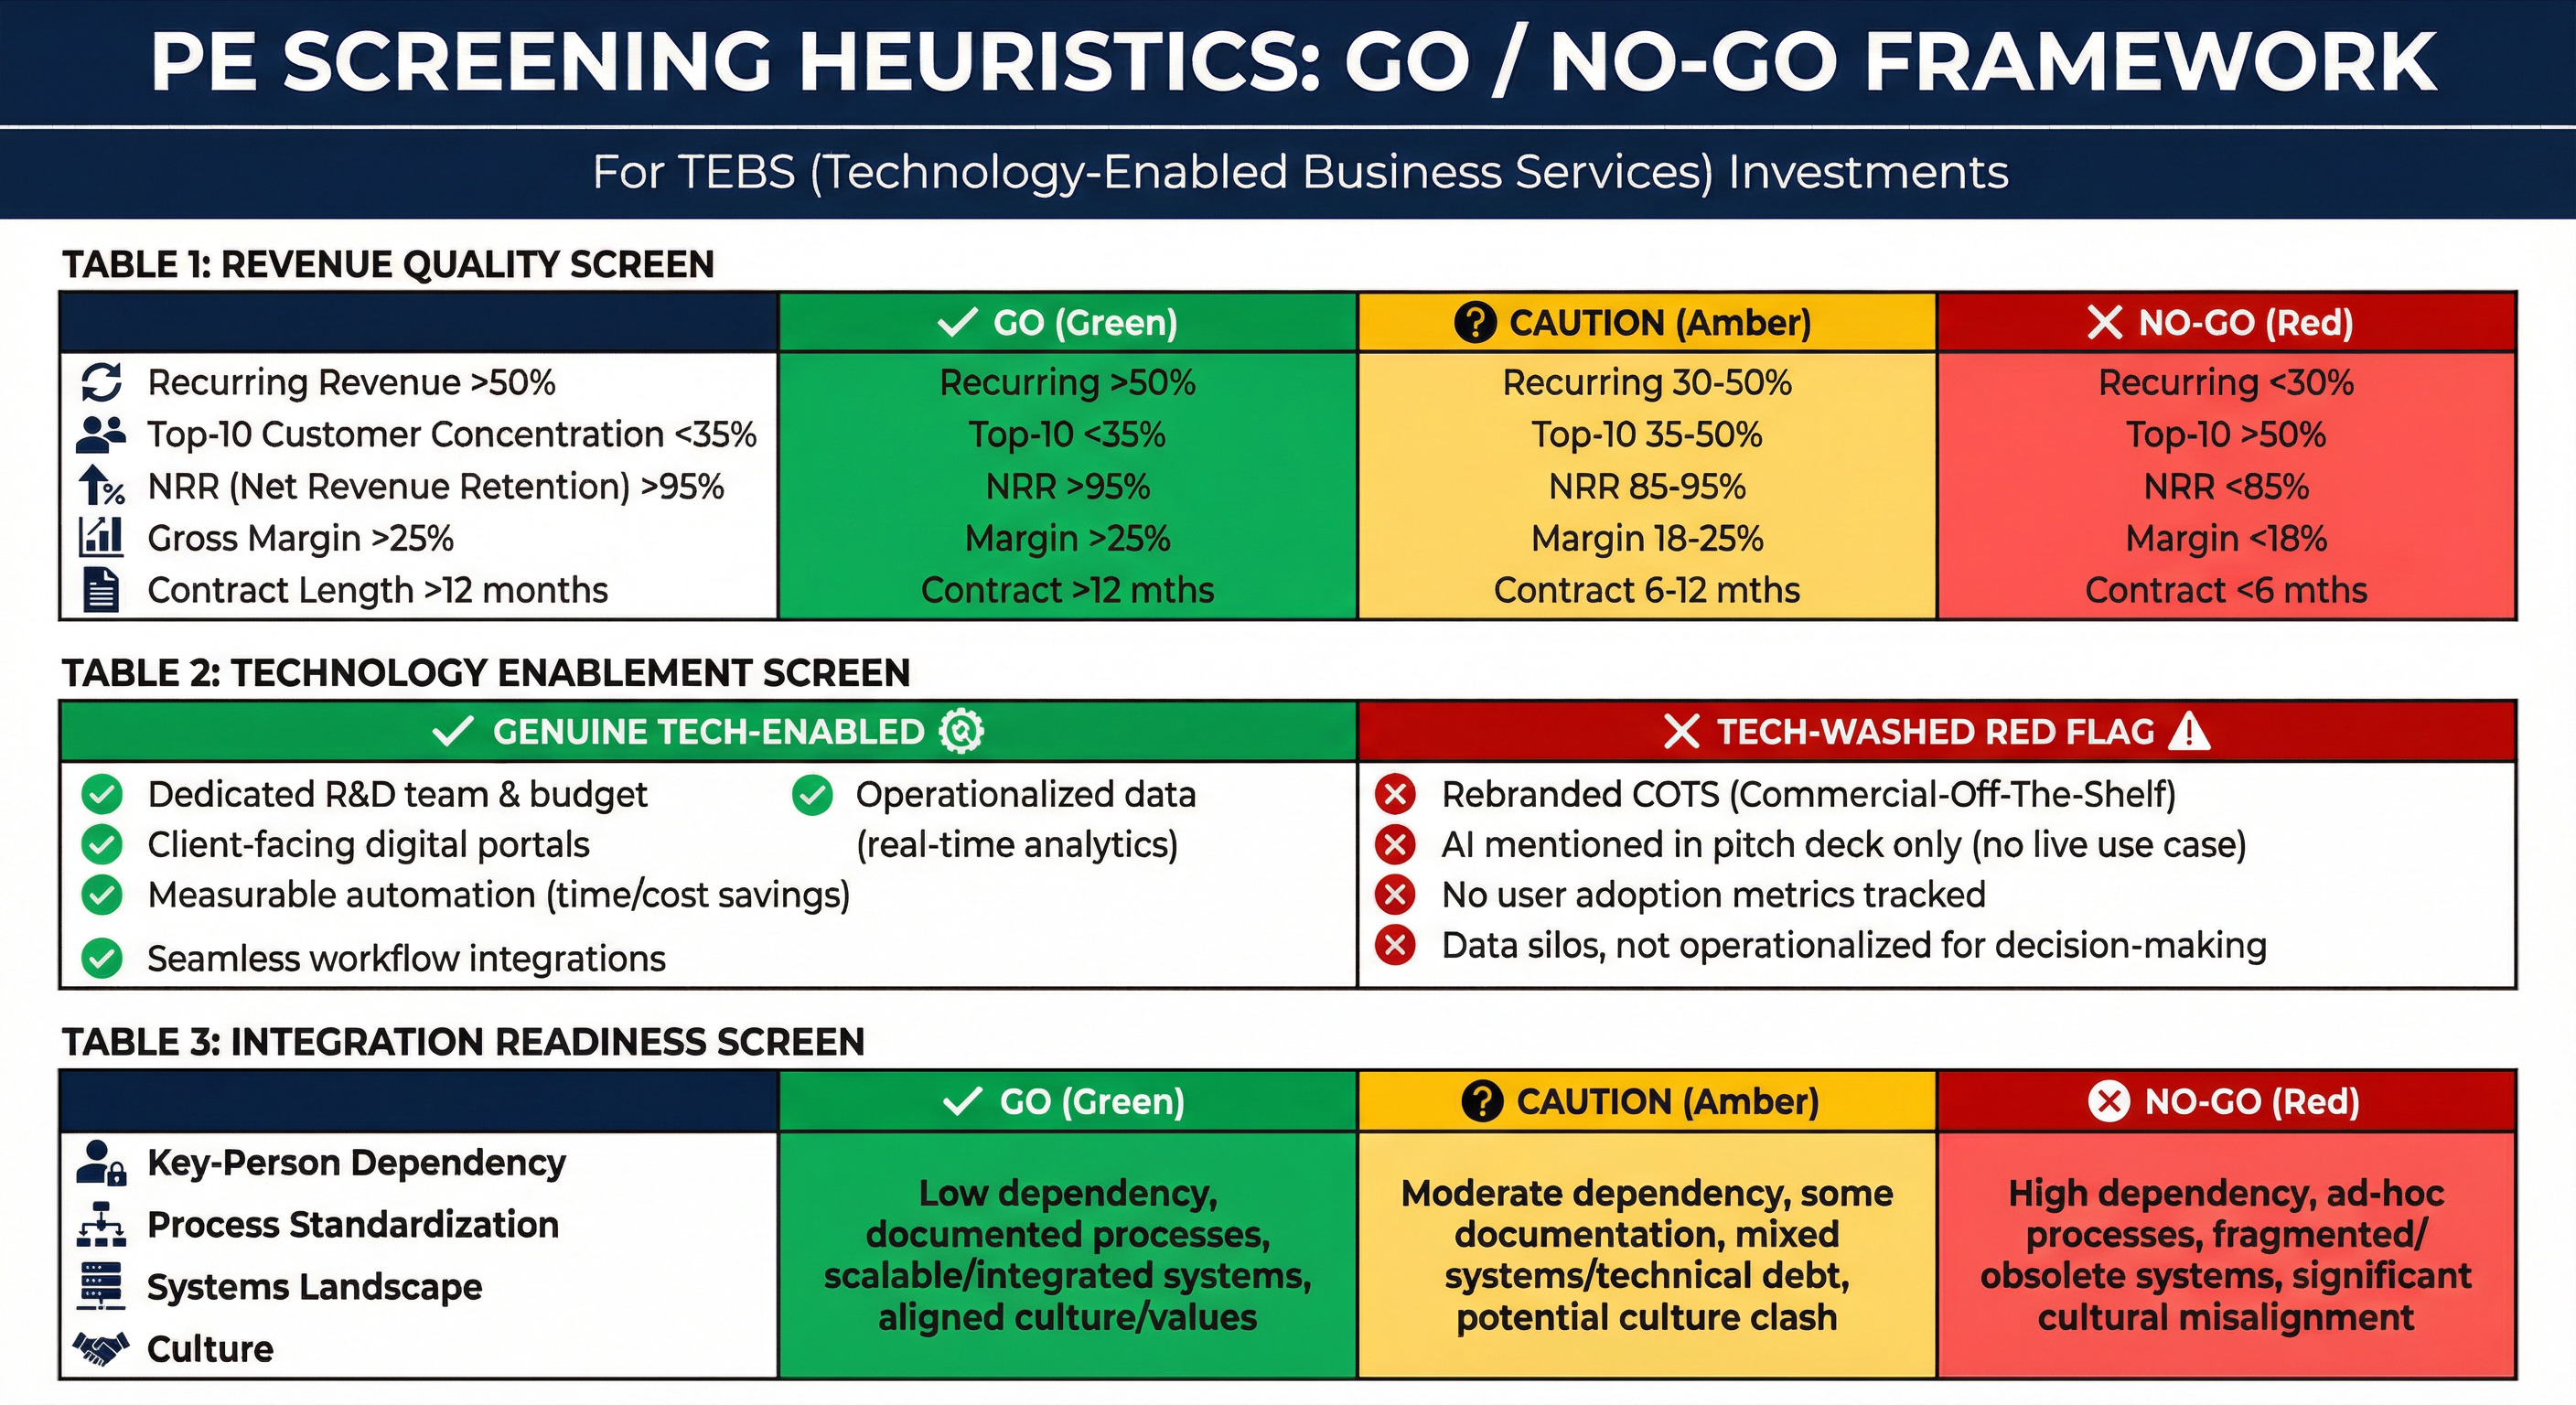
Revenue Quality Screen:
- Go: >50% recurring, top-10 clients <35%, NRR >95%, gross margin >25%, contracts >12 months
- No-Go: <30% recurring with no conversion plan, single client >20%, <85% NRR, <18% margin
Technology Screen:
- Genuine: Dedicated R&D team, client-facing portals with real adoption, measurable automation, operationalized data
- Red Flag: Rebranded off-the-shelf tools, "AI" in deck only, no adoption metrics, data collected but not used
Integration Screen:
- Go: Distributed revenue ownership, SOPs + KPI cadence, modern systems + APIs, professional management
- No-Go: Founder controls >30% of revenue + all relationships, no unit economics, undocumented legacy core
The Integration Model That Wins Repeatedly
Across all 15 sub-sectors, one integration model dominates successful buy-and-build:
Centralise governance. Federate relationships.
Centralise on Day 1: Finance, compliance, data, procurement, tooling governance, KPI reporting. Non-negotiable. This is where synergies are captured.
Federate initially: Client relationships, local brands, delivery teams. Protect retention. Earn trust. Then selectively harmonize over 12–36 months as the platform matures.
The platforms that fail typically do one of two things:
- Over-federate — creating a "collection of businesses" with no synergy capture and a services-level exit multiple
- Over-centralise too fast — destroying client relationships and triggering attrition of key delivery staff
The 100-day integration plan should target: financial integration within 60 days, systems migration roadmap within 90 days, commercial harmonization within 12 months.
Regional White Spaces: Where to Look Now
Not every European region is equally attractive for every TEBS sub-sector. The white spaces — under-consolidated markets with high fragmentation and willing sellers — are geography-specific:
| Region | Opportunity | Why Now |
|---|---|---|
| DACH | Insurance brokerage, compliance, MSPs | High fragmentation + Mittelstand density + increasing cross-border sponsor interest |
| Southern Europe | Healthcare groups, FM, staffing | Lower entry multiples + extremely local markets + professionalization gap |
| Nordics | Data & analytics, fund admin, compliance | Digitally mature buyers + strong buy-and-build culture + 54% add-on intensity |
| CEE | Nearshore delivery centres (data, legal, fund admin) | Talent availability + wage arbitrage + governance uplift potential |
| France | Compliance, TIC, environmental | Large market + deal backlog from political uncertainty + specialist density |
| Benelux | Fund admin, logistics, insurance | International HQ density + cross-border operating norms + gateway to DACH/France |
What to Do Monday Morning
The report's capital allocation recommendations distill to five actions:
1. Priority origination in Archetype 1 sub-sectors. Insurance brokerage, IT MSPs, compliance, fund admin, data & analytics. These are the sectors where tech + fragmentation + integration feasibility jointly support repeatable multiple expansion.
2. Underwrite "platform proof," not just scale. Require early evidence of KPI standardization, tool-stack governance, and repeatable bolt-on integration cadence. The exit buyer will demand it.
3. Adopt the centralise-governance-federate-relationships model. Day 1 integration of finance, compliance, data, procurement, and tooling rules. Federate client relationships to protect retention.
4. Treat AI as a value-capture mechanism, not a narrative. Invest only where adoption and unit-economics uplift can be measured. Strict governance. Before/after KPI proof. No AI theatre.
5. In labour-heavy sectors, underwrite operational alpha first. Density, scheduling, procurement, and contract repricing should carry the base case. Tech-enabled re-rating is upside, not the plan.
This briefing distills findings from JABB Fusion's comprehensive research report: "European Tech-Enabled Business Services (TEBS): The Buy-and-Build Consolidation Map — 2026 Edition." The full report contains 8 chapters, 15 standalone sub-sector modules with A–H deep-dive structure, cross-sector rankings with sensitivity analysis, diligence checklists, integration playbooks, platform thesis templates with 18-month KPI dashboards, an AI impact matrix, and 109 verified sources.
JABB Fusion provides AI-orchestrated, human-QA'd deep research for the investment industry. For more information, visit jabbfusion.com.
Want the full picture?
This briefing covers the highlights. The full 8-chapter report includes 15 standalone sub-sector modules, diligence checklists, integration playbooks, platform thesis templates, and 109 verified sources.
Read the Full Research Report